
0

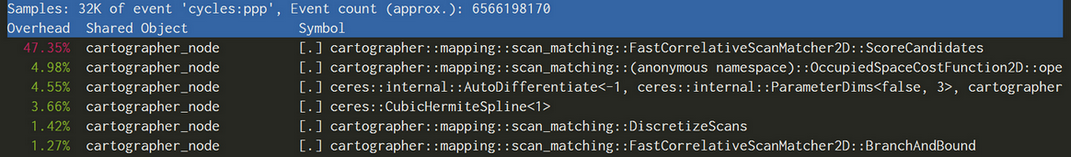
perf的常用操作
source link: https://charon-cheung.github.io/2022/11/16/%E5%B8%B8%E7%94%A8%E5%B7%A5%E5%85%B7/perf%E7%9A%84%E5%B8%B8%E7%94%A8%E6%93%8D%E4%BD%9C/
Go to the source link to view the article. You can view the picture content, updated content and better typesetting reading experience. If the link is broken, please click the button below to view the snapshot at that time.
perf的常用操作 | 沉默杀手
perf的常用操作
2022-11-16|常用工具|
Word count: 82|Reading time: 1 min
Recommend
About Joyk
Aggregate valuable and interesting links.
Joyk means Joy of geeK