
6

suricata加上elk分析机房入口全流量
source link: https://bajie.dev/posts/20231215-suricata_elk/
Go to the source link to view the article. You can view the picture content, updated content and better typesetting reading experience. If the link is broken, please click the button below to view the snapshot at that time.

Suricata加上elk分析机房入口全流量
2023-12-15
3 分钟阅读
suricata 是跟snort差不多的一个入侵检测工具,加上elk的图形界面,非常的好看。
原理是suricata的log发到elk里,这样就能通过kibana进行分析了
1、物理机需要开16G内存,16CPU,都不太够 2、物理机172.18.30.2的br3是交换机的Mirror口,进入的全部流量都被镜像了一份 3、suricata-18-31-31是虚机,需要将30.2的br3挂进来
virsh attach-interface  --domain suricata-18-31-31 --type bridge --source br3 --model e1000 --config --live
同时在31.31里,ifconfig up eth1把网卡起起来
tcpdump -i eth1有数据即可
4、首先安装java
rpm -ivh jdk-8u201-linux-x64.rpm
安装: 一、编译安装suricata
yum -y install epel-release

yum -y install jq cargo openssl-devel PyYAML lz4-devel gcc libpcap-devel pcre-devel libyaml-devel file-devel zlib-devel jansson-devel nss-devel libcap-ng-devel libnet-devel tar make libnetfilter_queue-devel lua-devel GeoIP-devel

wget https://www.openinfosecfoundation.org/download/suricata-4.1.8.tar.gz
tar zxvf suricata-4.1.8.tar.gz
cd suricata
./configure --libdir=/usr/lib64 --prefix=/usr --sysconfdir=/etc --localstatedir=/var --enable-nfqueue --enable-lua --enable-geoip --enable-profiling
make
make install-full

验证一下
suricata -V
This is Suricata version 4.1.8 RELEASE

查看build参数
suricata --build-info
suricata就装好了,还需要配一下suricata-update,规则才是最主要的,装好后最好每天更新一下规则
suricata-update update-sources
suricata-update list-sources

suricata-update enable-source ptresearch/attackdetection
suricata-update enable-source oisf/trafficid
suricata-update enable-source sslbl/ssl-fp-blacklist

suricata-update
suricata-update的用法
suricata-update list-enabled-sources
suricata-update disable-source et/pro
suricata-update remove-source et/pro
测试规则:
suricata -T
/etc/suricata/suricata.yaml的修改部分
HOME_NET: "[43.231.149.0/25]"
outputs被改过
outputs:
app-layer被改过
app-layer:
具体看附件中的suricata.yaml
/usr/bin/suricata -c /etc/suricata/suricata.yaml -i eth1 -D
二、编译安装ELK
rpm --import https://artifacts.elastic.co/GPG-KEY-elasticsearch

cat <<EOF | sudo tee /etc/yum.repos.d/elasticsearch.repo
[elasticsearch-7.x]
name=Elasticsearch repository for 7.x packages
baseurl=https://artifacts.elastic.co/packages/7.x/yum
gpgcheck=1
gpgkey=https://artifacts.elastic.co/GPG-KEY-elasticsearch
enabled=1
autorefresh=1
type=rpm-md
EOF

yum clean all
yum makecache

yum install -y elasticsearch logstash kibana filebeat
安装的时候最好设一下翻墙,否则下这几个包非常慢!!!
然后一个一个来设置
1、设置elasticsearch
vi /etc/elasticsearch/jvm.options
-Xms4g
-Xmx4g
vi /etc/elasticsearch/elasticsearch.yml
indices.query.bool.max_clause_count: 8192
search.max_buckets: 250000

systemctl enable --now elasticsearch

2、设置logstash
将附件中logstash目录下的synlite_suricata/目录完整挪到/etc/logstash下
/etc/logstash/synlite_suricata/

将附件中logstash目录下的pipelines.yml拷贝到/etc/logstash下
/etc/logstash/pipelines.yml

将附件中logstash目录下的logstash.service拷贝覆盖掉/etc/systemd/system/logstast.service
/etc/systemd/system/logstash.service

vi /etc/logstash/jvm.options
-Xms4g
-Xmx4g

systemctl daemon-reload
systemctl enable --now logstash

3、设置filebeat
vi /etc/filebeat/filebeat.yml
filebeat.inputs:
- type: log
  enabled: true
  paths:
    - /var/log/suricata/eve.json
  fields:
    event.type: suricata

output.logstash:
  hosts: ["127.0.0.1:5044"]
  #ssl.certificate_authorities: ["/etc/pki/root/ca.pem"]
  #ssl.certificate: "/etc/pki/client/cert.pem"
  #ssl.key: "/etc/pki/client/cert.key"

systemctl enable --now logstash

4、设置kibana
vi /etc/kibana/kibana.yml
server.host: "172.18.31.31"

systemctl enable --new kibana
跑起来以后打开 http://172.18.31.31:5601 就可以看到了
如果不出意外,应该有数据了。需要建立一个suricata*的索引。
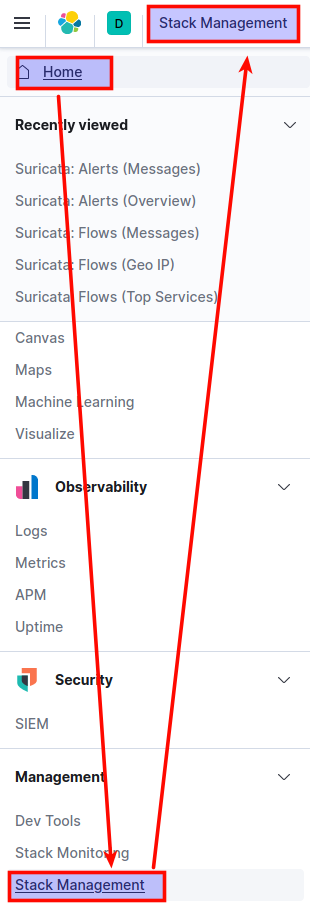
去kibana的home –> Stack Management
导入的synlite_suricata.kibana.7.1.x.json

然后在dashboard里就可以看到了
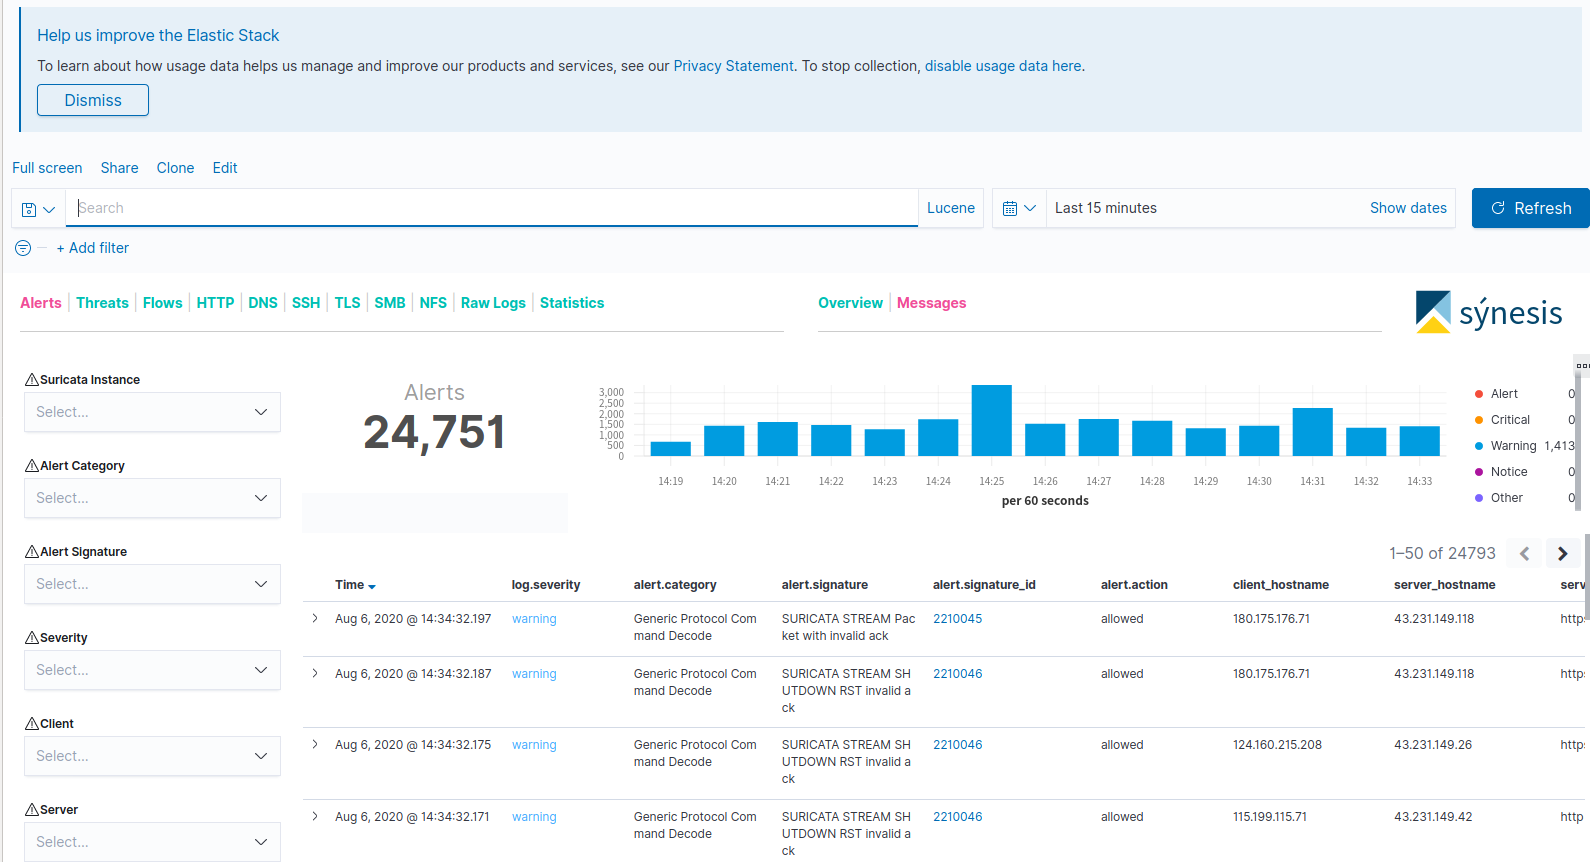
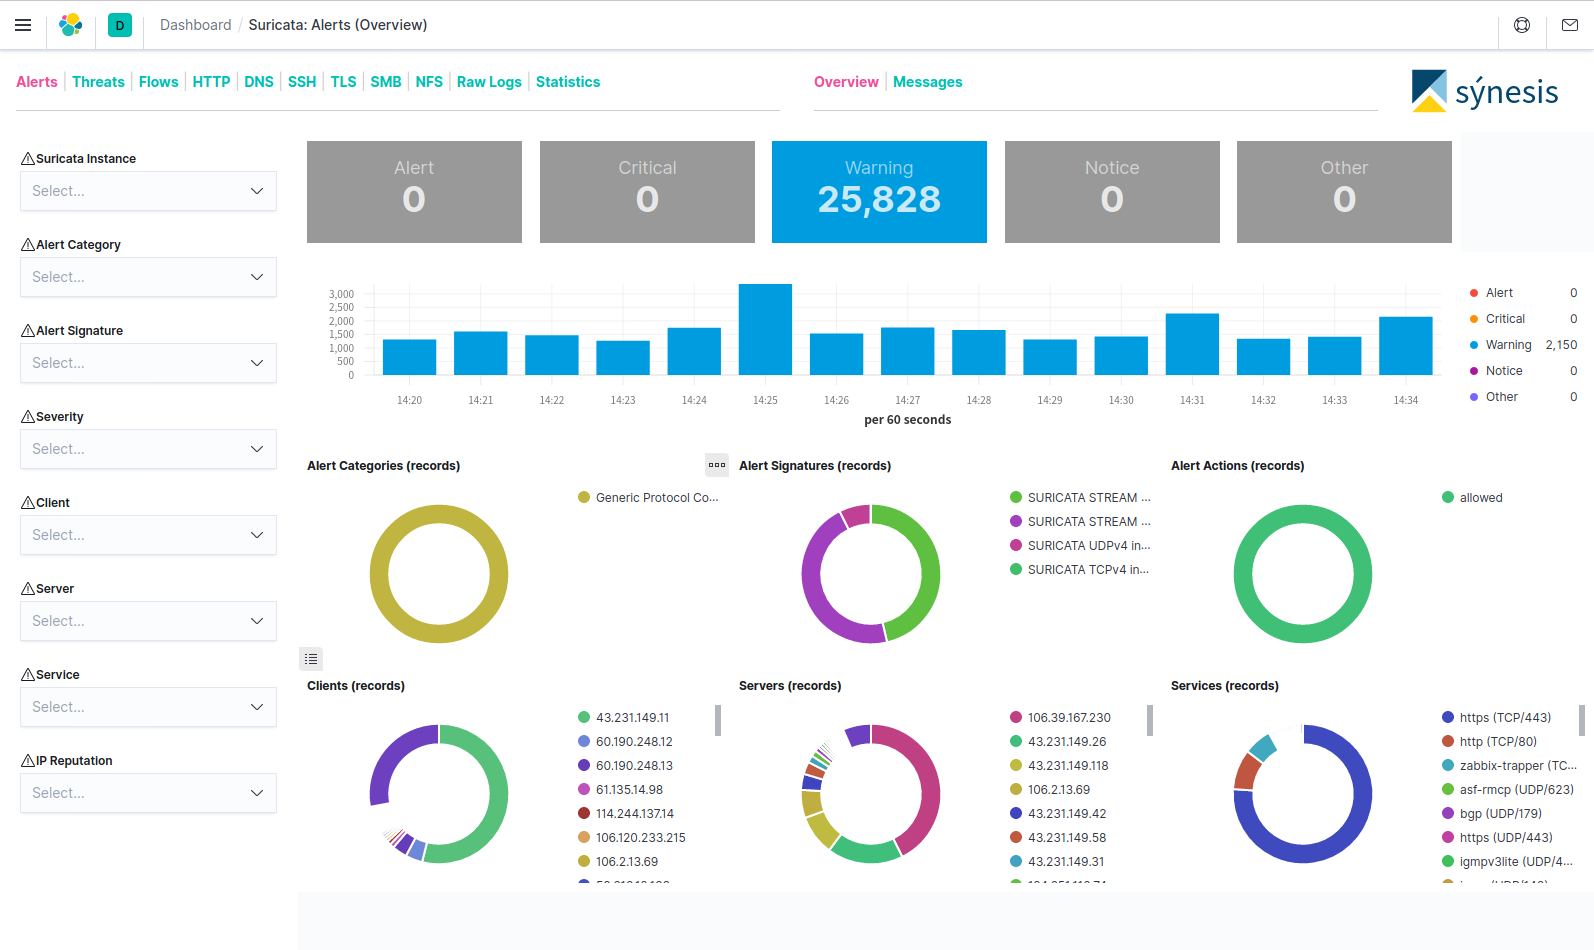
可以清楚的看到各种ipflow,流量分布。
Recommend
About Joyk
Aggregate valuable and interesting links.
Joyk means Joy of geeK