
1

echart折线图异常多出一条连接线 - YJUI
source link: https://www.cnblogs.com/liuyjui/p/17159906.html
Go to the source link to view the article. You can view the picture content, updated content and better typesetting reading experience. If the link is broken, please click the button below to view the snapshot at that time.

echart折线图异常多出一条连接线 - YJUI - 博客园
开发背景:vue3父传子,父中调子组件echarts图表
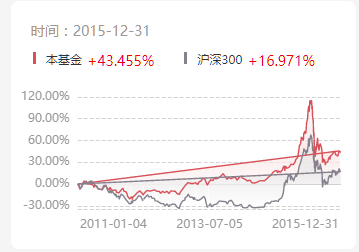
问题:第一次进入数据图表正常,再次进入不更新图表数据的情况下,图表异常多出来一条开始到结尾的连接线
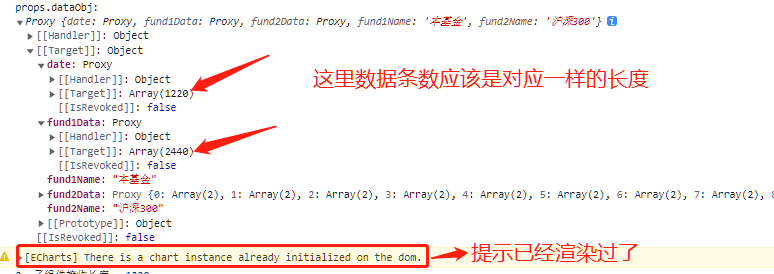
原因:上次数据没清空
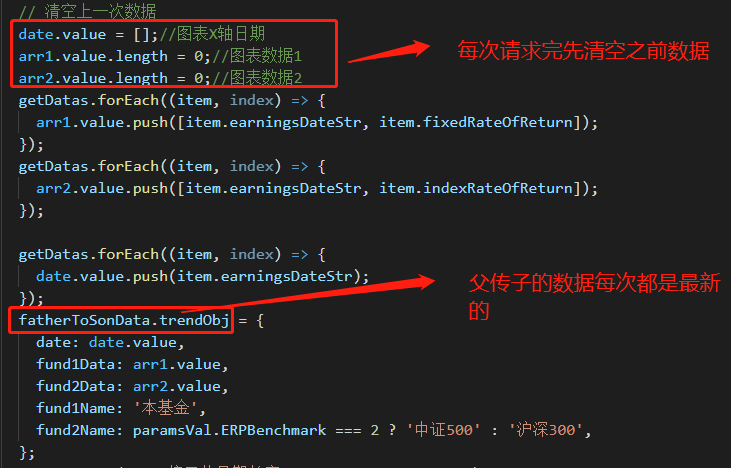
解决:请求完接口后先清空数据,在往父传子push图表值
date.value = [];//图表X轴日期arr1.value.length = 0;//图表数据1arr2.value.length = 0;//图表数据2 |
<!-- 父组件传给子传值 -->
<fundEcharts v-if="$utils.getVarType.isObjEmpty(fatherToSonData.trendObj)" :dataObj="fatherToSonData.trendObj" id="trendEcharts"></fundEcharts>子
子组件接收
const props = defineProps({
  dataObj: { type: Object},
  id: { type: String},
});
watch(
  props.dataObj,(n, o) => {
    //重新绘制echarts
    charts.value.clear();
    console.log('props.dataObj:', props.dataObj);
    nextTick(() => {
      showChart(true);
    });
  },
  { deep: true },
);
把watch接收到的数据打出来看看,发现数据叠加了,
所以得到结论,主要这句话:
date.value = [];//图表X轴日期
arr1.value.length = 0;//图表数据1
arr2.value.length = 0;//图表数据2
Recommend
About Joyk
Aggregate valuable and interesting links.
Joyk means Joy of geeK