

Mastering Dart & Flutter DevTools — Part 1: Introduction & Installation
source link: https://medium.com/@fluttergems/mastering-dart-flutter-devtools-series-introduction-installation-part-1-of-8-4f703a8cfcc8
Go to the source link to view the article. You can view the picture content, updated content and better typesetting reading experience. If the link is broken, please click the button below to view the snapshot at that time.

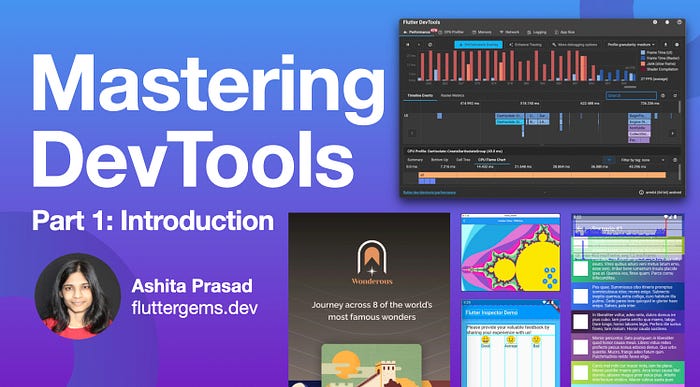
Mastering Dart & Flutter DevTools — Part 1: Introduction & Installation
by Ashita Prasad (LinkedIn, Twitter), fluttergems.dev
After building a full-fledged feature rich Flutter app, you might experience an urge to build a release bundle, upload it on the app store or play store and share it with the world.
But, hold on my friend! You forgot a critical step.
Did you ensure that your app:
- Provides a great user experience?
- Works seamlessly regardless of the device?
- Will not slow down or crash?
- Is high performance — optimized for speed, uses minimum resources, low network data usage, etc.?
You can get an answer to all these questions by analysing various app performance metrics that have a direct impact on the app’s user experience.
Looks like a lot of additional work, right?
Nope, it isn’t!
Dart & Flutter ship with a range of performance and debugging tools, that are collectively known as DevTools. These tools can help you collect, monitor and analyze various metrics that can help you build a high performance app.
This is the first part of the series of in-depth articles, which will help you master each and every tool in the DevTools suite using real world apps as case studies. The objective of this article is to introduce DevTools and help you activate and launch it. In case you have already setup DevTools, and you wish to directly learn a particular tool, just click on the corresponding link below:
So, let us get started by learning more about DevTools and try to understand how it can help you build high-performance apps.
What is DevTools and why do we need it?
DevTools is a suite of pre-packaged Application Performance Monitoring (APM) and Debugging tools that is available in Dart & Flutter. These tools can either be accessed using a browser or can be viewed directly in the IDE.
Nowadays, as people are increasingly relying on apps to fulfil their daily needs, success of a business has become directly proportional to its app’s performance. If an app has a slow response time, crashes or isn’t optimized for hands-on interaction, it leads to a poor user experience that can result in user frustration, negative reviews, app abandonment and loss of revenue, besides the damage caused to the brand.
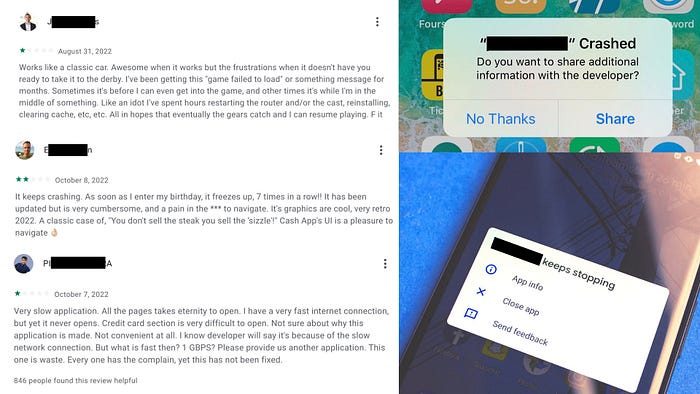
Poor UX leads to Negative Consumer Reviews
Thus, it is critical to identify and pinpoint application performance issues during the release cycle before any real user is impacted. This helps in ensuring the delivery of a superb user experience and can be accomplished via DevTools that provide tools to:
- Monitor technical performance metrics like memory usage, CPU usage, FPS, network usage, etc., and
- Monitor User Experience through perceived performance metrics like janking, page load speed or response times that directly impact an app user.
- Manage and Troubleshoot any aspect of the app that has a critical impact on the above mentioned metrics.
Let us go through the individual tools available in DevTools that can help you monitor and analyze some of the above mentioned metrics:
- Flutter Inspector — It is a visual tool useful for inspecting UI layout, tweaking UI elements, diagnosing layout issues and exploring the widget tree of a Flutter app. You can take a deep dive into Flutter Inspector tool in our article — here.
- App Size Tool — This tool can be used to visualize and inspect the total size of the app via hierarchical chart display. It can also be used to analyze and visualize any difference in the total size of two apps (old vs updated version). You can read more about App Size tool in our detailed article — here.
- Network View — Any HTTP, HTTPS or web socket traffic from your application like REST API calls, network image downloads, json responses, etc. can be monitored using the Network View tool. You can learn more about Network View tool in our detailed article — here.
- Logging View — This tool is useful for monitoring diagnostics information and logs generated by the framework and by the user while running an app. It is a good practice to use Logging View instead of browsing the standard output as the logs are labeled, much better organised and are not truncated allowing granular inspection. You can read more about Logging View tool in our detailed article — here.
- CPU Profiler View — This tool enables us to monitor the CPU usage of a Flutter app and investigate any performance issue that might exist due to higher execution time of any piece of code. To learn more about CPU Profiler View tool, check out our detailed article — here.
- Memory View — This tool helps in visualizing the memory usage of a Dart or Flutter app and is useful for inspecting objects and detecting any memory leaks that lead to an app crash. You can learn more about Memory View tool in our detailed article — here.
- Performance View — This tool is useful for capturing and visualizing timing and performance metrics like rendering frame per second (FPS) that can help us detect any UI jank (Slow Frame Rate) in a Flutter app. To learn more about Performance View tool, check out our detailed article — here.
- Debugger — A source level debugger is also provided in DevTools that can be used to step through the code using breakpoints and we can inspect the value of variables. As VS Code has a built-in debugger, this tool is only visible if the app is run via Android Studio or via command line.
Availability of DevTools Based on the Type of App
The availability of individual tools may vary based on the type of application we are building. Check out the table below:

Availability of Tools based on the Type of App
As seen in the table, Flutter Inspector is available only for Flutter mobile, desktop and web apps, whereas Flutter Web apps don’t have access to Performance View, CPU Profiler, Memory View, Network View and App Size Tool via Dart DevTools.
The above table only states the availability of these tools in Dart DevTools and does not imply that you cannot optimize and analyze your Flutter Web Apps. Browser tools such as the Chrome DevTools can be used for that purpose that is currently not in scope of this article.
How to run DevTools?
After gaining a basic understanding of DevTools, let us now proceed with activating and running DevTools in our favourite IDE:
- Android Studio (Installer for Windows, Mac & Linux available here)
- VS Code (Installer for Windows, Mac & Linux available here)
1. Activating and Running DevTools in Android Studio
Although Android Studio (based on IntelliJ IDEA) is the official Integrated Development Environment (IDE) for Android app development, it can be also used for Flutter App Development with access to entire suite of features and tools like DevTools.
Let us take a look on how you can install and run DevTools in Android Studio (version: Dolphin | 2021.3.1):
Step 1
Install Flutter (Instructions).
Step 2
Install the Flutter Plugin from marketplace.

Step 2
Step 3
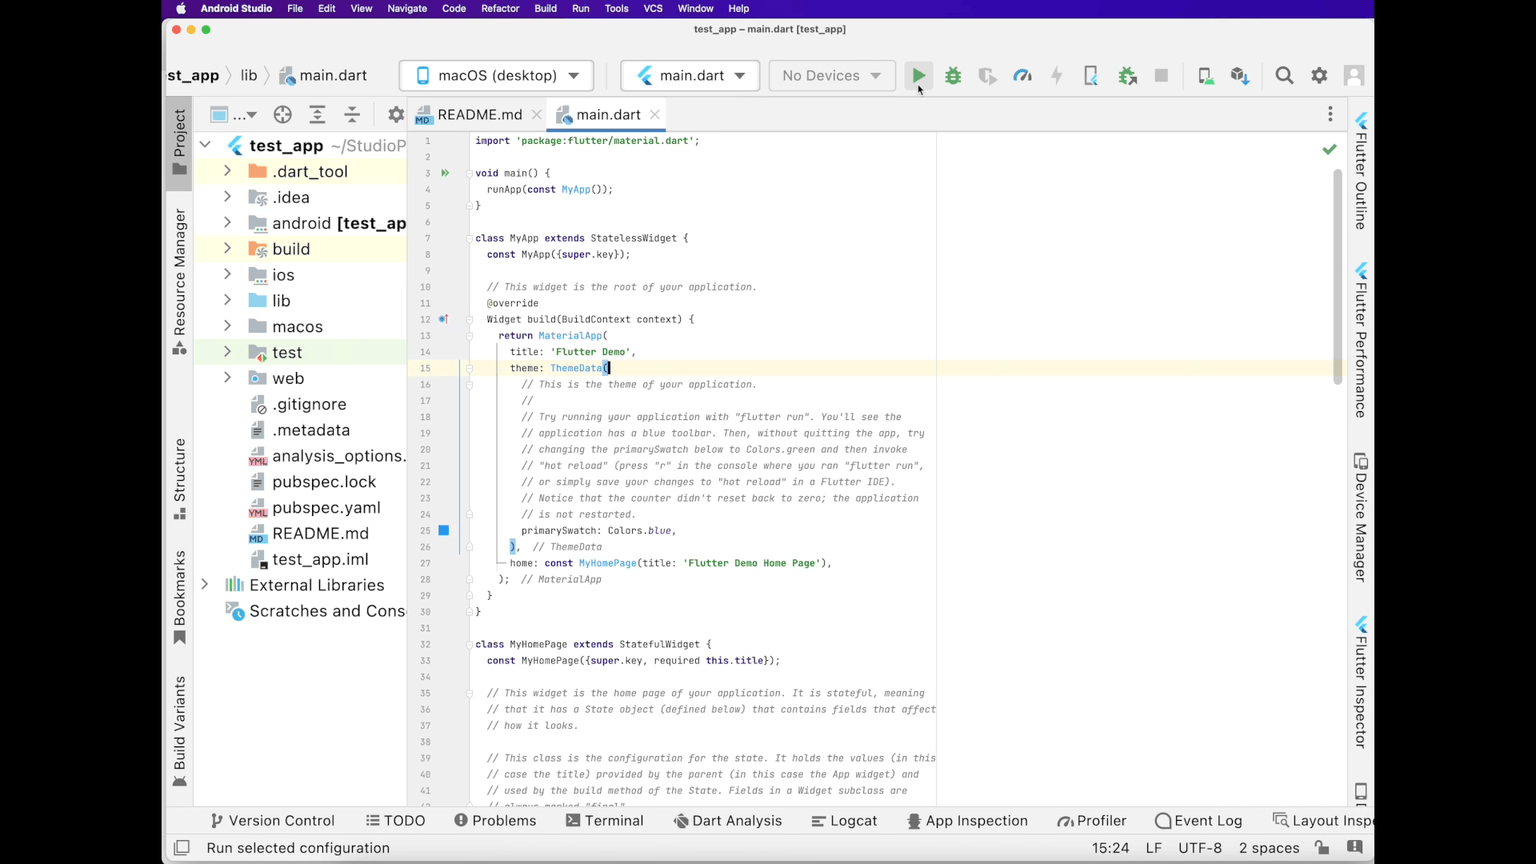
We can create a new Flutter app or open an existing Flutter app in Android Studio. Let us go ahead and create a new Flutter app as demonstrated below:

Step 3
Step 4
The next step is to run the application.
The Android Studio toolbar lets you carry out a wide range of actions, like selecting target device/emulator, running your app in different modes (Run, Debug, Profile) and other tools in context to Flutter App Development.

Android Studio Toolbar
Let us select the target device or emulator. In this case we will select “macOS (desktop)” as we want to build a Flutter Desktop app for MacOS.

Select Target Device
Now we can compile the code and run it using either — Run, Debug or Profile buttons. (You can click and read mode about these modes)

Run, Debug & Profile mode buttons
Click “Run” to build and run the app.

Click “Run”
Step 5
The next step is to launch DevTools.
The tool window bar (shown below) runs around the outside of the Android Studio IDE window and contains buttons that allow you to expand or collapse individual tool windows. By default, the most commonly used tool windows are pinned to the tool window bar at the edges of the application window. In the screenshot below you can check out some of the most commonly used tools like Flutter Performance and Flutter Inspector are pinned to the right.

Tool Window Bar (highlighted in red)
After running the app as shown in Step 4, let us click on the “Flutter Performance” tool as shown below in the tool window.

Click “Flutter Performance” Tool Window Tab
You can see that the Performance View has been integrated in the IDE, so that you can directly investigate the app’s performance.
In case you want to launch DevTools in a stand-alone browser, just click the “Open DevTools..” at the bottom of the tool window as shown below.
Open DevTools.. in the Browser
You can also open DevTools in the browser via Menu bar.
Tools > Flutter > Open Flutter DevTools

Open Flutter DevTools using Menu Bar
Congratulations for successfully running DevTools on Android Studio. But, there is one little caveat that we need to look into. You might receive an error message on the top of the tabs that capture the app’s performance as shown below:

Error Message
The error was caused due to building and running the app in “debug” mode that is generally not a good indicator of the final behaviour of release mode builds. Debug mode enables expensive checks that don’t run in profile or release builds and debug mode also executes code in JIT mode as compared to AOT mode in profile and release builds.
Thus, it is recommended that all performance tools (Performance, CPU Profiler, Memory) must be used with Flutter applications running on a physical Android or iOS or Desktop device in “profile” mode. In this mode, the application compiled and launched is almost identical to the release build with just additional functionality to allow debugging performance problems.
Since we are using a macOS desktop (physical device) for development, we can go ahead and launch this desktop application in “profile” mode and open DevTools. The error message is no longer shown.

Launch in Profile mode
2. Activating and Running DevTools in VS Code (Visual Studio Code)
Flutter developers who prefer VS Code over Android Studio can go through the following process to install and run DevTools in VS Code (Version: 1.71.2):
Step 1
Install Flutter (Instructions).
Step 2
Install the Flutter Extension from VS Code Extensions Marketplace.

Step 2: VS Code Extensions Marketplace
Step 3
We can create a new Flutter app or open an existing Flutter app in VS Code. Let us go ahead and create a new Flutter app as demonstrated below:
View > Command Palette… > Search “flutter” > Flutter: New Project > Application > Choose Directory > Enter Project Name

Step 3
Step 4
The next step is to run the application.
Let us select the target device or emulator by clicking on the option in the status bar. In this case we are building a Flutter Desktop app for MacOS.

Select Target Device/Emulator
Now we can compile the code and run it by clicking Run, Debug or Profile options above the main() function:

Run, Debug & Profile Hint Buttons
Click “Run” to build and run the app or start the build process by clicking Start Debugging in the Runmenu.
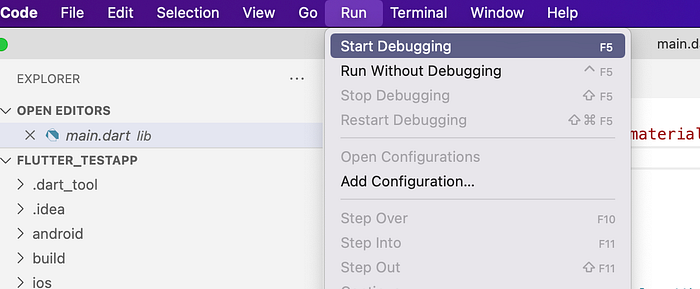
Run > Start Debugging
Step 5
The next step is to launch DevTools.
Once you Run the app, an popup dialog (as shown below) will suggest you to try out Dart DevTools. Just click on the Open button.

Dart DevTools Popup
In case this dialog is not available, you can click on Dart DevTools in the VS Code status bar.
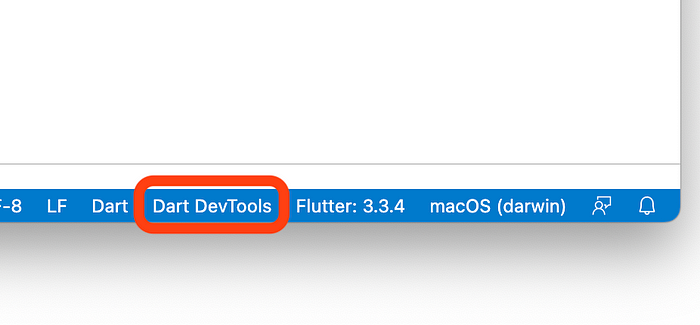
“Dart DevTools” in VS Code Status Bar
The command palette opens up. Select the page (tool) you want to open.

Dart DevTools Command Palette
Let us select the Open Widget Inspector Page. It opens up the Widget Inspector tool integrated inside the VS Code IDE. Now we can inspect the widget tree in VS Code.

Widget Inspector Tool integrated in VS Code
To launch DevTools in a standalone browser, click on the “Open DevTools in Web Browser” command.

Open DevTools in Web Browser (DevTools Command Palette)

DevTools opens up in the Web Browser
We have successfully run DevTools on VS Code.
Recommend
-
19
许多语言学家认为,一个人说的自然语言会影响他们的思维方式。这个理论适用于计算机语...
-
40
What Is Flutter? Flutter is an open-source UI framework for creating high-level native interfaces on Android and iOS. The initial release of Flutt...
-
50
奇技指南 本文是Flutter系列第四篇文章,阅读本文 你将得到什么: 1、dart:io 是什么? 2、dart:io 使用 3、dart:io 组成部分 4、dart:io 总结 本文...
-
23
近日,谷歌发布了全新版本的 Dart DevTools,这是我们用于 Dart 和 Flutter 代码的调试 / 性能分析工具套件。新版 DevTools 是在 Flutter 中从头重建的。这个版本的改进包括性能增强、Memory 页面更新以及全新的 Network 页面等。
-
6
Creating in-memory databases using SQLite in Dart and Flutter Thursday, October 29, 2020 I have been playing around with the Alpha version of Flutter Desktop lately, and needed to us...
-
6
Article Flutter Immutable collections and objects for Flutter and Dart Bevan Steele 22 Oct 2020 • 2 min read
-
3
Introduction to Dev Tools, v3 Note: If you're looking for Mastering Chrome Devtools, v2: A web app for teaching people about Chrome DevTools. This is the website and course materials for the
-
3
What’s new in Flutter 2.5Performance improvements, DevTools updates, new Material You support, a new app template, and more!Hello and welcome to Flutter 2.5! This is a big release, with the 2nd highest...
-
1
Hey folks 👋 I am Denyse, this series is first chapter I want to write about flutter in the future i'll write more and more cool things about Dart and Flutter we'll spend a little time to take a look into Dart programming languages. I wanted...
-
8
Dart DevTools: Analyzing application performance with the CPU ProfilerDart DevTools: Analyzing application performance with the CPU ProfilerPublished in
About Joyk
Aggregate valuable and interesting links.
Joyk means Joy of geeK