

Dart DevTools: Analyzing application performance with the CPU Profiler
source link: https://medium.com/dartlang/dart-devtools-analyzing-application-performance-with-the-cpu-profiler-3e94a0ec06ae
Go to the source link to view the article. You can view the picture content, updated content and better typesetting reading experience. If the link is broken, please click the button below to view the snapshot at that time.

Dart DevTools: Analyzing application performance with the CPU Profiler
Dart DevTools: Analyzing application performance with the CPU Profiler
Whether you’re a backend developer writing a command line tool using Dart, or a UX engineer building applications with Flutter, program performance is critical to the success of your project. Command line tools should minimize latency and apps should be responsive and snappy with no dropped frames. As developers, we try our best to write performant code but sometimes it’s not clear why our code isn’t performing as well as we would expect.
Tracking down performance issues in a code base can be a daunting task. There are multiple ways to write Flutter code such that it runs slower than it should. Some are glaringly obvious and others nefariously subtle. For example, perhaps you used the wrong API or data structure for a particular situation.
This article works through a simple case study examining the performance of a slow Dart command-line interface (CLI) application. You’ll learn about:
- General CPU profilers and their importance.
- The sampling CPU profiler that ships with Dart and Flutter.
With this new understanding of CPU profiling, we’ll debug the performance of our program. We’ll do so using the Dart DevTools CPU Profiler and dart:developer’s UserTag functionality to pinpoint the inefficient code. We’ve got lots to cover, so let’s get started!
Note: Dart DevTools is also referred to as Flutter DevTools, but shouldn’t be confused with Chrome DevTools.
Case Study: Implementing grep in Dart
Consider the following simple Dart CLI application:
// filename: grep.dart
import 'dart:io';

/// Finds and prints all instances of [pattern] in the [file].
void grep(File file, String pattern) {
  // Open the file and read its contents.
  final lines = file.readAsLinesSync();

String output = '';
  int lineNum = 1;
  // Check each line to see if it matches `pattern`.
  for (final line in lines) {
    final matcher = RegExp(pattern);
    if (matcher.hasMatch(line)) {
      final foundMessage = '$lineNum:$line';
      output += foundMessage;
    }
    lineNum++;
  }
  stdout.writeln(output);
}

void main(List<String> arguments) {
  if (arguments.length != 2) {
    print('Usage: dart grep.dart <path> <pattern>');
    exitCode = 64;
    return;
  }
  final path = arguments[0];
  final pattern = arguments[1];

final file = File(path);
  if (!file.existsSync()) {
    stderr.writeln("Error: unable to open file '$path'");
    exitCode = 64;
    return;
  }

grep(file, pattern);
}
The grep.dart program implements a version of the common Unix tool. It allows users to search files for the occurrence of a string of characters that matches a specified pattern. For example, given a file names.txt containing:
$ cat names.txt
Frank
Bob
Franny
June
Ben
Francis
Let’s find all lines containing the string 'Fran':
$ dart grep.dart names.txt 'Fran'
1:Frank
3:Franny
6:Francis
Excellent! We should expect this output from grep. That said, names.txt is a small file. Let’s try and find all the instances of 'Hummingbird' in a larger text document. What if we ran the same program on a 437,000 line, 147 MiB file about hummingbirds?
$ dart grep.dart hummingbird_encyclopedia.txt 'Hummingbird'
Huh… it doesn’t complete, even after two minutes. How does Unix grep perform?
$ grep -n 'Hummingbird' hummingbird_encyclopedia.txt
16:'''Hummingbirds''' are [[bird]]s native to the…
22:Hummingbirds have the highest…
24:Hummingbirds split from their [[Sister taxon|sister group]]…
// Output continues
Unix’s grep searched the entire file and returned all lines containing Hummingbird in about 45 seconds. Clearly there’s something strange in our code that we should investigate. But how can we identify the cause of our performance issues? The CPU Profiler shipped with Dart DevTools is a great place to start!
What is a CPU profiler?
CPU profiling tools track where a program spends its time when executing. To provide the most computationally efficient CPU profiling experience, the Dart virtual machine (VM), powering Dart CLI and Flutter applications, uses a sampling CPU profiler. When used with tools like Dart DevTools, you can identify performance bottlenecks in Dart programs.
A sampling CPU profiler takes a statistical approach to collecting application performance data. It collects samples by interrupting threads at regular intervals and taking a snapshot of the current call stack and other relevant execution state. These samples can be processed to gain insights into approximately how much time is spent executing specific functions, and how frequently functions appear on different call stacks.
The frequency that samples are collected is known as the sampling rate and is measured in samples per second (otherwise known as hertz or Hz). Most sampling profilers have sampling rates of 1000 Hz or higher. Higher sampling rates result in more detailed CPU profiles, at the expense of higher sampling overhead in the target process. At reasonable sampling rates, sampling CPU profilers are efficient and have little to no impact on the performance characteristics of the profiled application. As an added bonus, the collected data is typically less computationally expensive to process for analysis when compared to tracing profilers.
Deep Dive: How does a sampling profiler work?
This section goes into detail about how the Dart VM’s sampling CPU profiler works. You don’t need to know these details when analyzing CPU profiles. If you don’t care about the nitty gritty details of sampling CPU profilers, skip this section.
The Dart VM’s sampling CPU profiler has three important components: the thread interrupter, the sample collector, and the sample processor.
Thread Interrupter
The thread interrupter runs on a dedicated thread and triggers the CPU sample collection on each thread that the VM manages. The thread interrupter is typically inactive, only waking up once per sampling interval. After each sampling interval, the interrupter iterates over the list of threads, informing each thread that it should pause and collect a sample. The thread interrupter has slightly different behavior on different platforms due to operating system specific details.
On most platforms which support signal-based control flow (Android and Linux), the SIGPROF signal is sent to each thread. This triggers an interrupt that invokes a signal handler registered by the CPU profiler on the target thread that then collects the CPU sample before resuming its work.
On other platforms which don’t support signals (Windows and Fuchsia) or have poor performance in some situations when using SIGPROF (MacOS and iOS), the thread interrupter uses system calls to explicitly pause and resume each thread after collecting the CPU sample. In this case, sample collection is done on the thread interrupter thread rather than on the thread being sampled.
Sample collection
Once a thread has been interrupted, the CPU profiler collects a sample of the thread’s current execution state. Each sample includes metadata such as:
- thread and isolate identifiers
- active user tag for the thread
- collection timestamps
- current stack trace of the sampled thread
The collected stack trace consists of a list of program counters (PCs), which correspond to the return addresses of each Dart and native function found on the stack. These PCs are collected through a process known as “walking the stack”. While performing a stack walk, the stack walker uses the top frame’s frame pointer (FP) and the known layout of each stack frame to find and record the PC associated with the function as well as the FP of the previous stack frame. The stack walker repeats this process, using the previous frame’s FP as a starting point, until it reaches the end of the stack as shown in Figure 1.
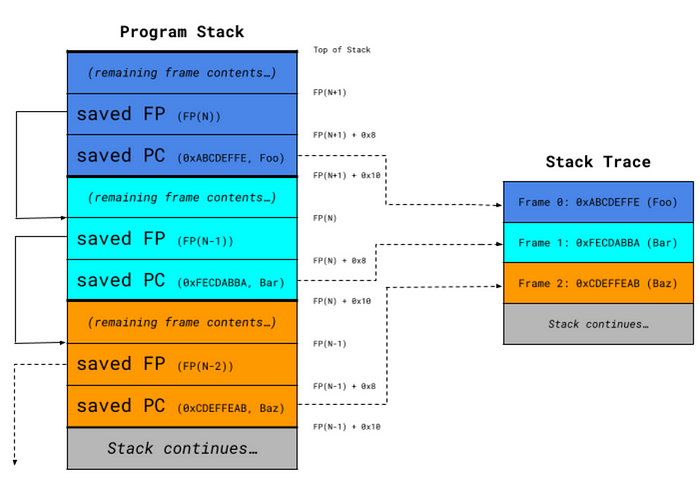
Figure 1: An example of stack trace collection on an ARM64 system. The stack walker starts at FP(N+1), retrieves the program counter (PC) from address FP(N+1) + 0x10, and adds it to the stack trace as Frame 0. The stack walker then looks up FP(N) from address FP(N+1) + 0x8, repeating the same procedure using FP(N) to look up details for Frame 1.
Each collected sample is stored in the VM’s sample buffer, a circular buffer that can store a limited number of CPU samples. This allows for the VM to avoid the need for additional allocations at runtime, which can negatively impact performance or cause bad things to happen if done in the signal handler.
The size of the sample buffer is fixed at runtime and, once full, old samples will be overwritten with new samples by the profiler. The rate at which the sample buffer fills up depends on the sampling rate and average stack depth of each sample. For example, higher sampling rates and deeper stacks cause the buffer to wrap around more quickly. In DevTools, developers can control how quickly the sample buffer wraps around by choosing between low (1000 Hz), medium (4000 Hz), and high (20,000 Hz) sampling rates.
Sample processing
When a client sends a request for a CPU sample profile via the VM service protocol, the CPU profiler needs to process the collected samples before sending them to the client. The profiler:
- Iterates over the sample buffer, using filters to only retrieve samples for the isolate and time period specified by the client.
- Symbolizes, or maps PCs to function names, each stack frame in the set of samples.
- Serializes the entire processed sample buffer to JSON.
- Sends the JSON back to the client.
Even after processing done by the profiler, the CPU samples response is low-level and requires additional processing by developer tooling to be useful. For example, Dart DevTools can convert the list of CPU samples into various structural representations that allow for identifying expensive functions (Bottom Up) and costly call paths (Call Tree and CPU Flame Chart), and inspecting caller and callee statistics (Method Table) for individual methods.
Using Dart DevTools to Profile Dart and Flutter Applications
Now that you’re familiar with what sampling CPU profilers are and how they work, let’s debug the performance of our grep implementation. Let’s run the code again with --observe and open up the Dart DevTools CPU Profiler tab:
Note: You don’t need to use the --observe flag when testing a Flutter app in DevTools.
$ dart — observe grep.dart hummingbird_encyclopedia.txt 'Hummingbird'
The Dart VM service is listening on http://127.0.0.1:8181/omxEtsCtW9k=/
The Dart DevTools debugger and profiler is available at: http://127.0.0.1:8181/omxEtsCtW9k=/devtools?uri=ws://127.0.0.1:8181/omxEtsCtW9k=/ws
// At this point, the terminal hangs with no output.
Recommend
About Joyk
Aggregate valuable and interesting links.
Joyk means Joy of geeK