

Part 2 - How to Hive on GCP using Google DataProc and Cloud Storage
source link: https://dzone.com/articles/part-2-how-to-hive-on-gcp-using-google-dataproc-an
Go to the source link to view the article. You can view the picture content, updated content and better typesetting reading experience. If the link is broken, please click the button below to view the snapshot at that time.

Part 2 - How to Hive on GCP using Google DataProc and Cloud Storage
In this part, we'll cover the remaining steps of creating main tables with valid records for detailed deep drive analysis using Google DataProc and Apache Hive.
Join the DZone community and get the full member experience.
Join For FreeIn part 1 of this series, we have seen how to create a Google Dataproc cluster, create external tables in HIVE, point to the data stored on cloud storage, and perform exploratory data analysis in a staging environment. As part of this analysis, we found out that our sample datasets had around:
- ~ 11% of non-confirming records for Green Taxi Y2019 dataset
- ~ 33% of non-confirming records for Yellow Taxi Y2019 dataset
Identifying non-confirming records is one of the important steps of exploratory data analysis as they can lead to wrong or faulty interpretation of results. So, as part of the next step, we will create a new environment i.e. new external tables in HIVE with only valid data required for deep-dive analysis and eliminate the non-confirming records.
Step5: Create New HIVE External Tables (Main) and Upload Filtered Data for Detailed Analysis
Partitioning in Hive means dividing the table into some parts based on the values of a particular column like date, course, city, or country. The advantage of partitioning is that since the data is stored in slices, the query response time becomes faster. In this exercise, we will create new HIVE external tables partitioned by month. One can also partition by day, week, year, etc.
Create Green Taxi (ny_green_taxi) external table and upload valid data from stg_ny_green_taxi to this table for detailed analysis. Table is partitioned by month and pointed to new location “gs://2019ah04024/tlc_parted/data/GreenTaxi”
/*Green Taxi*/
CREATE EXTERNAL TABLE IF NOT EXISTS ny_green_taxi (
              vendor_id int, lpep_pickup_datetime string, lpep_dropoff_datetime string,
              store_and_fwd_flag string, rate_code_id smallint, pu_location_id int,
              do_location_id int, passenger_count int, trip_distance double,
              fare_amount double, extra_charge double, mta_tax double,
              tip_amount double, tolls_amount double, ehail_fee double,
              improvement_surcharge double, total_amount double,
              payment_type smallint,trip_type smallint, congestion_surcharge double
       )
PARTITIONED BY (mnth int)
STORED AS ORC
LOCATION 'gs://2019ah04024/tlc_parted/data/GreenTaxi/'
TBLPROPERTIES ("orc.compress" = "SNAPPY");

/* Insert valid & confirming records from staging to main*/
INSERT INTO TABLE ny_green_taxi PARTITION(mnth)
SELECT vendor_id, lpep_pickup_datetime, lpep_dropoff_datetime, store_and_fwd_flag,
       rate_code_id, pu_location_id, do_location_id, passenger_count, trip_distance,
       fare_amount, extra_charge, mta_tax, tip_amount, tolls_amount, ehail_fee,
       improvement_surcharge, total_amount, payment_type, trip_type, congestion_surcharge,
       month(lpep_pickup_datetime) as mnth
from stg_ny_green_taxi
where year(lpep_pickup_datetime) =2019 and year(lpep_dropoff_datetime) =2019 and
       unix_timestamp(lpep_pickup_datetime) < unix_timestamp(lpep_dropoff_datetime) and
       passenger_count in (1,2,3,4,5,6,7,8,9) and trip_distance > 0.0 and
       rate_code_id in (1,2,3,4,5,6) andpayment_type in (1,2,3,4,5,6) and
       fare_amount > 0 and extra_charge in (0,0.5,1) and mta_tax in (0,0.5) and
       tip_amount > 0.0 and tolls_amount >= 0.0 and improvement_surcharge in (0,0.3) and
       total_amount > 0 and vendor_id is not null
In a similar way, we will create Yellow Taxi (ny_yellow_taxi) External table and upload valid data from stg_ny_yellow_taxi to this table for detailed analysis. The table is partitioned by month and pointed to the new location “gs://2019ah04024/tlc_parted/data/YellowTaxi”
/* Yellow Tax */
CREATE EXTERNAL TABLE IF NOT EXISTS ny_yellow_taxi (
              vendor_id int, tpep_pickup_datetime string, tpep_dropoff_datetime string,
              passenger_count int, trip_distance double, rate_code_id smallint,
              store_and_fwd_flag string, pu_location_id int,  do_location_id int,
              payment_type smallint, fare_amount double, extra_charge double,
              mta_tax double, tip_amount double, tolls_amount double,
              improvement_surcharge double, total_amount double,
              congestion_surcharge double)
PARTITIONED BY (mnth int)
STORED AS ORC
LOCATION 'gs://2019ah04024/tlc_parted/data/YellowTaxi/'
TBLPROPERTIES ("orc.compress" = "SNAPPY");

/* insert valid & confirming records from staging to main */
INSERT INTO TABLE ny_yellow_taxi PARTITION(mnth)
SELECT vendor_id, tpep_pickup_datetime, tpep_dropoff_datetime, passenger_count,
       trip_distance, rate_code_id, store_and_fwd_flag, pu_location_id,
       do_location_id, payment_type, fare_amount, extra_charge, mta_tax,
       tip_amount, tolls_amount, improvement_surcharge, total_amount,
       congestion_surcharge, month(tpep_pickup_datetime) as mnth
from stg_ny_yellow_taxi
where year(tpep_pickup_datetime)=2019 and year(tpep_dropoff_datetime)=2019 and
      unix_timestamp(tpep_pickup_datetime) < unix_timestamp(tpep_dropoff_datetime) and
      passenger_count in (1,2,3,4,5,6,7,8,9) and trip_distance > 0.0 and
      rate_code_id in (1,2,3,4,5,6) and payment_type in (1,2,3,4,5,6) and
      fare_amount > 0 and extra_charge in (0,0.5,1) and mta_tax in(0,0.5) and
      tip_amount>=0.0 and tolls_amount >= 0.0 and improvement_surcharge in (0,0.3) and
      total_amount > 0 and vendor_id is not null;
One thing to notice is that by doing partitioning, inside the new google cloud storage location "tlc_parted/data/YellowTaxi or /GreenTaxi", the data files will now be mapped & grouped under child folders month-wise.
There is also a lookup dataset provided by the New York Taxi company that contains common details that can be used by all vendors like location, borough, service zone, etc. We will also use this file in doing our deep-drive analysis. As stated in steps 1 & 2, we will upload this file in cloud storage, create one more external table for location – “lk_location” and point to this location.
CREATE EXTERNAL TABLE lk_location (
              location_id int, borough string,
              tlc_zone string, service_zone string)
ROW FORMAT DELIMITED
FIELDS TERMINATED BY ','
LINES TERMINATED BY '\n'
STORED AS TEXTFILE
LOCATION 'gs://2019ah04024/tlc/data/LookUp/'
tblproperties ("skip.header.line.count"="1");
Step6: Perform Actual Deep Dive Analysis
Now the external tables – “ny_green_taxi” and “ny_yellow_taxi” are the tables holding filtered and confirming records. Any organization like UBER or OLA which is dealing with Taxi's would like to analyze the information like
- Top busiest routes served
- Busiest hours of the day for the Taxis
- Most preferred way of payment used by the passengers
- The weekly trend observed for the methods of payments
- Month wise trip count, average distance, and average passenger count from the trips completed
- Which Vendor provides the most useful data
Note: For all the above queries, I had exported the output of HIVE results and created visualizations/ graphs in excel.
Analysis 1: Which vendor provides the most useful data?
Let’s check which vendor provided the most confirming records:
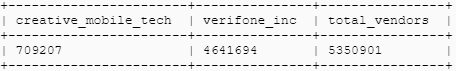
/*Green Taxi*/
SELECT sum(CASE when vendor_id = 1 THEN 1 ELSE 0 END)as Creative_Mobile_Tech,
       sum(CASE when vendor_id = 2 THEN 1 ELSE 0 END)as Verifone_Inc,
count(*)as Total_Vendors from ny_green_taxi;
Output is as follows:
/* Yellow Taxi */
SELECT sum(CASE when vendor_id = 1 THEN 1 ELSE 0 END)as Creative_Mobile_Tech,
       sum(CASE when vendor_id = 2 THEN 1 ELSE 0 END)as Verifone_Inc,
count(*)as Total_Vendors from ny_yellow_taxi;
Output is as follows:
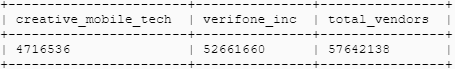
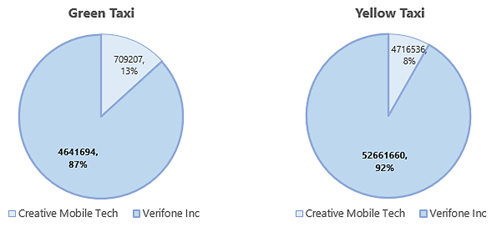
For both Green and Yellow Taxi, vendor Verifone Inc provided the most useful data with confirming records of 4641694 (87% of total) for green taxi and 52661660 (92% of total) for a yellow taxi.
Analysis 2: Finding the month-wise trip count, average distance, and average passenger count from the trips completed by yellow and green taxis in 2019.
/*Green Taxi*/
select mnth_activity.mnth as month, sum(mnth_activity.trips) as trips_count,
       round(avg(mnth_activity.trip_dist),2) as Avg_trip_Dist,
       round(avg(mnth_activity.psngr_cnt),1) as passenger_count
from (select month(lpep_pickup_datetime) as mnth,
       pu_location_id, do_location_id,
       count(*) as trips,
       avg(trip_distance) as trip_dist,
       avg(passenger_count) as psngr_cnt
from ny_green_taxi
group by month(lpep_pickup_datetime), pu_location_id, do_location_id) as mnth_activity
group by mnth_activity.mnth
order by mnth_activity.mnth;

hive -e 'select month(lpep_pickup_datetime) as mnth, pu_location_id, do_location_id, count(*) as trips, avg(trip_distance) as trip_dist, avg(passenger_count) as psngr_cnt from ny_green_taxi group by month(lpep_pickup_datetime), pu_location_id, do_location_id' | sed 's/[[:space:]]\+/,/g' > gt_monthly_trend.csv;
gsutil mv gt_monthly_trend.csv gs://2019ah04024/csv/data/GreenTaxi/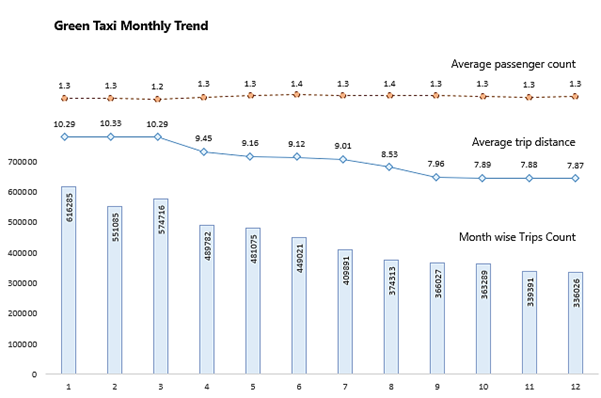
/* Yellow Taxi */
select mnth_activity.mnth as month, sum(mnth_activity.trips) as trips_count,
       round(avg(mnth_activity.trip_dist),2) as Avg_trip_Dist,
       round(avg(mnth_activity.psngr_cnt),1) as passenger_count
from (select month(tpep_pickup_datetime) as mnth,
       pu_location_id, do_location_id,
       count(*) as trips,
       avg(trip_distance) as trip_dist,
       avg(passenger_count) as psngr_cnt
from ny_yellow_taxi
group by month(tpep_pickup_datetime), pu_location_id, do_location_id) as mnth_activity
group by mnth_activity.mnth
order by mnth_activity.mnth;

hive -e 'select month(tpep_pickup_datetime) as mnth, pu_location_id, do_location_id, count(*) as trips, avg(trip_distance) as trip_dist, avg(passenger_count) as psngr_cnt from ny_yellow_taxi group by month(tpep_pickup_datetime), pu_location_id, do_location_id' | sed 's/[[:space:]]\+/,/g' > yt_monthly_trend.csv;
gsutil mv yt_monthly_trend.csv gs://2019ah04024/csv/data/YellowTaxi/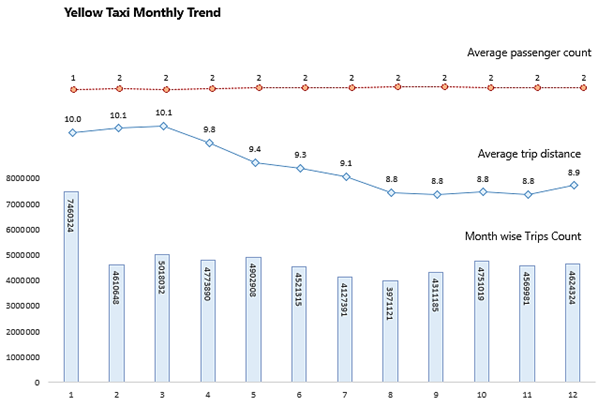
- The average trip distance for Green taxi ranges between 7.87 to 10.29 whereas for Yellow ranges between 8.9 to 10.1
- The monthly trip count is maximum for January, February, and March for green taxis. For the yellow taxi, it is in January.
- The average passenger count for the green taxi is 1 and the yellow taxi is 2
Analysis 3: Finding out the five busiest routes served by the yellow and green taxis during 2019 with the name of start and drop points to be provided.
/* Green Taxi */
select loc1.borough as Pickup_Borough, loc1.tlc_zone as Pickup_Zone,
       loc2.borough as Dropof_Borough, loc2.tlc_zone as Dropof_Zone, count(*) as trip_count
from ny_green_taxi gt
join lk_location loc1
     on (gt.pu_location_id = loc1.location_id)
join lk_location loc2
     on (gt.do_location_id = loc2.location_id)
group by loc1.borough, loc1.tlc_zone,loc2.borough, loc2.tlc_zone
order by trip_count desc limit 5;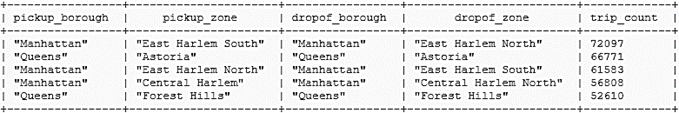
/* Yellow Taxi */
select loc1.borough as Pickup_Borough, loc1.tlc_zone as Pickup_Zone,
       loc2.borough as Dropof_Borough, loc2.tlc_zone as Dropof_Zone, count(*) as trip_count
from ny_yellow_taxi yt
join lk_location loc1
     on (yt.pu_location_id = loc1.location_id)
join lk_location loc2
     on (yt.do_location_id = loc2.location_id)
group by loc1.borough, loc1.tlc_zone,loc2.borough, loc2.tlc_zone
order by trip_count desc limit 5;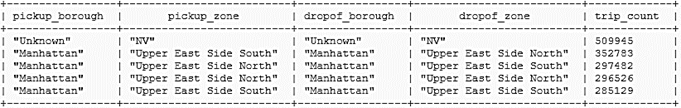
Analysis 4: What are the top 3 busiest hours of the day for the taxis?
/* Green Taxi */
select mnth_activity.hrs as hourofDay,
       round(avg(mnth_activity.count)) as avg_trips_count
from (SELECT month(lpep_pickup_datetime) as mnth,
             day(lpep_pickup_datetime) as dt,
             hour(lpep_pickup_datetime) as hrs,
             count(*) as count
             FROM ny_green_taxi
             GROUP BY month(lpep_pickup_datetime), day(lpep_pickup_datetime),
             hour(lpep_pickup_datetime)) as mnth_activity
group by mnth_activity.hrs
order by avg_trips_count desc;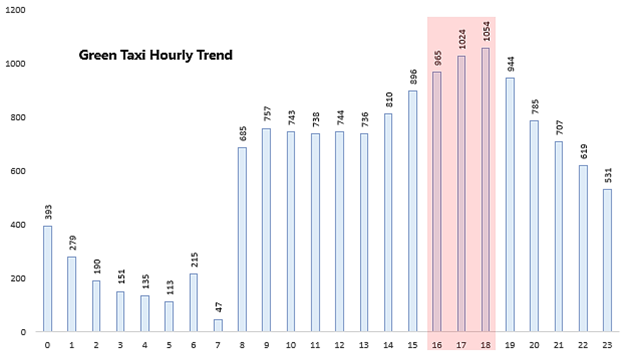
/* Yellow Taxi */
select mnth_activity.hrs as hourofDay,
       round(avg(mnth_activity.count)) as avg_trips_count
from (SELECT month(tpep_pickup_datetime) as mnth,
       day(tpep_pickup_datetime) as dt,
       hour(tpep_pickup_datetime) as hrs,
       count(*) as count
       FROM ny_yellow_taxi
       GROUP BY month(tpep_pickup_datetime), day(tpep_pickup_datetime),
       hour(tpep_pickup_datetime)) as mnth_activity
group by mnth_activity.hrs
order by avg_trips_count desc;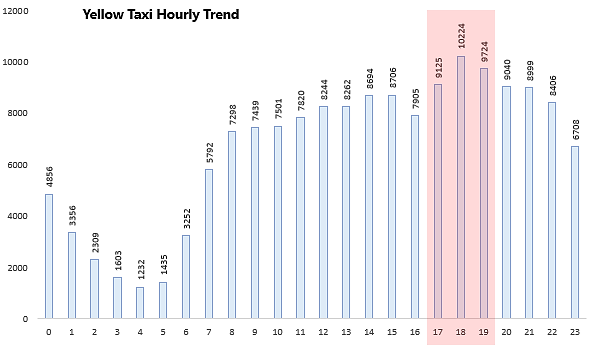
The top 3 Busiest hours for green taxi are 18th, 17th, and 16th hours of the day while the top 3 busiest hours for yellow taxi are 18th, 19th, and 17th hours of the day.
Analysis 5: What is the most preferred way of payment used by the passengers?
/* Green Taxi */
SELECT sum(CASE when payment_type = 1 THEN 1 ELSE 0 END)as Credit_Card_Trips,
       sum(CASE when payment_type = 2 THEN 1 ELSE 0 END)as Cash_Paid_Trips,
       sum(CASE when payment_type = 3 THEN 1 ELSE 0 END)as No_Charge_Trips,
       sum(CASE when payment_type = 4 THEN 1 ELSE 0 END)as Dispute_Trips,
       sum(CASE when payment_type = 5 THEN 1 ELSE 0 END)as Unknown_Trips,
       sum(CASE when payment_type = 6 THEN 1 ELSE 0 END)as Voided_Trips,
count(*)as Total_Number_Trips
from ny_green_taxi;
/* Yellow Taxi */
SELECT sum(CASE when payment_type = 1 THEN 1 ELSE 0 END)as Credit_Card_Trips,
       sum(CASE when payment_type = 2 THEN 1 ELSE 0 END)as Cash_Paid_Trips,
       sum(CASE when payment_type = 3 THEN 1 ELSE 0 END)as No_Charge_Trips,
       sum(CASE when payment_type = 4 THEN 1 ELSE 0 END)as Dispute_Trips,
       sum(CASE when payment_type = 5 THEN 1 ELSE 0 END)as Unknown_Trips,
       sum(CASE when payment_type = 6 THEN 1 ELSE 0 END)as Voided_Trips,
count(*)as Total_Number_Trips
from ny_yellow_taxi;
The preferred way of payment used for both green and yellow taxis are Credit Card & Cash Paid trips.
Analysis 6: What are the weekly trends observed for the methods of payments?
/* Green Taxi */
SELECT dayofweek(lpep_pickup_datetime) as dayofWeek,
       sum(CASE when payment_type = 1 THEN 1 ELSE 0 END)as Credit_Card_Trips,
       sum(CASE when payment_type = 2 THEN 1 ELSE 0 END)as Cash_Paid_Trips,
       sum(CASE when payment_type = 3 THEN 1 ELSE 0 END)as No_Charge_Trips,
       sum(CASE when payment_type = 4 THEN 1 ELSE 0 END)as Dispute_Trips,
       sum(CASE when payment_type = 5 THEN 1 ELSE 0 END)as Unknown_Trips,
       sum(CASE when payment_type = 6 THEN 1 ELSE 0 END)as Voided_Trips,
count(*)as Total_Number_Trips
from ny_green_taxi
group by dayofweek(lpep_pickup_datetime)
order by dayofWeek;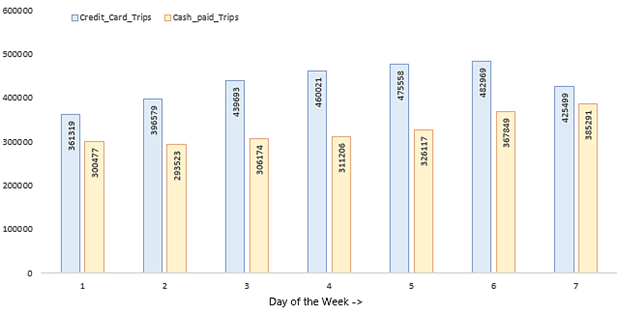
/* Yellow Taxi */
SELECT dayofweek(tpep_pickup_datetime) as dayofWeek,
       sum(CASE when payment_type = 1 THEN 1 ELSE 0 END)as Credit_Card_Trips,
       sum(CASE when payment_type = 2 THEN 1 ELSE 0 END)as Cash_Paid_Trips,
       sum(CASE when payment_type = 3 THEN 1 ELSE 0 END)as No_Charge_Trips,
       sum(CASE when payment_type = 4 THEN 1 ELSE 0 END)as Dispute_Trips,
       sum(CASE when payment_type = 5 THEN 1 ELSE 0 END)as Unknown_Trips,
       sum(CASE when payment_type = 6 THEN 1 ELSE 0 END)as Voided_Trips,
count(*)as Total_Number_Trips
from ny_yellow_taxi
group by dayofweek(tpep_pickup_datetime)
order by dayofWeek;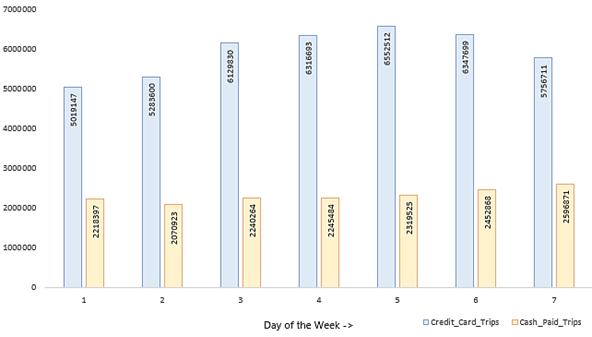
Below are the queries for the green taxi as well as the yellow taxis weekly payment trend for the year. We will export the result to a CSV file and prepare the weekly trend chart.
/* Green taxi */
insert overwrite  directory 'gs://2019ah04024/csv/data/GreenTaxi/gt_payment_trend/' row format delimited
fields terminated by ',' stored as textfile
SELECT WeekofYear(lpep_pickup_datetime) as WeekOfYear,
       sum(CASE when payment_type = 1 THEN 1 ELSE 0 END)as Credit_Card_Trips,
       sum(CASE when payment_type = 2 THEN 1 ELSE 0 END)as Cash_Paid_Trips,
       sum(CASE when payment_type = 3 THEN 1 ELSE 0 END)as No_Charge_Trips,
       sum(CASE when payment_type = 4 THEN 1 ELSE 0 END)as Dispute_Trips,
       sum(CASE when payment_type = 5 THEN 1 ELSE 0 END)as Unknown_Trips,
       sum(CASE when payment_type = 6 THEN 1 ELSE 0 END)as Voided_Trips,
count(*)as Total_Number_Trips
from ny_green_taxi
group by dayofweek(lpep_pickup_datetime)
order by WeekOfYear;

/* Yellow Taxi */
insert overwrite  directory 'gs://2019ah04024/csv/data/YellowTaxi/yt_payment_trend/' row format delimited
fields terminated by ',' stored as textfile
SELECT weekofyear(tpep_pickup_datetime) as WeekOfYear,
       sum(CASE when payment_type = 1 THEN 1 ELSE 0 END)as Credit_Card_Trips,
       sum(CASE when payment_type = 2 THEN 1 ELSE 0 END)as Cash_Paid_Trips,
       sum(CASE when payment_type = 3 THEN 1 ELSE 0 END)as No_Charge_Trips,
       sum(CASE when payment_type = 4 THEN 1 ELSE 0 END)as Dispute_Trips,
       sum(CASE when payment_type = 5 THEN 1 ELSE 0 END)as Unknown_Trips,
       sum(CASE when payment_type = 6 THEN 1 ELSE 0 END)as Voided_Trips,
count(*)as Total_Number_Trips
from ny_yellow_taxi
group by weekofyear(tpep_pickup_datetime)
order by WeekOfYear;
The weekly trend for Y2019 - for Credit card and Cash Paid trips for Green Taxi:
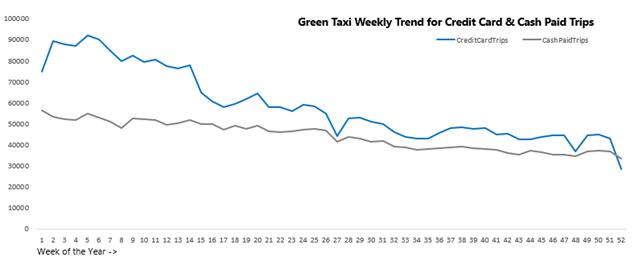
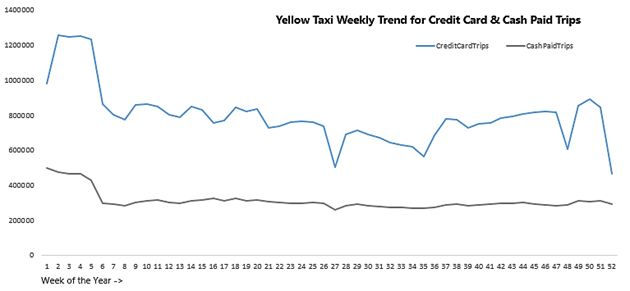
The weekly trend for Y2019 – for Credit card and Cash Paid trips for Yellow Taxi:
So, from this tutorial, you have understood how to HIVE using on GCP using Google DataProc, perform deep-drive analysis to extract meaningful insights that can be helpful to organizations by using a sample Taxi dataset.
Recommend
About Joyk
Aggregate valuable and interesting links.
Joyk means Joy of geeK