

The Wolf Pack Tactic for Monitoring Slow APIs
source link: https://blog.appsignal.com/2021/06/16/the-wolf-pack-tactic-for-monitoring-slow-apis.html
Go to the source link to view the article. You can view the picture content, updated content and better typesetting reading experience. If the link is broken, please click the button below to view the snapshot at that time.

Even if you write the fastest code in the world, you can still be slowed down by external factors. In this post, we will deal with performance monitoring external APIs and how you can prevent these slow APIs from slowing you down.
The Wolf Pack Tactic
Wolves travel in packs, and they wait for the slowest one so they stick together. For them, going faster means making the slowest one go faster. That’s what we will be doing today as well.
Your app is only as fast as the slowest thing on its path. This can be caused by factors which are outside of your control. A lot of apps are not just a set of services you build and control yourself. You will very often be using some external APIs, and the trick is to be able to spot them with your monitoring system.
The Campsite Rule Became a Magic Dashboard
A pattern that we like to use at AppSignal is to apply the campsite rule: leave things cleaner than we found them. When we run into an individual issue, we solve the overarching structural issue causing it. This mindset made us build AppSignal in the first place. When we solve a problem for ourselves, we also look at how we can solve it for our customers as well.
In some cases, we’ve had to look into what aspects of our architecture are causing a bottleneck. We’ve then made these views of the architecture into dashboards that are available for all our users. Recently, we’ve built a screen that enables you to monitor and visualize your slow API requests.
Who’s the Slowest Wolf?
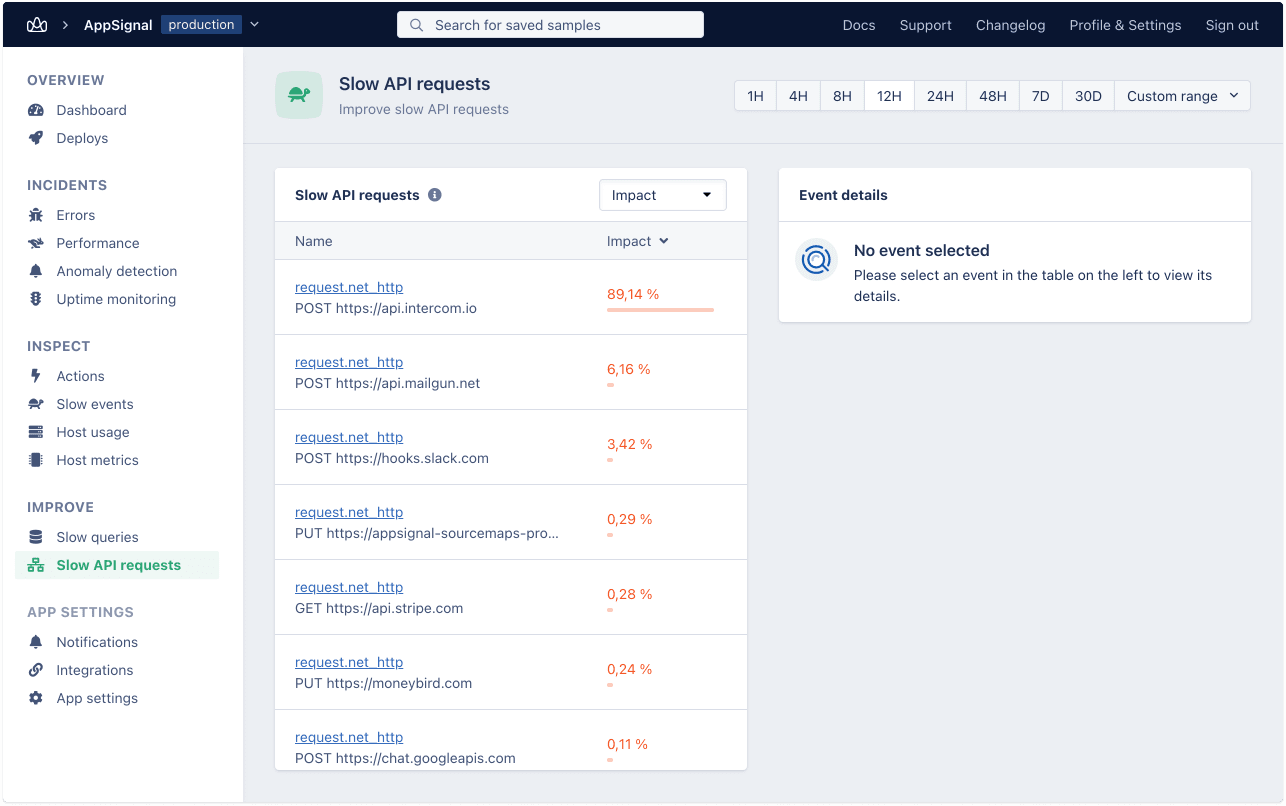
On this screen in AppSignal we can easily spot what event category is the slowest. The slowest event category may not actually be the one causing the problem, if it has low volume. It is often the high volume, relatively slow API requests that have the most impact. This is why, by default, the slow API monitoring screen sorts the event groups and endpoints by impact.
You can also sort by throughput and by mean response time. Sorting one at a time is a good way to get an overview of the different APIs you hit, and their size and speed. By now you should have spotted the slowest wolf in the pack.
What’s Wrong and What Happened Here?
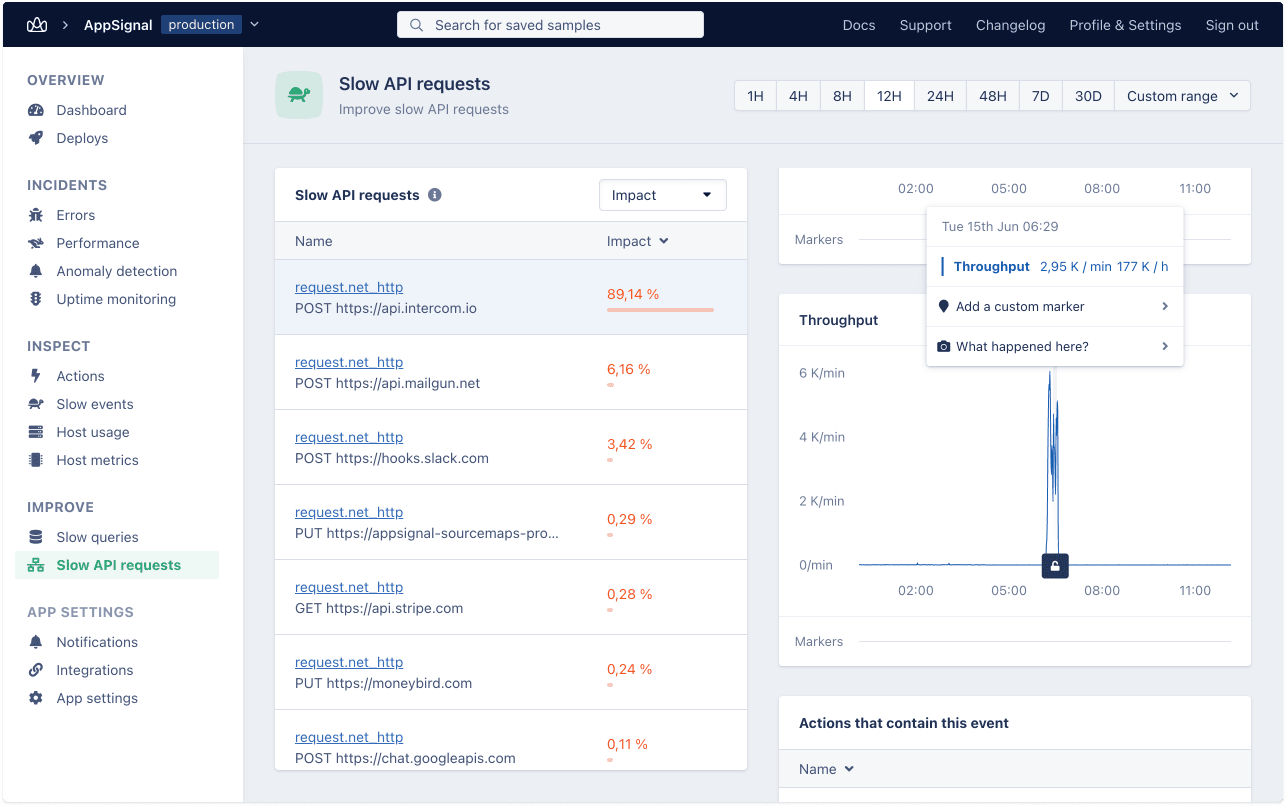
When you click on an individual event group, you’ll see graphs of the throughput and response times, so you can zoom in to when these are at their worst. At the bottom you will see the actions that contain this event.
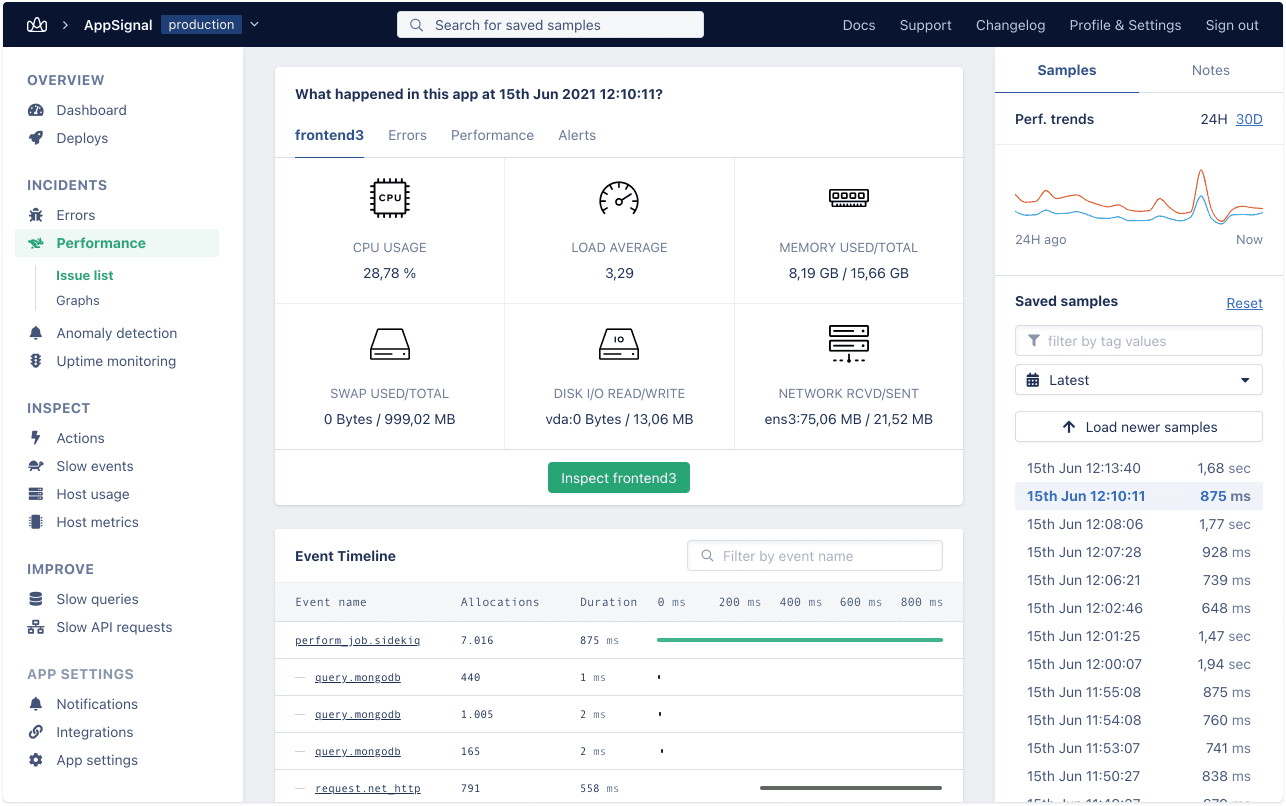
From here you can go to individual incidents (samples) of that action or route and see the details of what you posted to the API and the event timeline of the entire sample. This often gives you a good indication of what is wrong and where to solve it.
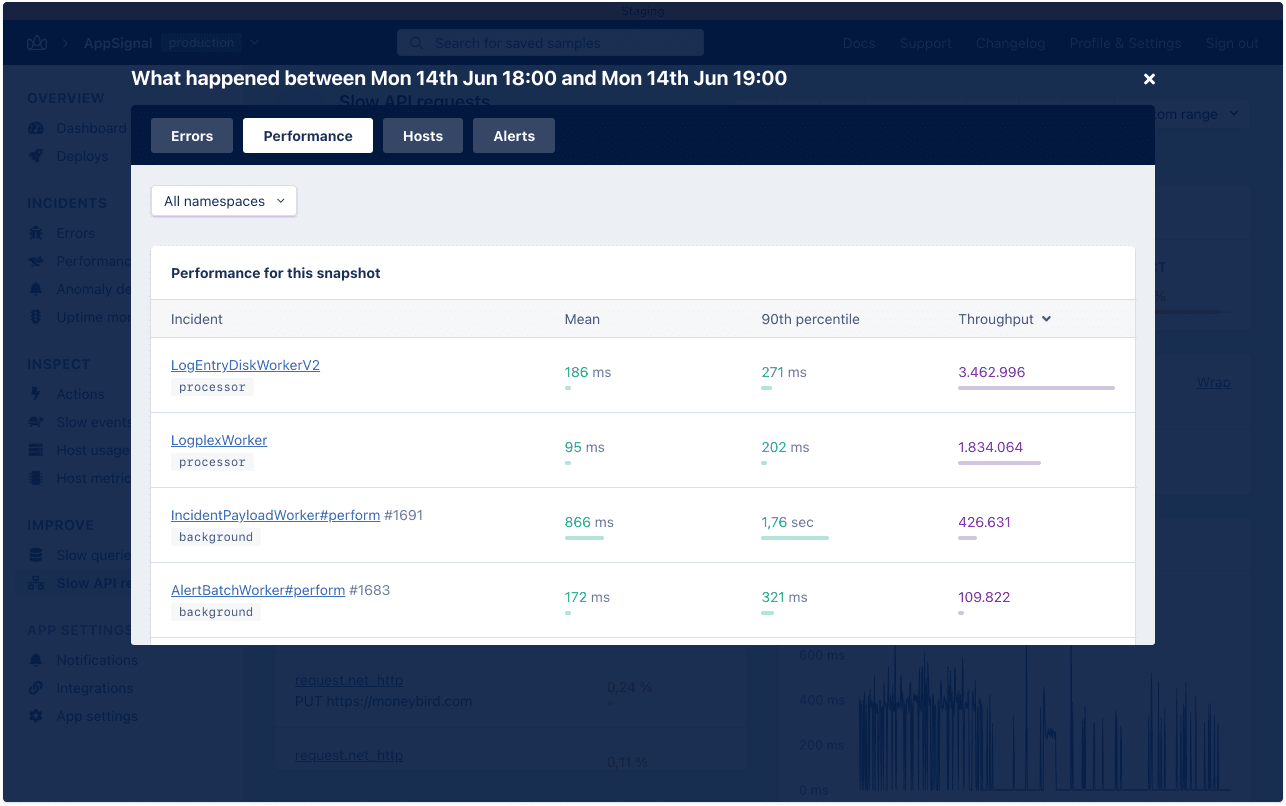
Note that in some cases, the issue may not even be caused by the API request itself. Instead, a host might have had resource issues at the time of a peak or a massive error might have happened elsewhere in the stack. To zoom out and diagnose the cause of the issue, click on ‘what happened here’ on any graph in AppSignal, and you’ll see an overlay with all those things brought together.
Treating APIs Like a Part of the Wolf Pack
Making sure the slowest in the pack gets faster - the wolf pack tactic - is especially worthwhile when you rely on external factors like APIs. As you can see, monitoring and visualizing these external services is a valuable and a relatively easy task.
If you’d like to monitor your APIs as shown, give AppSignal a try. If you get hungry (dare we say like a wolf) while trying AppSignal, holler, and we’ll ship you some stroopwafels.
Recommend
About Joyk
Aggregate valuable and interesting links.
Joyk means Joy of geeK