
1

开源!OpenHarmony手机CPU信息应用
source link: https://www.51cto.com/article/782824.html
Go to the source link to view the article. You can view the picture content, updated content and better typesetting reading experience. If the link is broken, please click the button below to view the snapshot at that time.
开源!OpenHarmony手机CPU信息应用
作者:离北况归 2024-03-04 14:59:51
笔者最近写了一个OpenHarmony开发者手机应用开获取手机的各种信息,通过Native C++ 开发方式读取开发板端文件获取手机各项信息。

笔者最近写了一个OpenHarmony开发者手机应用开获取手机的各种信息,源码开源如下:CPU_device_information
- API10
- 硬件:OpenHarmony开发者手机
- OpenHarmony 4.O.10.309
OpenHarmony 开发者手机购买链接:https://xslht.com/dp
1.应用安装步骤
2.实现功能
完成了开发者手机以下信息的获取。
- CPU核心数
- SOC型号
- GPU温度
- 主板温度
- 系统运行时间
- RAM总内存
- RAM可用内存
- RAM空闲内存
- 缓存使用内存
- Swaps交换分区
- 系统启动以来创建的进程数
- 上下文切换的总数
- SOC温度
- CPU利用率
- CPU大核7温度和利用率
- CPU中核6温度和利用率
- CPU中核5温度和利用率
- CPU中核4温度和利用率
- CPU小核3温度和利用率
- CPU小核2温度和利用率
- CPU小核1温度和利用率
- CPU小核0温度和利用率
- 设备电量
- 电池电压
- 电池型号
- 电池充电状态
- 系统版本
- RTC时间和日期
- 内核版本信息
- 电池信息
3.功能实现逻辑
(1)通过Native C++ 开发方式读取开发板端文件获取手机各项信息
# 获取SOC型号
proc/device-tree/cpuinfo_hardware

# 获取rtc时间
/sys/class/rtc/rtc0/time

# 获取内核信息
/proc/version

# 获取RTC系统日期
/sys/class/rtc/rtc0/date

# 交换分区大小
/proc/swaps

# 获取主板热区
/sys/class/thermal/thermal_zone27/temp

# 获取GPU热区
/sys/class/thermal/thermal_zone17/temp

# 获取lit0-thmzone 小核心 0 热区
/sys/class/thermal/thermal_zone13/temp

# 获取lit1-thmzone 小核心 1 热区
/sys/class/thermal/thermal_zone14/temp

# 获取lit2-thmzone 小核心 2 热区
/sys/class/thermal/thermal_zone15/temp

# 获取lit3-thmzone 小核心 3 热区
/sys/class/thermal/thermal_zone16/temp

# 获取mid4-thmzone 中核心 4 热区
/sys/class/thermal/thermal_zone9/temp

# 获取mid5-thmzone 中核心 5 热区
/sys/class/thermal/thermal_zone10/temp

# 获取mid6-thmzone 中核心 6 热区
/sys/class/thermal/thermal_zone11/temp

# 获取big7-thmzone 大核心 7 热区
/sys/class/thermal/thermal_zone7/temp

# 获取soc-thmzone系统芯片热区
/sys/class/thermal/thermal_zone5/temp

# /proc/uptime 是一个特殊的文件,它提供了当前系统的运行时间信息。文件中包含了两个数值,分别表示系统的总运行时间和空闲时间。
/proc/uptime

# 获取内存信息
/proc/meminfo

# 获取cpu info
/proc/cpuinfo

# 计算cpu利用率,进程计数器,正在运行的进程计数器,阻塞的进程计数器,系统发生的上下文切换次数
/proc/stat
(2)Native C++开发的api
export const getCpuCount: () => Number;                  //获取cpu核心数
export const getMemTotal: () => String;                  //获取RAM总内存大小
export const getFreeMem: () => String;                   //获取空闲内存大小
export const getCachedMem: () => String;                 //获取缓存使用内存大小
export const getAvailableMem: () => String;              //获取可用内存大小
export const getCpuInfo: () => any;                      //获取CPU信息
export const getMemoryInfo: () => any;                   //获取RAM信息
export const getUptime: () => String;                    //读取/proc/uptime,/proc/uptime 是一个特殊的文件,它提供了当前系统的运行时间信息。文件中包含了两个数值,分别表示系统的总运行时间和空闲时间。
export const getSOCtemp: () => String;                   //获取soc-thmzone系统芯片热区 /sys/class/thermal/thermal_zone5/temp
export const getCPU_CORE_big7_thmzonetemp: () => String; //获取big7-thmzone 大核心 7 热区
export const getCPU_CORE_mid6_thmzonetemp: () => String; //获取mid6-thmzone 中核心 6 热区
export const getCPU_CORE_mid5_thmzonetemp: () => String; //获取mid6-thmzone 中核心 5 热区
export const getCPU_CORE_mid4_thmzonetemp: () => String; //获取mid6-thmzone 中核心 4 热区
export const getCPU_CORE_lit3_thmzonetemp: () => String; //获取lit3-thmzone 小核心 3 热区
export const getCPU_CORE_lit2_thmzonetemp: () => String; //获取lit2-thmzone 小核心 2 热区
export const getCPU_CORE_lit1_thmzonetemp: () => String; //获取lit1-thmzone 小核心 1 热区
export const getCPU_CORE_lit0_thmzonetemp: () => String; //获取lit0-thmzone 小核心 0 热区
export const getGPU_temp: () => String;                  //获取GPU 热区
export const getBoard_temp: () => String;                //获取主板 热区
export const getSwaps: () => String;                     //获取交换分区大小
export const getRTC_Date_temp: () => String;             //获取rtc日期
export const getKernel_version: () => String;            //获取内核信息
export const getRTC_Time_temp: () => String;             //获取rtc时间
export const getCpu_stat_cpu: () => String;              //获取cpu以及各个核利用率
export const getprocesses: () => String;                 //获取正在运行的进程数
export const getctxt: () => String;                      //获取正在运行的进程数
export const getcpuinfo_hardware: () => String;          //获取SOC型号
4.功能实现逻辑剖析
(1)底部导航栏、顶部状态栏设置
参考:沉浸式界面开发
Index.ets

import window from '@ohos.window';
import common from '@ohos.app.ability.common';

  //沉浸式界面开发:https://gitee.com/openharmony/docs/blob/master/zh-cn/third-party-cases/immersion-mode.md#%E5%8F%82%E8%80%83
  context: common.UIAbilityContext = getContext(this) as common.UIAbilityContext
  async setSystemBar() {

    let windowClass = await window.getLastWindow(this.context)
    //设置导航栏,状态栏不可见
    /*
     * let names: Array<'status' | 'navigation'> = ['navigation'];//设置顶部状态栏不可见
     * let names: Array<'status' | 'navigation'> = ['status'];//设置底部导航栏不可见
     * let names: Array<'status' | 'navigation'> = [];//设置
    */
    let names: Array<'status' | 'navigation'> = ["navigation"];
    await windowClass.setWindowSystemBarEnable(names)
  }

aboutToAppear() {

this.setSystemBar()

}
(2)获取SOC型号
读取开发板proc/device-tree/cpuinfo_hardware文件获取SOC型号。

TestStatisticsInfo.cpp

// proc/device-tree/cpuinfo_hardware
// 查看SOC型号
napi_value TestStatisticsInfo::Getcpuinfo_hardware(napi_env env, napi_callback_info info) {
    if ((nullptr == env) || (nullptr == info)) {
        LOGE("TestStatisticsInfo::Getcpuinfo_hardware: env or info is null");
        return nullptr;
    }

    napi_value thisArg;
    if (napi_ok != napi_get_cb_info(env, info, nullptr, nullptr, &thisArg, nullptr)) {
        LOGE("TestStatisticsInfo::Getcpuinfo_hardware: napi_get_cb_info fail");
        return nullptr;
    }
    std::string time = getcpuinfo_hardware();
    LOGI("getcpuinfo_hardware success! %{public}s", time.c_str());
    napi_value res;
    napi_create_string_utf8(env, time.c_str(), strlen(time.c_str()), &res);
    return res;
}

std::string TestStatisticsInfo::getcpuinfo_hardware() {

    FILE *fp0 = fopen("proc/device-tree/cpuinfo_hardware", "r");
    if (NULL == fp0) {
        LOGE("TestStatisticsInfo:getcpuinfo_hardware failed to open cpuinfo =======");
        return 0;
    }
    std::string temp0 = "";
    char buffer0[1024]{};
    fgets(buffer0, sizeof(buffer0), fp0);
    temp0.assign(buffer0); // 将buffer转换为字符串类型并赋值给time。
    LOGE("TestStatisticsInfo::getcpuinfo_hardware %{public}d =======", buffer0);
    fclose(fp0);

    return temp0;
}
index.d.ts
export const getcpuinfo_hardware: () => String; //获取SOC型号@State cpuinfo_hardware: String = '';
//aboutToAppear函数在创建自定义组件的新实例后,在执行其build()函数之前执行。允许在aboutToAppear函数中改变状态变量,更改将在后续执行build()函数中生效。
aboutToAppear() {
//getcpuinfo_hardware
this.cpuinfo_hardware = testStatisticsApi.getcpuinfo_hardware();
console.log("========Cpu_stat_cpu is ",this.cpuinfo_hardware)
}(3)获取cpu以及各个核利用率、正在运行的进程数、上下文切换的总数
读取开发板proc/stat目录获取。
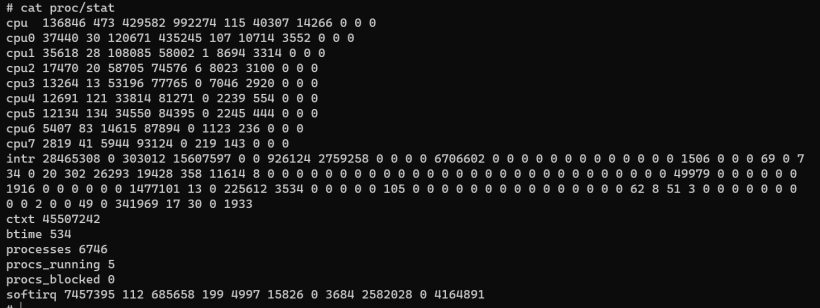
# cat proc/stat
cpu  136846 473 429582 992274 115 40307 14266 0 0 0
cpu0 37440 30 120671 435245 107 10714 3552 0 0 0
cpu1 35618 28 108085 58002 1 8694 3314 0 0 0
cpu2 17470 20 58705 74576 6 8023 3100 0 0 0
cpu3 13264 13 53196 77765 0 7046 2920 0 0 0
cpu4 12691 121 33814 81271 0 2239 554 0 0 0
cpu5 12134 134 34550 84395 0 2245 444 0 0 0
cpu6 5407 83 14615 87894 0 1123 236 0 0 0
cpu7 2819 41 5944 93124 0 219 143 0 0 0
intr 28465308 0 303012 15607597 0 0 926124 2759258 0 0 0 0 6706602 0 0 0 0 0 0 0 0 0 0 0 0 0 1506 0 0 0 69 0 734 0 20 302 26293 19428 358 11614 8 0 0 0 0 0 0 0 0 0 0 0 0 0 0 0 0 0 0 0 0 0 0 0 0 0 0 0 0 49979 0 0 0 0 0 0 1916 0 0 0 0 0 0 1477101 13 0 225612 3534 0 0 0 0 0 105 0 0 0 0 0 0 0 0 0 0 0 0 0 0 0 62 8 51 3 0 0 0 0 0 0 0 0 0 2 0 0 49 0 341969 17 30 0 1933
ctxt 45507242
btime 534
processes 6746
procs_running 5
procs_blocked 0
softirq 7457395 112 685658 199 4997 15826 0 3684 2582028 0 4164891
以上参数含义解释如下:
- cpu: 包含了 CPU 的使用情况统计信息,依次表示用户态时间、Nice 值为负的进程在用户态的CPU时间、系统态时间、空闲时间、等待IO的时间、硬中断时间、软中断时间和虚拟化的CPU操作时间。
- cpu0 - cpu7: 每个核心的 CPU 使用情况统计信息,格式与全局的 cpu 行相同。
- intr: 包含了中断请求的统计信息,依次表示总的中断数以及每种中断的具体计数。
- ctxt: 上下文切换的次数,包括进程切换和内核线程切换。
- btime: 系统启动时间
- processes: 启动以来创建的进程数。
- procs_running: 当前正在执行的进程数量。
- procs_blocked: 当前被阻塞的进程数量。
- softirq: 软中断的统计信息,依次表示软中断的次数和每种软中断的具体计数。
注意:需要修改开发板/vendor/etc/init.uis7885.cfg文件将proc/stat的权限改为777。
TestStatisticsInfo.cpp

std::string TestStatisticsInfo::getCpu_stat(std::string field) {

    std::ifstream meminfo("/proc/stat");
    std::string line;
    std::string cpu0Field = "cpu0";
    std::string cpu1Field = "cpu1";
    std::string cpu2Field = "cpu2";
    std::string cpu3Field = "cpu3";
    std::string cpu4Field = "cpu4";
    std::string cpu5Field = "cpu5";
    std::string cpu6Field = "cpu6";
    std::string cpu7Field = "cpu7";
    std::string cpuField = "cpu\u0020";
    std::string processesField = "processes"; // processes: 进程计数器统计。这个字段表示当前运行的进程数量。
    std::string procs_runningField = "procs_running"; //procs_running: 正在运行的进程计数器统计。这个字段表示当前正在运行的进程数量。
    std::string procs_blockedField = "procs_blocked";//procs_blocked: 阻塞的进程计数器统计。这个字段表示当前被阻塞的进程数量。
    std::string ctxtField = "ctxt";//上下文切换计数器统计。这个字段表示系统发生的上下文切换次数,可以用于评估系统的调度性能。
    while (getline(meminfo, line)) {
        if (line.find(processesField) != std::string::npos) {
            std::string res = line;
            _Cpu_stat[processesField] = res;
        }
        if (line.find(procs_runningField) != std::string::npos) {
            std::string res = line;
            _Cpu_stat[procs_runningField] = res;
        }
        if (line.find(procs_blockedField) != std::string::npos) {
            std::string res = line;
            _Cpu_stat[procs_blockedField] = res;
        }
        if (line.find(ctxtField) != std::string::npos) {
            std::string res = line;
            _Cpu_stat[ctxtField] = res;
        }
        if (line.find(cpu7Field) != std::string::npos) {
            std::string res = line;
            _Cpu_stat[cpu7Field] = res;
        }
        if (line.find(cpu6Field) != std::string::npos) {
            std::string res = line;
            _Cpu_stat[cpu6Field] = res;
        }
        if (line.find(cpu5Field) != std::string::npos) {
            std::string res = line;
            _Cpu_stat[cpu5Field] = res;
        }
        if (line.find(cpu4Field) != std::string::npos) {
            std::string res = line;
            _Cpu_stat[cpu4Field] = res;
        }
        if (line.find(cpu3Field) != std::string::npos) {
            std::string res = line;
            _Cpu_stat[cpu3Field] = res;
        }
        if (line.find(cpu2Field) != std::string::npos) {
            std::string res = line;
            _Cpu_stat[cpu2Field] = res;
        }
        if (line.find(cpu1Field) != std::string::npos) {
            std::string res = line;
            _Cpu_stat[cpu1Field] = res;
        }
        if (line.find(cpu0Field) != std::string::npos) {
            std::string res = line;
            _Cpu_stat[cpu0Field] = res;
        }
        if (line.find(cpuField) != std::string::npos) {
            std::string res = line;
            _Cpu_stat[cpuField] = res;
        }
    }
    return _Cpu_stat[field];
}
(4)获取cpu以及各个核利用率
根据/proc/stat 文件内容可以计算 Linux CPU 利用率。
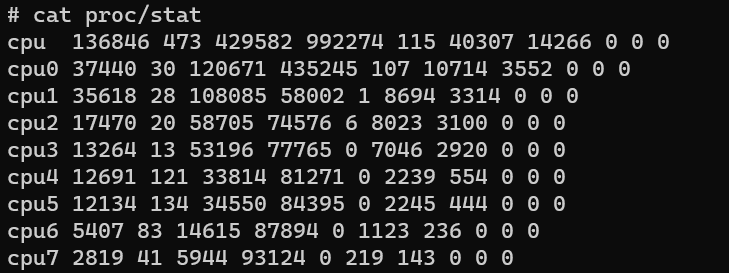
# cat proc/stat
cpu  136846 473 429582 992274 115 40307 14266 0 0 0
cpu0 37440 30 120671 435245 107 10714 3552 0 0 0
cpu1 35618 28 108085 58002 1 8694 3314 0 0 0
cpu2 17470 20 58705 74576 6 8023 3100 0 0 0
cpu3 13264 13 53196 77765 0 7046 2920 0 0 0
cpu4 12691 121 33814 81271 0 2239 554 0 0 0
cpu5 12134 134 34550 84395 0 2245 444 0 0 0
cpu6 5407 83 14615 87894 0 1123 236 0 0 0
cpu7 2819 41 5944 93124 0 219 143 0 0 0
这是一个 CPU(中央处理器)使用情况的统计信息。每一行都表示一个 CPU 核心的使用情况。
下面是对每一列的解释:
cpu: 总体统计信息
cpu0、cpu1、cpu2、等等:各个 CPU 核心的统计信息
user: 用户模式下运行时间
nice: 优先级较低的用户模式下运行时间
system: 内核模式下运行时间
idle: 空闲时间
iowait: 等待输入/输出完成的时间
irq: 处理硬件中断的时间
softirq: 处理软件中断的时间
steal: 被虚拟化主机偷取的时间
guest: 运行虚拟 CPU 的时间
guest_nice: 运行虚拟 CPU 且优先级较低的时间

在 /proc/stat 文件中,CPU 利用率的时间单位是“时钟滴答”(clock ticks)。每个 Linux 系统都有一个时钟线程(clock tick),它以固定的速率生成时钟滴答来驱动系统的计时器。时钟滴答的大小依赖于系统的硬件和配置。它通常以毫秒(ms)为单位,但也可能以微秒(μs)或纳秒(ns)为单位,具体取决于系统。要获取实际的时间单位,你可以查看 /proc/timer_list 或 /proc/timer_stats 文件中的信息。需要注意的是,这些时钟滴答并不是以独立的单位存在的,它们仅用于相对测量和计算 CPU 的利用率。因此,在分析 CPU 利用率时,我们通常关注的是两个时间点之间的差异,而不是实际的时钟滴答值本身。- 计算方式:
cpu总时间 = user + nice + system + idle + iowait + irq + softirq + stealstolen + guest + guest_nice
在一段时间内获取两次cpu时间分配信息。
两次的cpu总时间:total_2 - total_1
两次的cpu剩余时间:idle_2 - idle_1
两次的cpu使用时间:used = (total_2 - total_1) - (idle_2 - idle_1)
cpu使用率 = 使用时间 / 总时间 * 100% = used / total * 100%
TestStatisticsInfo.cpp

//计算cpu利用率
std::string TestStatisticsInfo::calculateCpuUtilization(std::string& a,std::string& a_second) {
    std::istringstream iss_a(a);
    std::istringstream iss_a_second(a_second);

    // 提取每个字段的值
    std::string cpu_name, cpu_name_second;
    int user, nice, system, idle, iowait, irq, softirq, steal, guest, guest_nice;
    int user_second, nice_second, system_second, idle_second, iowait_second, irq_second, softirq_second, steal_second,
        guest_second, guest_nice_second;

    iss_a >> cpu_name >> user >> nice >> system >> idle >> iowait >> irq >> softirq >> steal >> guest >> guest_nice;
    iss_a_second >> cpu_name_second >> user_second >> nice_second >> system_second >> idle_second >> iowait_second >>
        irq_second >> softirq_second >> steal_second >> guest_second >> guest_nice_second;

    // 计算总的 CPU 时间和空闲 CPU 时间
    int total_time = user + nice + system + idle + iowait + irq + softirq + steal;
    int total_time_second = user_second + nice_second + system_second + idle_second + iowait_second + irq_second +
                            softirq_second + steal_second;
    int idle_time = idle + iowait;
    int idle_time_second = idle_second + iowait_second;

    // 计算 CPU 利用率
    double cpu_utilization =
        100.0 * (1.0 - (idle_time_second - idle_time) / static_cast<double>(total_time_second - total_time));

    return std::to_string(cpu_utilization);
}

// 计算cpu利用率
napi_value TestStatisticsInfo::GetCpu_stat_cpu(napi_env env, napi_callback_info info) {
    if ((nullptr == env) || (nullptr == info)) {
        LOGE("TestStatisticsInfo::GetCachedMem: env or info is null");
        return nullptr;
    }

    napi_value thisArg;
    if (napi_ok != napi_get_cb_info(env, info, nullptr, nullptr, &thisArg, nullptr)) {
        LOGE("TestStatisticsInfo::GetCpu_stat_cpu: napi_get_cb_info fail");
        return nullptr;
    }
    std::string cpu_cached0 = getCpu_stat("cpu\u0020");
    std::string cpu0_cached0 = getCpu_stat("cpu0");
    std::string cpu1_cached0 = getCpu_stat("cpu1");
    std::string cpu2_cached0 = getCpu_stat("cpu2");
    std::string cpu3_cached0 = getCpu_stat("cpu3");
    std::string cpu4_cached0 = getCpu_stat("cpu4");
    std::string cpu5_cached0 = getCpu_stat("cpu5");
    std::string cpu6_cached0 = getCpu_stat("cpu6");
    std::string cpu7_cached0 = getCpu_stat("cpu7");

    std::this_thread::sleep_for(std::chrono::milliseconds(100)); // 延时 100 毫秒

    std::string cpu_cached1 = getCpu_stat("cpu\u0020");
    std::string cpu0_cached1 = getCpu_stat("cpu0");
    std::string cpu1_cached1 = getCpu_stat("cpu1");
    std::string cpu2_cached1 = getCpu_stat("cpu2");
    std::string cpu3_cached1 = getCpu_stat("cpu3");
    std::string cpu4_cached1 = getCpu_stat("cpu4");
    std::string cpu5_cached1 = getCpu_stat("cpu5");
    std::string cpu6_cached1 = getCpu_stat("cpu6");
    std::string cpu7_cached1 = getCpu_stat("cpu7");

    std::string cpu = calculateCpuUtilization(cpu_cached0, cpu_cached1);
    std::string cpu0 = calculateCpuUtilization(cpu0_cached0, cpu0_cached1);
    std::string cpu1 = calculateCpuUtilization(cpu1_cached0, cpu1_cached1);
    std::string cpu2 = calculateCpuUtilization(cpu2_cached0, cpu2_cached1);
    std::string cpu3 = calculateCpuUtilization(cpu3_cached0, cpu3_cached1);
    std::string cpu4 = calculateCpuUtilization(cpu4_cached0, cpu4_cached1);
    std::string cpu5 = calculateCpuUtilization(cpu5_cached0, cpu5_cached1);
    std::string cpu6 = calculateCpuUtilization(cpu6_cached0, cpu6_cached1);
    std::string cpu7 = calculateCpuUtilization(cpu7_cached0, cpu7_cached1);

    std::string aaa = cpu + " " + cpu0 + " " + cpu1 + " " + cpu2 + " " + cpu3 + " " + cpu4 + " " + cpu5 + " " + cpu6 + " " + cpu7;

    LOGI("GetCpu_stat_cpu success! Cached is %{public}s", aaa.c_str());
    napi_value res;
    napi_create_string_utf8(env, aaa.c_str(), strlen(aaa.c_str()), &res);
    return res;
}
index.d.ts
export const getCpu_stat_cpu: () => String; //获取cpu以及各个核利用率Index.ts
import testStatisticsApi from 'libentry.so';
@State Cpu_stat_cpu: String = '';
//getCpu_stat_cpu
this.Cpu_stat_cpu = testStatisticsApi.getCpu_stat_cpu();
console.log("========Cpu_stat_cpu is ",this.Cpu_stat_cpu)
Text(
"SOC温度:"+ (Number(this.soctemp)/1000).toFixed(3) +"°C" + "\t\t\t CPU利用率:" + (Number(this.Cpu_stat_cpu.split(" ")[0])).toFixed(3) +
"\nCPU大核7温度:"+(Number(this.CPU_CORE_big7_temp)/1000).toFixed(3) +"°C" + "\tCPU大核7利用率:" + (Number(this.Cpu_stat_cpu.split(" ")[8])).toFixed(3) +
"\nCPU中核6温度:"+(Number(this.CPU_CORE_mid6_temp)/1000).toFixed(3) +"°C" + "\tCPU中核6利用率:" + (Number(this.Cpu_stat_cpu.split(" ")[7])).toFixed(3) +
"\nCPU中核5温度:"+(Number(this.CPU_CORE_mid5_temp)/1000).toFixed(3) +"°C" + "\tCPU中核5利用率:" + (Number(this.Cpu_stat_cpu.split(" ")[6])).toFixed(3) +
"\nCPU中核4温度:"+(Number(this.CPU_CORE_mid4_temp)/1000).toFixed(3) +"°C" + "\tCPU中核4利用率:" + (Number(this.Cpu_stat_cpu.split(" ")[5])).toFixed(3) +
"\nCPU小核3温度:"+(Number(this.CPU_CORE_lit3_temp)/1000).toFixed(3) +"°C" + "\tCPU小核3利用率:" + (Number(this.Cpu_stat_cpu.split(" ")[4])).toFixed(3) +
"\nCPU小核2温度:"+(Number(this.CPU_CORE_lit2_temp)/1000).toFixed(3) +"°C" + "\tCPU小核2利用率:" + (Number(this.Cpu_stat_cpu.split(" ")[3])).toFixed(3) +
"\nCPU小核1温度:"+(Number(this.CPU_CORE_lit1_temp)/1000).toFixed(3) +"°C" + "\tCPU小核1利用率:" + (Number(this.Cpu_stat_cpu.split(" ")[2])).toFixed(3) +
"\nCPU小核0温度:"+(Number(this.CPU_CORE_lit0_temp)/1000).toFixed(3) +"°C" + "\tCPU小核0利用率:" + (Number(this.Cpu_stat_cpu.split(" ")[1])).toFixed(3)
)(5)获取上下文切换的总数
TestStatisticsInfo.cpp

// 获取proc/stat文件的ctxt: 上下文切换的总数
napi_value TestStatisticsInfo::Getctxt(napi_env env, napi_callback_info info) {
    if ((nullptr == env) || (nullptr == info)) {
        LOGE("TestStatisticsInfo::Getctxt: env or info is null");
        return nullptr;
    }

    napi_value thisArg;
    if (napi_ok != napi_get_cb_info(env, info, nullptr, nullptr, &thisArg, nullptr)) {
        LOGE("TestStatisticsInfo::Getctxt: napi_get_cb_info fail");
        return nullptr;
    }
    std::string cached = getCpu_stat("ctxt");
    LOGI("getCpu_stat success! Cached is %{public}s", cached.c_str());
    napi_value res;
    napi_create_string_utf8(env, cached.c_str(), strlen(cached.c_str()), &res);
    return res;
}
(6)启动的进程数
TestStatisticsInfo.cpp

//获取proc/stat文件的processes: 启动的进程数
napi_value TestStatisticsInfo::Getprocesses(napi_env env, napi_callback_info info) {
    if ((nullptr == env) || (nullptr == info)) {
        LOGE("TestStatisticsInfo::Getprocesses: env or info is null");
        return nullptr;
    }

    napi_value thisArg;
    if (napi_ok != napi_get_cb_info(env, info, nullptr, nullptr, &thisArg, nullptr)) {
        LOGE("TestStatisticsInfo::Getprocesses: napi_get_cb_info fail");
        return nullptr;
    }
    std::string cached = getCpu_stat("processes");
    LOGI("getCpu_stat success! Cached is %{public}s", cached.c_str());
    napi_value res;
    napi_create_string_utf8(env, cached.c_str(), strlen(cached.c_str()), &res);
    return res;
}责任编辑:jianghua
来源:
51CTO 鸿蒙开发者社区
Recommend
About Joyk
Aggregate valuable and interesting links.
Joyk means Joy of geeK