

Vanguard economic and market outlook 2024: Global summary
source link: https://www.nl.vanguard/professional/insights/macro-economics/vanguard-economic-and-market-outlook-2024-global-summary
Go to the source link to view the article. You can view the picture content, updated content and better typesetting reading experience. If the link is broken, please click the button below to view the snapshot at that time.


Vanguard economic and market outlook 2024: Global summary
An era of higher interest rates marks a return to sound money. Read more of Vanguard’s 2024 views in this summary.
- Higher interest rates are here to stay. This development ushers in a return to sound money, and the implications for the global economy and financial markets will be profound.
- For households and businesses, higher interest rates will limit borrowing, increase the cost of capital and encourage saving. For governments, higher rates will force a reassessment of fiscal outlooks sooner rather than later.
- Vanguard believes that a higher interest rate environment will serve investors well in achieving their long-term financial goals, but the transition may be bumpy.
This article is a shortened version of the global outlook summary, which highlights the top-level findings of Vanguard’s full economic and market outlook, to be distributed in mid-December. Read the extended global outlook summary.
The summary of Vanguard’s economic and market outlook for 2024 suggests that higher interest rates are here to stay. This development ushers in a return to sound money, and the implications for the global economy and financial markets will be profound. Vanguard believes that a higher interest rate environment will serve investors well in achieving their long-term financial goals, but the transition may be bumpy.
Webinar: Vanguard economic and market outlook for 2024
Register now to watch our economists share their views on what lies ahead for global markets in 2024.

"Despite the potential for near-term volatility, we believe the rise in interest rates is the single best economic and financial development in 20 years for long-term investors."
Joe Davis
Vanguard Global Chief Economist and Global Head of the Investment Strategy Group

Monetary policy will bare its teeth in 2024
We expect monetary policy to become increasingly restrictive in real terms in 2024 as inflation falls and offsetting forces wane. The economy will experience a mild downturn as a result. This is necessary to finish the job of returning inflation to target. However, there are risks to this view. A “soft landing”, in which inflation returns to target without recession, remains possible, as does a recession that is further delayed. In Europe, we expect anaemic growth as restrictive monetary and fiscal policy lingers, while in China, we expect additional policy stimulus to sustain economic recovery amid increasing external and structural headwinds.
Zero rates are yesterday’s news
A recession is likely a necessary condition to bring down the rate of inflation, through weakening demand for labour and slower wage growth. As central banks feel more confident in inflation’s path towards targets, we expect they will start to cut policy rates in the second half of 2024.
That said, we expect policy rates to settle at a higher level compared with after the global financial crisis (GFC) and during the Covid-19 pandemic. This higher interest rate environment will last not months, but years. It is a structural shift that will endure beyond the next business cycle and, in our view, is the single most important financial development since the GFC.
Vanguard’s 2024 economic forecasts
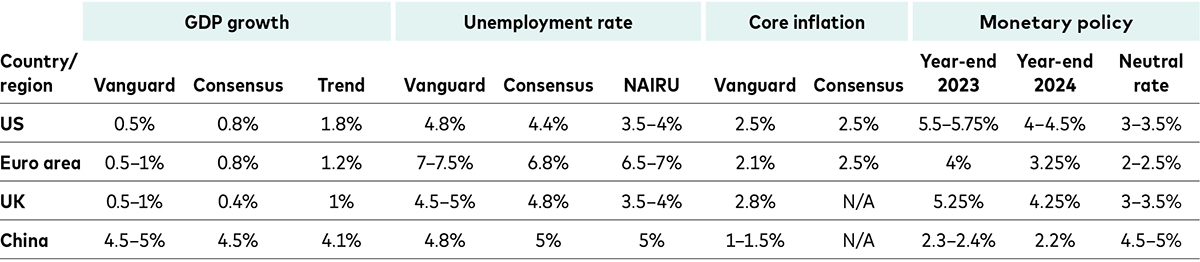
Notes: Forecasts are as at 14 November 2023. For the US, GDP growth is defined as the year-over-year change in fourth-quarter GDP. For all other countries/regions, GDP growth is defined as the annual change in GDP in the forecast year compared with the previous year. Unemployment forecasts are the average for the fourth quarter of 2024. NAIRU is the non-accelerating inflation rate of unemployment, a measure of labour market equilibrium. Core inflation excludes volatile food and energy prices. For the US, euro area and UK, core inflation is defined as the year-over-year change in the fourth quarter compared with the previous year. For China, core inflation is defined as the average annual change compared with the previous year. For the US, core inflation is based on the core Personal Consumption Expenditures Index. For all other countries/regions, core inflation is based on the core Consumer Price Index. The neutral rate is the equilibrium policy rate at which no easing or tightening pressures are being placed upon an economy or its financial markets.
Souce: Vanguard.
Bond market outlook
Despite the potential for near-term volatility, we believe this rise in interest rates is the single best economic and financial development in 20 years for long-term investors. Our bond return expectations have increased substantially. We now expect euro area bonds to return a nominal annualised 2.9%–3.9% over the next decade, compared with the -0.5%-0.5% annualised returns we expected before the rate-hiking cycle began. Similarly, for hedged global ex-euro area bonds, we expect annualised returns of 2.8%-3.8% over the next decade, compared with a forecast of -0.5%-0.5% when policy rates were low or, in some cases, negative.
If reinvested, the income component of bond returns at this level of rates will eventually more than offset the capital losses experienced over the last two years. By the end of the decade, bond portfolio values are expected to be higher than if rates had not increased in the first place.
Similarly, the case for the 60/40 portfolio1 is stronger than in recent memory. Long-term investors in balanced portfolios have seen a dramatic rise in the probability of achieving a 10-year annualised return of at least 5%, from close to a 0% likelihood in 2021 to 44% today.
Equity market outlook
A higher-rate environment depresses asset price valuations across global markets while squeezing profit margins as corporations find it more expensive to issue and refinance debt. Valuations are most stretched in the US. As a result, we have downgraded our US equity return expectations for euro area investors to an annualised 2.4%-4.4% over the next 10 years from 3.1%-5.1% heading into 2023. Within the US market, value stocks are more attractive than they have been since late 2021, and small-capitalisation stocks also appear attractive for the long term.
US equities have continued to outperform their international peers. The key drivers of this performance gap over the last two years have been valuation expansion and US dollar strength beyond our fair-value estimates, both of which are likely to reverse. Indeed, our Vanguard Capital Markets Model® (VCMM) projections suggest an increasing likelihood of greater opportunities outside the US. We project 10-year annualised returns of 5.0%-7.0% for non-US developed markets, 4.3%-6.3% for euro-area equities and 4.6%-6.6% for emerging markets, all from a euro area investor’s perspective.
A return to sound money
For households and businesses, higher interest rates will limit borrowing, increase the cost of capital and encourage saving. For governments, higher rates will force a reassessment of fiscal outlooks sooner rather than later.
For well-diversified investors, the permanence of higher real interest rates is a welcome development. It provides a solid foundation for long-term risk-adjusted returns. However, as the transition to higher rates is not yet complete, near-term financial market volatility is likely to remain elevated.
IMPORTANT: The projections and other information generated by the Vanguard Capital Markets Model® (VCMM) regarding the likelihood of various investment outcomes are hypothetical in nature, do not reflect actual investment results and are not guarantees of future results. Distribution of return outcomes from VCMM are derived from 10,000 simulations for each modelled asset class. Simulations as of 30 September 2023. Results from the model may vary with each use and over time. For more information, please see the Notes section.
Notes:
IMPORTANT: The projections or other information generated by the Vanguard Capital Markets Model® regarding the likelihood of various investment outcomes are hypothetical in nature, do not reflect actual investment results, and are not guarantees of future results. VCMM results will vary with each use and over time. The VCMM projections are based on a statistical analysis of historical data. Future returns may behave differently from the historical patterns captured in the VCMM. More important, the VCMM may be underestimating extreme negative scenarios unobserved in the historical period on which the model estimation is based.
The VCMM projections are based on a statistical analysis of historical data. Future returns may behave differently from the historical patterns captured in the VCMM. More importantly, the VCMM may be underestimating extreme negative scenarios unobserved in the historical period on which the model estimation is based.
The Vanguard Capital Markets Model® is a proprietary financial simulation tool developed and maintained by Vanguard’s primary investment research and advice teams. The model forecasts distributions of future returns for a wide array of broad asset classes. Those asset classes include US and international equity markets, several maturities of the US Treasury and corporate fixed income markets, international fixed income markets, US money markets, commodities and certain alternative investment strategies. The theoretical and empirical foundation for the Vanguard Capital Markets Model is that the returns of various asset classes reflect the compensation investors require for bearing different types of systematic risk (beta). At the core of the model are estimates of the dynamic statistical relationship between risk factors and asset returns, obtained from statistical analysis based on available monthly financial and economic data from as early as 1960. Using a system of estimated equations, the model then applies a Monte Carlo simulation method to project the estimated interrelationships among risk factors and asset classes as well as uncertainty and randomness over time. The model generates a large set of simulated outcomes for each asset class over several time horizons. Forecasts are obtained by computing measures of central tendency in these simulations. Results produced by the tool will vary with each use and over time.
1 In our analysis, the 60% equity/40% fixed income portfolio is represented by the following indices: Equity: MSCI AC World Total Return Index. Fixed income: Bloomberg Global Aggregate Bond Index Euro Hedged.
Recommend
About Joyk
Aggregate valuable and interesting links.
Joyk means Joy of geeK