

如何洞察 C# 程序的 GDI 句柄泄露
source link: https://www.cnblogs.com/huangxincheng/p/17474733.html
Go to the source link to view the article. You can view the picture content, updated content and better typesetting reading experience. If the link is broken, please click the button below to view the snapshot at that time.

1. 讲故事
前段时间有位朋友找到我,说他的程序界面操作起来很慢并且卡顿等一些不正常现象,从任务管理器看了下 GDI句柄 已经到 1w 了,一时也找不出什么代码中哪里有问题,让我帮忙看下,其实这种问题看内存dump作用不是很大,主要是写脚本很麻烦,这一篇我们就来简单聊聊如何洞察此类问题。
二:如何洞察泄露
1. 一个测试小案例
在 windows 上gdi的句柄类型有很多,比如:pen,font,bitmap,device 等,具体可以网上搜一下,这里我就造一个 bitmap 的句柄泄露,参考代码如下:
        private void button1_Click(object sender, EventArgs e)
        {
            Task.Factory.StartNew(() =>
            {
                Bitmap bmp = new Bitmap(100, 100);

                for (int i = 0; i < 10000; i++)
                {
                    bmp.GetHbitmap();
                    Thread.Sleep(100);
                }
            });
        }
代码非常简单,大概 100ms 泄露一个 bitmap 句柄,接下来把程序跑起来点击 Button_Click 按钮,然后上瑞士军刀 WinDbg 附加进程。
2. 如何观察GDI泄露
观察 GDI句柄 是否异常,最简单的方法就是看任务管理器中的 GDI对象 一列,截图如下:
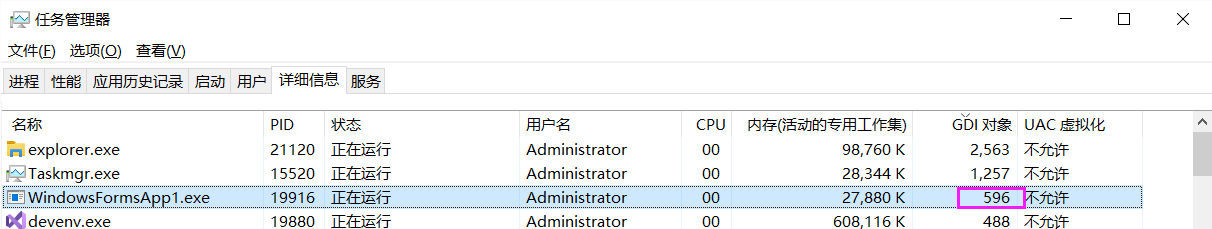
但这里有一个问题,你只知道有一个总数,并不知道是哪种句柄类型的泄露,比如是:bitmap? font ?device? 对吧。
那怎么办呢?这就需要考验一点基础知识了,你要知道 GDI 的句柄表(GDI Shared Handle Table)是维护在用户态的虚拟地址上,区别于维护在内核中的 ObjectTable,可以用 !address 验证下。
0:011> !address

        BaseAddress      EndAddress+1        RegionSize     Type       State                 Protect             Usage
--------------------------------------------------------------------------------------------------------------------------
+      294`d1500000      294`d1681000        0`00181000 MEM_MAPPED  MEM_COMMIT  PAGE_READONLY                      Other      [GDI Shared Handle Table]

0:011> !address 294`d1500000

Usage:                  Other
Base Address:           00000294`d1500000
End Address:            00000294`d1681000
Region Size:            00000000`00181000 (   1.504 MB)
State:                  00001000          MEM_COMMIT
Protect:                00000002          PAGE_READONLY
Type:                   00040000          MEM_MAPPED
Allocation Base:        00000294`d1500000
Allocation Protect:     00000002          PAGE_READONLY
Additional info:        GDI Shared Handle Table


Content source: 1 (target), length: 181000
在这 1.5M 的虚拟地址段中就雪藏了我们要找的各句柄的统计信息,但要挖它需要写脚本,再配合 GDICELL 结构体,分组其中的 wType 句柄类型。
typedef struct {
  PVOID64 pKernelAddress; // 0x00
  USHORT wProcessId;      // 0x08
  USHORT wCount;          // 0x0a
  USHORT wUpper;          // 0x0c
  USHORT wType;           // 0x0e
  PVOID64 pUserAddress;   // 0x10
} GDICell;                // sizeof = 0x18
虽然可以手工分组出来,但这种问题你肯定不是第一个遇到,早有人写了一个工具来解决这类问题,它就是 GDIView.exe,大家可以网上搜一下。
打开 GDIView 之后,可以很清楚的看到 WindowsFormsApp1 程序中各个句柄的统计信息,并且 type=Bitmap 是非常可疑的,截图如下:
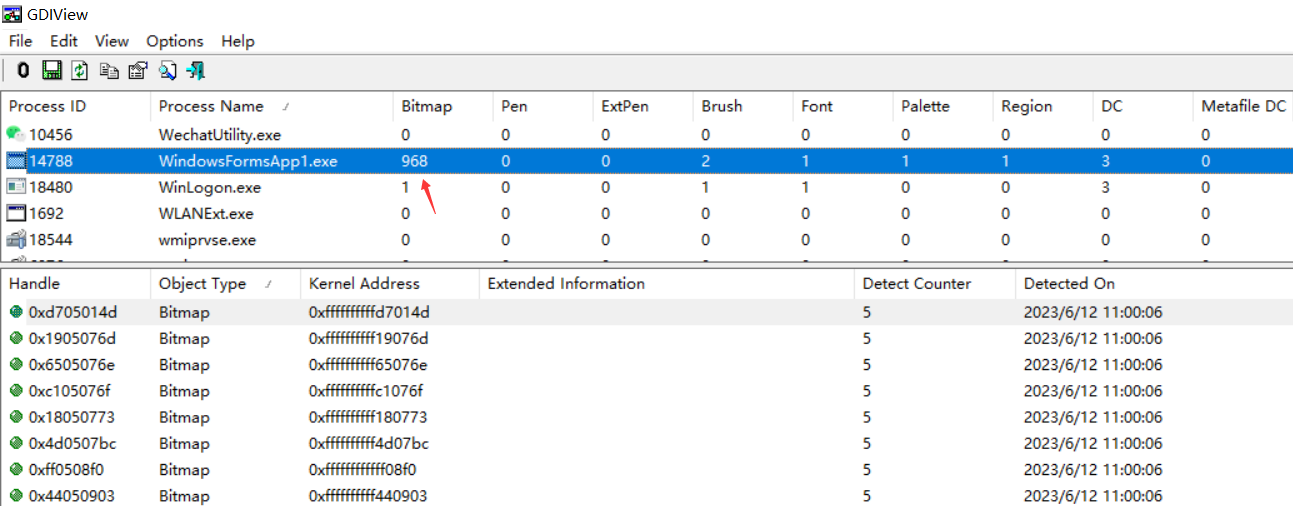
知道了是 Bitmap 的句柄泄露,定位的范围一下子就小了很多,长舒一口气。
3. 如何寻找 Bitmap 的底层函数
熟悉 Windows 的朋友应该都知道 GDI 的逻辑是封装在底层的 GDI32.dll 中,模块信息如下:
0:012> lmvm gdi32
Browse full module list
start             end                 module name
00007ff9`b0c80000 00007ff9`b0cab000   GDI32      (deferred)
    Image path: C:\windows\System32\GDI32.dll
    Image name: GDI32.dll
    Browse all global symbols  functions  data
    Image was built with /Brepro flag.
    Timestamp:        3EE1D71F (This is a reproducible build file hash, not a timestamp)
    CheckSum:         0002B228
    ImageSize:        0002B000
    File version:     10.0.19041.2130
    Product version:  10.0.19041.2130
    File flags:       0 (Mask 3F)
    File OS:          40004 NT Win32
    File type:        2.0 Dll
    File date:        00000000.00000000
    Translations:     0409.04b0
    Information from resource tables:
        CompanyName:      Microsoft Corporation
        ProductName:      Microsoft® Windows® Operating System
        InternalName:     gdi32
        OriginalFilename: gdi32
        ProductVersion:   10.0.19041.2130
        FileVersion:      10.0.19041.2130 (WinBuild.160101.0800)
        FileDescription:  GDI Client DLL
        LegalCopyright:   © Microsoft Corporation. All rights reserved.
言外之意就是可以在 GDI32 模块中下方法断点,这时候问题就来了,到底搁哪个方法下呢?这个只能求助 MSDN 了,功夫不负有心人,找到了一篇很老的文章:https://learn.microsoft.com/en-us/archive/msdn-magazine/2003/january/detect-and-plug-gdi-leaks-with-two-powerful-tools-for-windows-xp
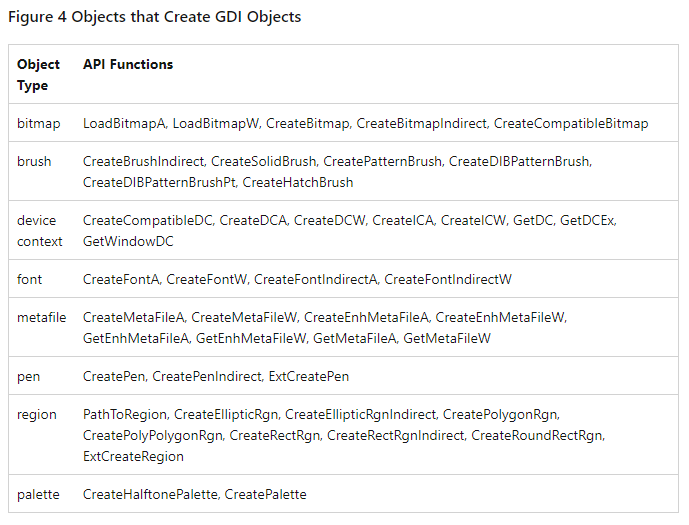
从图中看记载的非常详细,但我亲自观察下来有些方法找不到,所以只能做个参考吧,不过在 Windbg 中提供了一个非常好的 bm 命令,它可以对方法名进行 模糊断点,比如 bm gdi32!*Bitmap* 就可以一口气下 45 个断点。
0:012> bm gdi32!*Bitmap* "? @$tid; k; gc"
  0: 00007ff9`b0c86f7c @!"GDI32!IsCreateBitmapPresent"
  1: 00007ff9`b0c87216 @!"GDI32!_imp_load_CreateDIBitmap"
  2: 00007ff9`b0c8906c @!"GDI32!_imp_load_DwmCreatedBitmapRemotingOutput"
  3: 00007ff9`b0c86460 @!"GDI32!NtGdiGetBitmapDpiScaleValue"
  4: 00007ff9`b0c8850c @!"GDI32!_imp_load_ClearBitmapAttributes"
  5: 00007ff9`b0c88745 @!"GDI32!_imp_load_CreateDiscardableBitmap"
  6: 00007ff9`b0c84470 @!"GDI32!CreateBitmapStub"
 ...
 42: 00007ff9`b0c8713e @!"GDI32!_imp_load_GetBitmapBits"
 43: 00007ff9`b0c89580 @!"GDI32!GdiConvertBitmapV5"
 44: 00007ff9`b0c89080 @!"GDI32!DwmCreatedBitmapRemotingOutput"
 45: 00007ff9`b0c8aaac @!"GDI32!_imp_load_SetBitmapDimensionEx"

0:007> .bpcmds
bu0 @!"GDI32!IsCreateCompatibleBitmapPresent" "? @$tid; k; gc";
bu1 @!"GDI32!_imp_load_CreateDIBitmap" "? @$tid; k; gc";
bu2 @!"GDI32!_imp_load_DwmCreatedBitmapRemotingOutput" "? @$tid; k; gc";
bu3 @!"GDI32!NtGdiGetBitmapDpiScaleValue" "? @$tid; k; gc";
bu4 @!"GDI32!_imp_load_ClearBitmapAttributes" "? @$tid; k; gc";
bu5 @!"GDI32!_imp_load_CreateDiscardableBitmap" "? @$tid; k; gc";
...
天网恢恢,疏而不漏,肯定会命中其中一个的,接下来继续 g 让程序跑起来,你会看到有大量的方法被命中,并且仔细观察会有一个用户态函数 <button1_Click>b__1_0,截图如下:
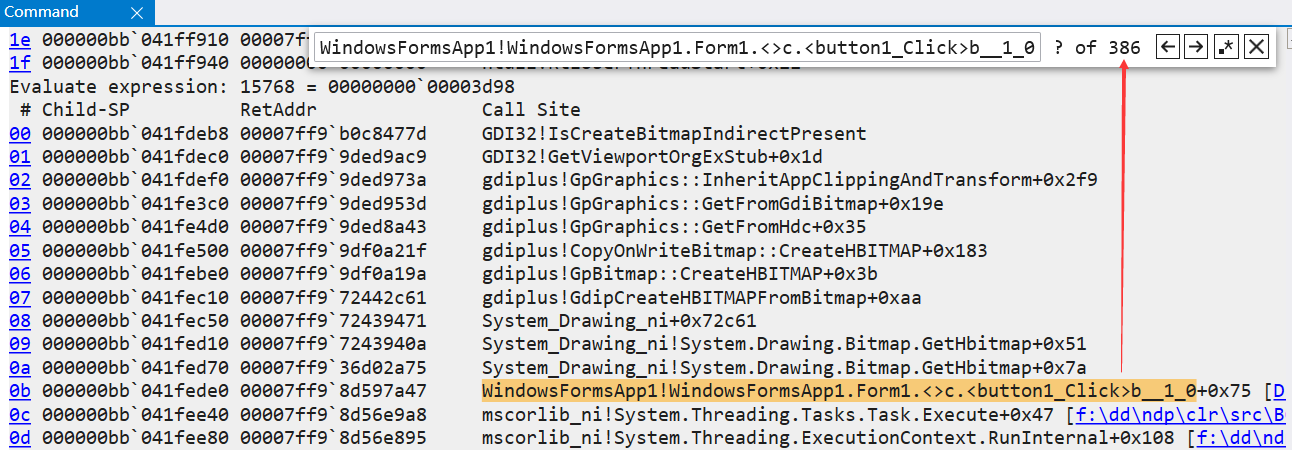
此时这个托管函数就是重点怀疑对象,也就很轻松的找到问题之所在,有些朋友可能要问,这样重复的信息是不是会很多,那当然了,大家可以根据输出信息做下一步的洞察,比如上面的 gdiplus!CopyOnWriteBitmap::CreateHBITMAP 函数会特别多,这时候可以重新 bp 来缩小范围,对吧!参考代码如下:
0:010> bc *
0:010> bp gdiplus!CopyOnWriteBitmap::CreateHBITMAP "? @$tid; k; gc"

0:010> g
Evaluate expression: 15768 = 00000000`00003d98
 # Child-SP          RetAddr               Call Site
00 000000bb`041febd8 00007ff9`9df0a21f     gdiplus!CopyOnWriteBitmap::CreateHBITMAP
01 000000bb`041febe0 00007ff9`9df0a19a     gdiplus!GpBitmap::CreateHBITMAP+0x3b
02 000000bb`041fec10 00007ff9`72442c61     gdiplus!GdipCreateHBITMAPFromBitmap+0xaa
03 000000bb`041fec50 00007ff9`72439471     System_Drawing_ni+0x72c61
04 000000bb`041fed10 00007ff9`7243940a     System_Drawing_ni!System.Drawing.Bitmap.GetHbitmap+0x51
05 000000bb`041fed70 00007ff9`36d02a75     System_Drawing_ni!System.Drawing.Bitmap.GetHbitmap+0x7a
06 000000bb`041fede0 00007ff9`8d597a47     WindowsFormsApp1!WindowsFormsApp1.Form1.<>c.<button1_Click>b__1_0+0x75
...
说实话,找到程序的 GDI句柄泄露 的前因后果难度系数还是蛮高的,在没有系统科学的工具和基础知识之前,花费几天的时间排查这个问题是很正常的,相信这篇文章给后来人少踩坑吧。

Recommend
About Joyk
Aggregate valuable and interesting links.
Joyk means Joy of geeK