

Hacking folium for nicer legends
source link: https://andrewpwheeler.com/2023/04/25/hacking-folium-for-nicer-legends/
Go to the source link to view the article. You can view the picture content, updated content and better typesetting reading experience. If the link is broken, please click the button below to view the snapshot at that time.

Hacking folium for nicer legends
I have accumulated various code to hack folium based maps over several recent projects, so figured would share. It is a bit too much to walk through the entire code inline in a blog post, but high level the extras this code does:
- Adds in svg elements for legends in the layer control
- Has a method for creating legends for choropleth maps
- Inserts additional javascript to make a nice legend title (here a clickable company logo) + additional attributions
Here is the link to a live example, and below is a screenshot:
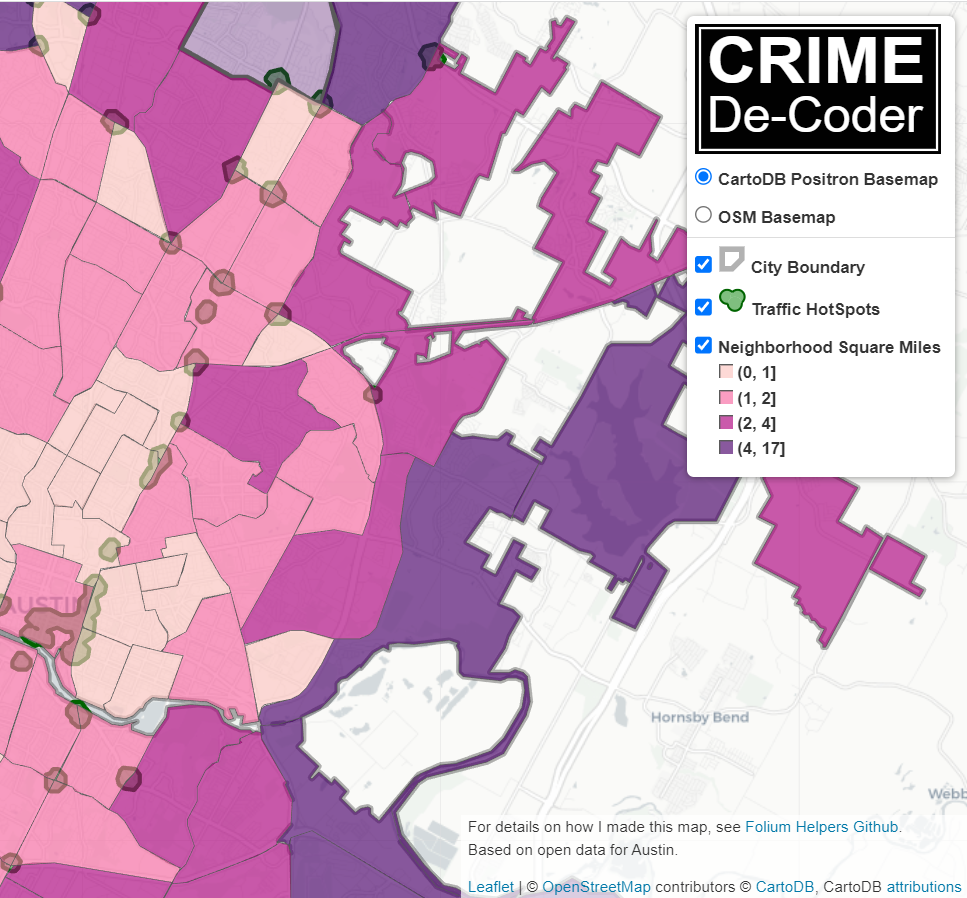
So as a quick rundown, if you are adding in an element to a folium layer, e.g.:
folium.FeatureGroup(name="Your Text Here",overlay=True,control=True)You can insert arbitrary svg code into the name parameter, e.g. you can do something like <span><svg .... /svg>HotSpots</span>, and it will correctly render. So I have functions to make the svg icon match the passed color. So you can see I have a nice icon for city boundary’s, as well as a blobby thing for hotspots.
There in the end are so many possible parameters, I try to make reasonable functions without too crazy many parameters. So if someone wanted different icons, I might just make a different function (probably wouldn’t worry about passing in different potential svg).
I have a function for choropleth maps as well – I tend to not like the functions that you pass in a continuous variable and it does a color map for you. So here it is simple, you pass in a discrete variable with the label, and a second dictionary with the mapped colors. I tend to not use choropleth maps in interactive maps very often, as they are more difficult to visualize with the background map. But there you have it if you want it.
The final part is using javascript to insert the Crime Decoder logo (as a title in the legend/layer control), as well as the map attribution with additional text. These are inserted via additional javascript functions that I append to the html (so this wouldn’t work say inline in a jupyter notebook). The logo part is fairly simple, the map attribution though is more complicated, and requires creating an event listener in javascript on the correct elements.
The way that this works, I actually have to save the HTML file, then I reread the text back into python, add in additional CSS/javascript, and then resave the file.
If you want something like this for your business/website/analysts, just get in contact.
For next tasks, I want to build a demo-dashboard for Crime De-Coder (probably a serverless dashboard using wasm/pyscript). But in terms of leaflet extras, the ability to embed SVG into different elements, you can create charts in popups/tooltips, which would be a cool addition to my hotspots (click and it has a time series chart inside).
Recommend
About Joyk
Aggregate valuable and interesting links.
Joyk means Joy of geeK