

10 Charts That Capture How the World Is Changing
source link: https://digitalnative.substack.com/p/10-charts-that-capture-how-the-world-e63?
Go to the source link to view the article. You can view the picture content, updated content and better typesetting reading experience. If the link is broken, please click the button below to view the snapshot at that time.

Weekly writing exploring how technology and humanity collide. If you haven’t subscribed, join 40,000 weekly readers by subscribing here:
10 Charts That Capture How the World Is Changing
Last fall, I shared 10 charts that I found interesting and emblematic of broader themes. The 10 charts covered a wide array of topics, leaping from homeownership to digital media, climate change to job growth. A week later, I shared 10 more from my colleagues at Index—charts about generative AI, about healthcare, about remote work.
I’ve always been a visual learner, and charts help me process information. They’re also an efficient way to encapsulate how the world is changing. This week I’m sharing another set of charts; this may become something of a quarterly ritual.
The charts this week again cover a broad range of themes—
Mental Health Among Teenage Girls
Decline in Friendship, Rise in Loneliness
The Tech Bubble Has Burst
Climate Tech Defies the Downturn
ChatGPT Adoption and Exponential AI
The Market for Obesity
Temu’s Explosion
Duolingo’s Inflection Point
Average Office Occupancy
Long-Run Technological Innovation
My hope is that this is an engaging way to visualize how the world is changing.
Let’s jump in 📈
1️⃣ Mental Health Among Teenage Girls
Last week, a chart of teenage girls’ mental health began making the rounds online. The chart looks at measures of suicide, self-poisoning, and depression among U.S. girls ages 12 through 15.

The chart actually dates back to March 2020, when the psychologist Jean Twenge published a piece called “Increases in Depression, Self-Harm, and Suicide Among U.S. Adolescents After 2012 and Links to Technology Use.” But the chart got renewed interest last week when Paul Graham tweeted it, saying “It’s so obvious that something changed, and we all know what it is.”
His insinuation is that the rises of smartphones and social media directly coincide with the deterioration in teenage mental health, which is also Twenge’s argument. Here’s a chart tracking smartphone and social media adoption:
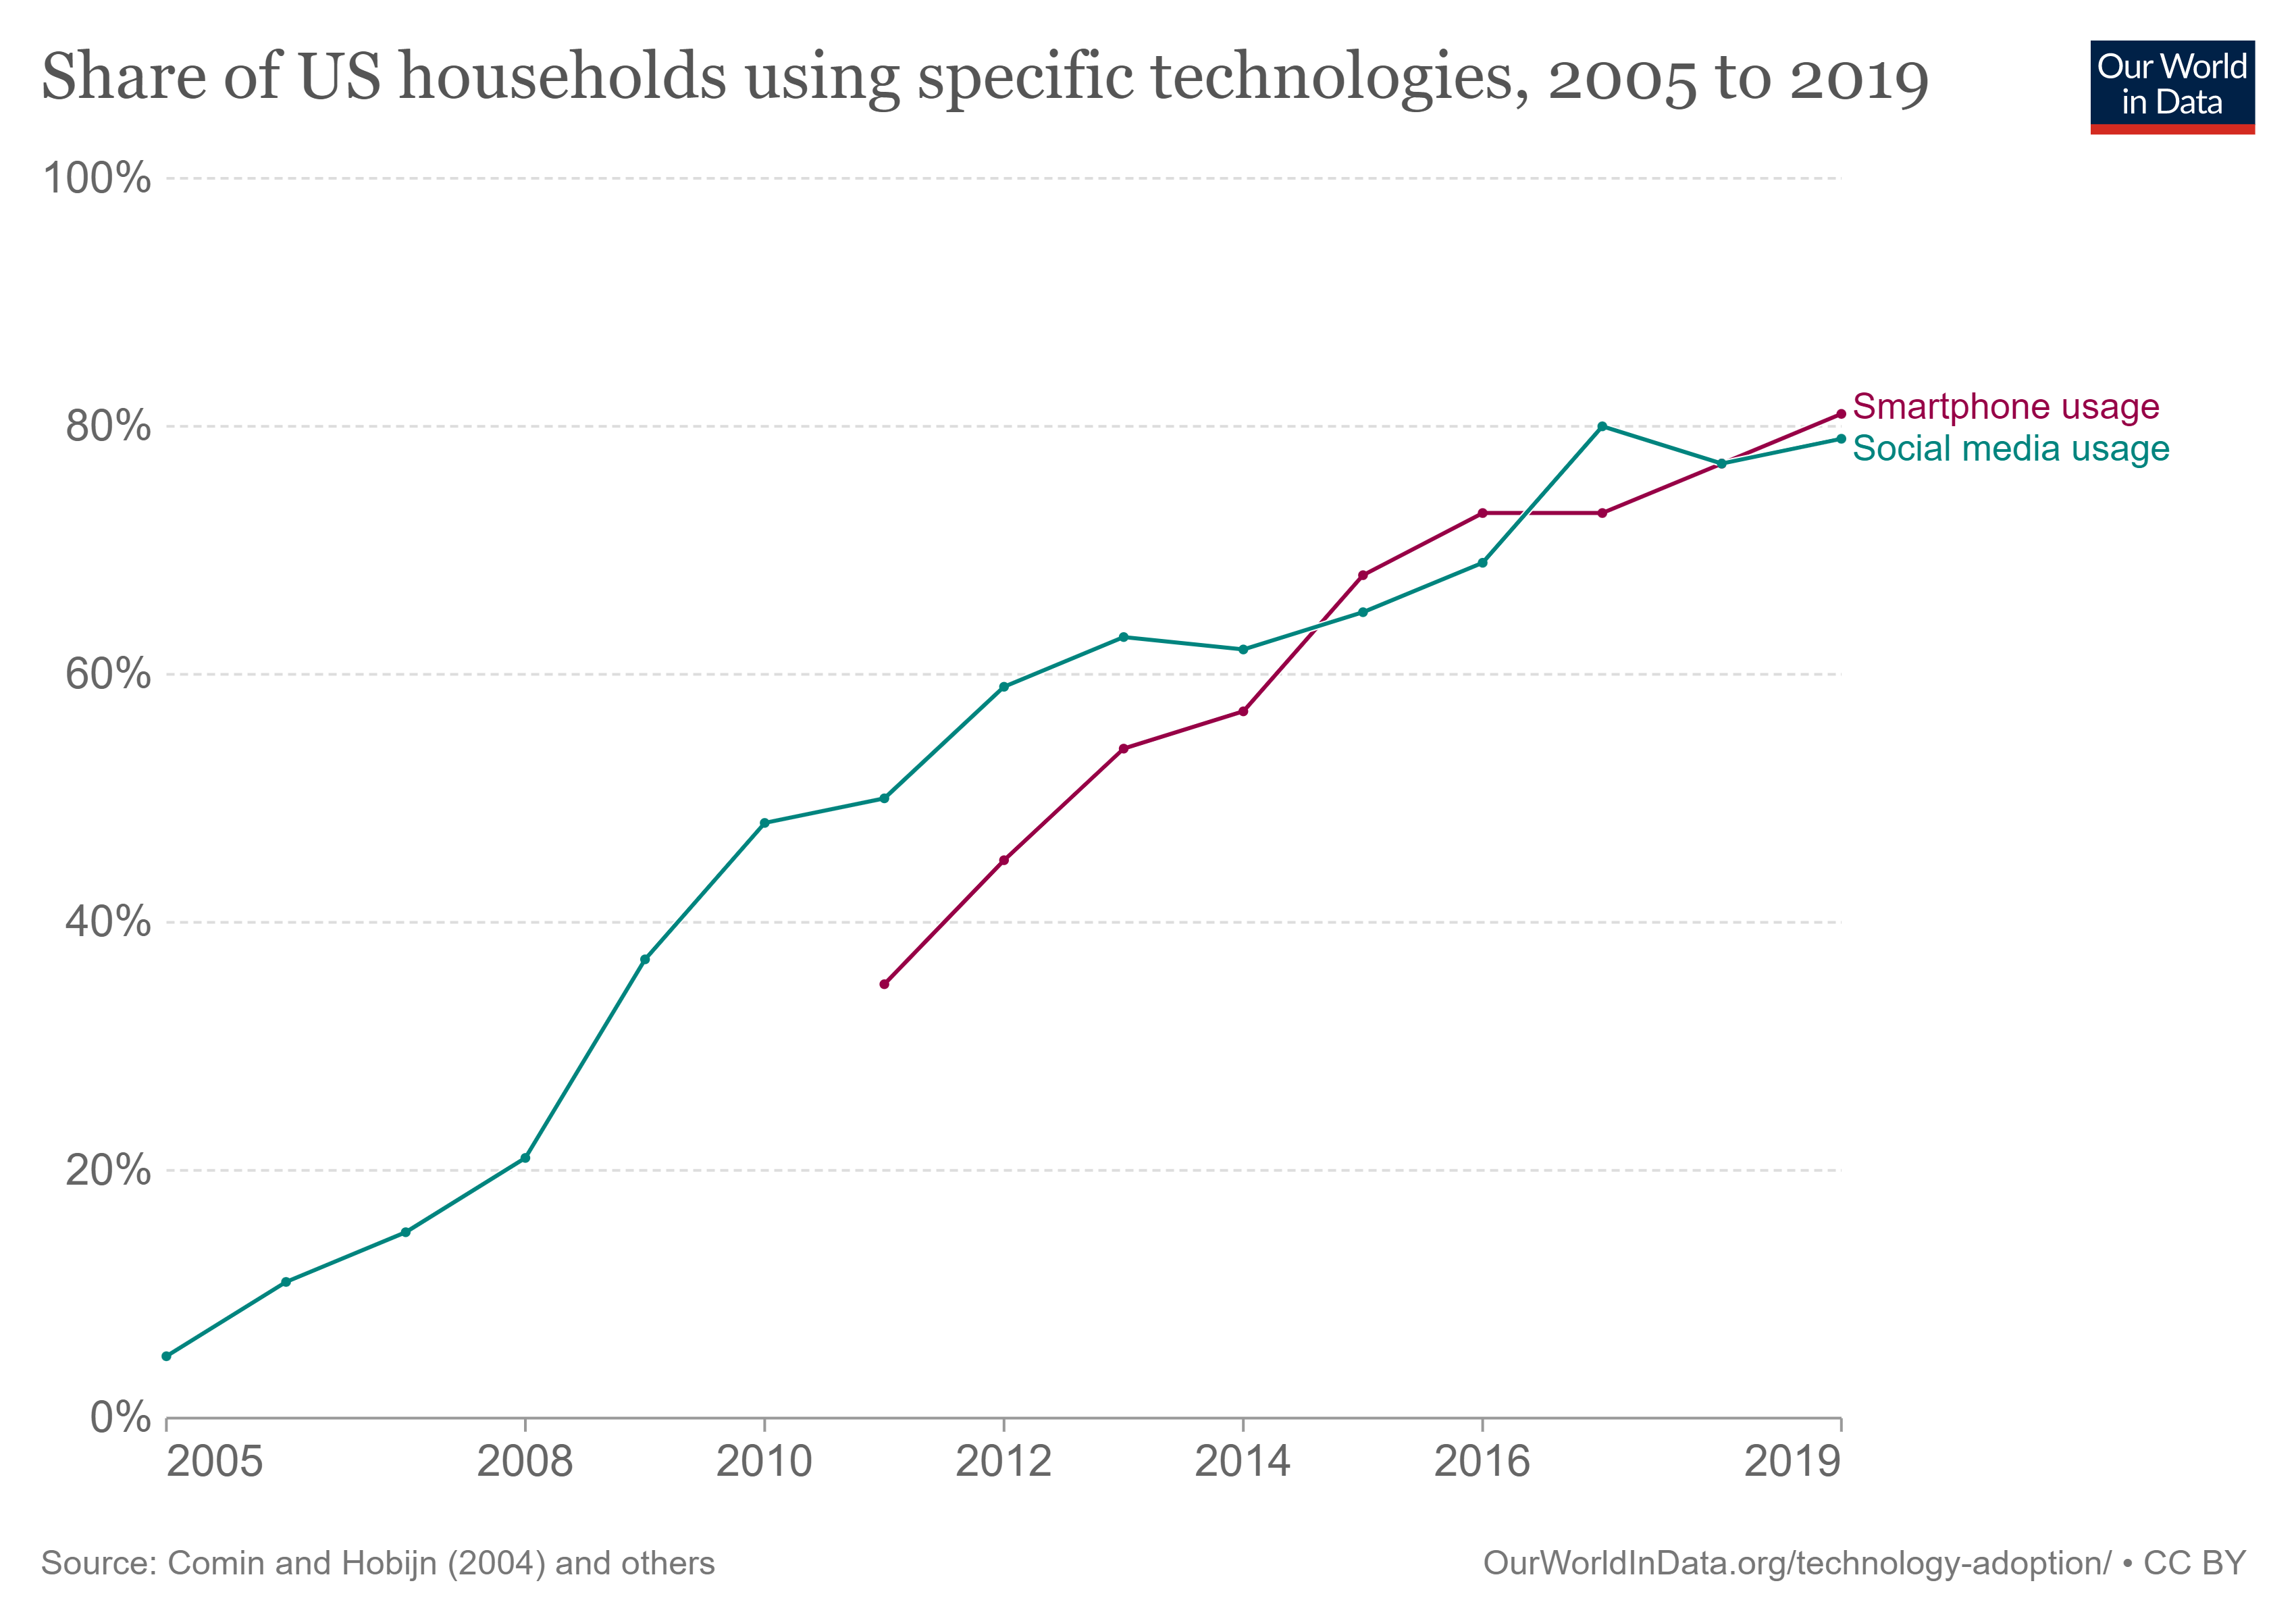
If you layer the two charts on top of one another, there’s an almost perfect correlation.
Some people are arguing that it’s actually the 24/7 news cycle that’s hurting teens’ mental health—an inundation of doomsday news around climate change, gun control, and bitter partisanship. But as Noah Smith points out in a good analysis, it all comes back to phones: only because of smartphones are we connected to the news 24/7. Same with our connection to (and comparison with) other people via social media. As Smith puts it: “When you had to go to a computer to check Facebook or Twitter, you could only experience it intermittently; now, with a smartphone in your pocket and notifications enabled, you were on every app all the time.”
Teenagers spend on average nine hours a day with screens. Smith also points to the rise of “phubbing”, the phenomenon of people going on their phones instead of paying attention to the people around them. Phubbing erodes social connection: studies have proven that if people have their phones on the dinner table when they dine with family and friends, they feel less connection to the people they’re with.
My view: much of the harm to mental health comes from social platforms that encourage comparison. As 20-year-old Olivia Rodrigo sings in the opening lines of “jealousy, jealousy”—
I kinda wanna throw my phone across the room
'Cause all I see are girls too good to be true
With paper-white teeth and perfect bodies, wish I didn't care
Instagram began as a literal filtered version of reality; despite “authenticity” being in vogue, photo dumps and BeReals and TikToks have gravitated to performance. In 2020, I wrote about the fact that while Snap and Insta filters encouraged unrealistic beauty standards, TikTok filters typically made you uglier. At the time, they were much less harmful. That’s no longer true: last week, TikTok’s “Bold Glamour” filter took the internet by storm, making millions of people feel terrible about their real appearance. (15.9M people have made videos with the filter.)
Bold Glamour uses a 3D face mesh and machine learning to make your brows darker, your nose slimmer, your lips fuller. Here’s a before and after:
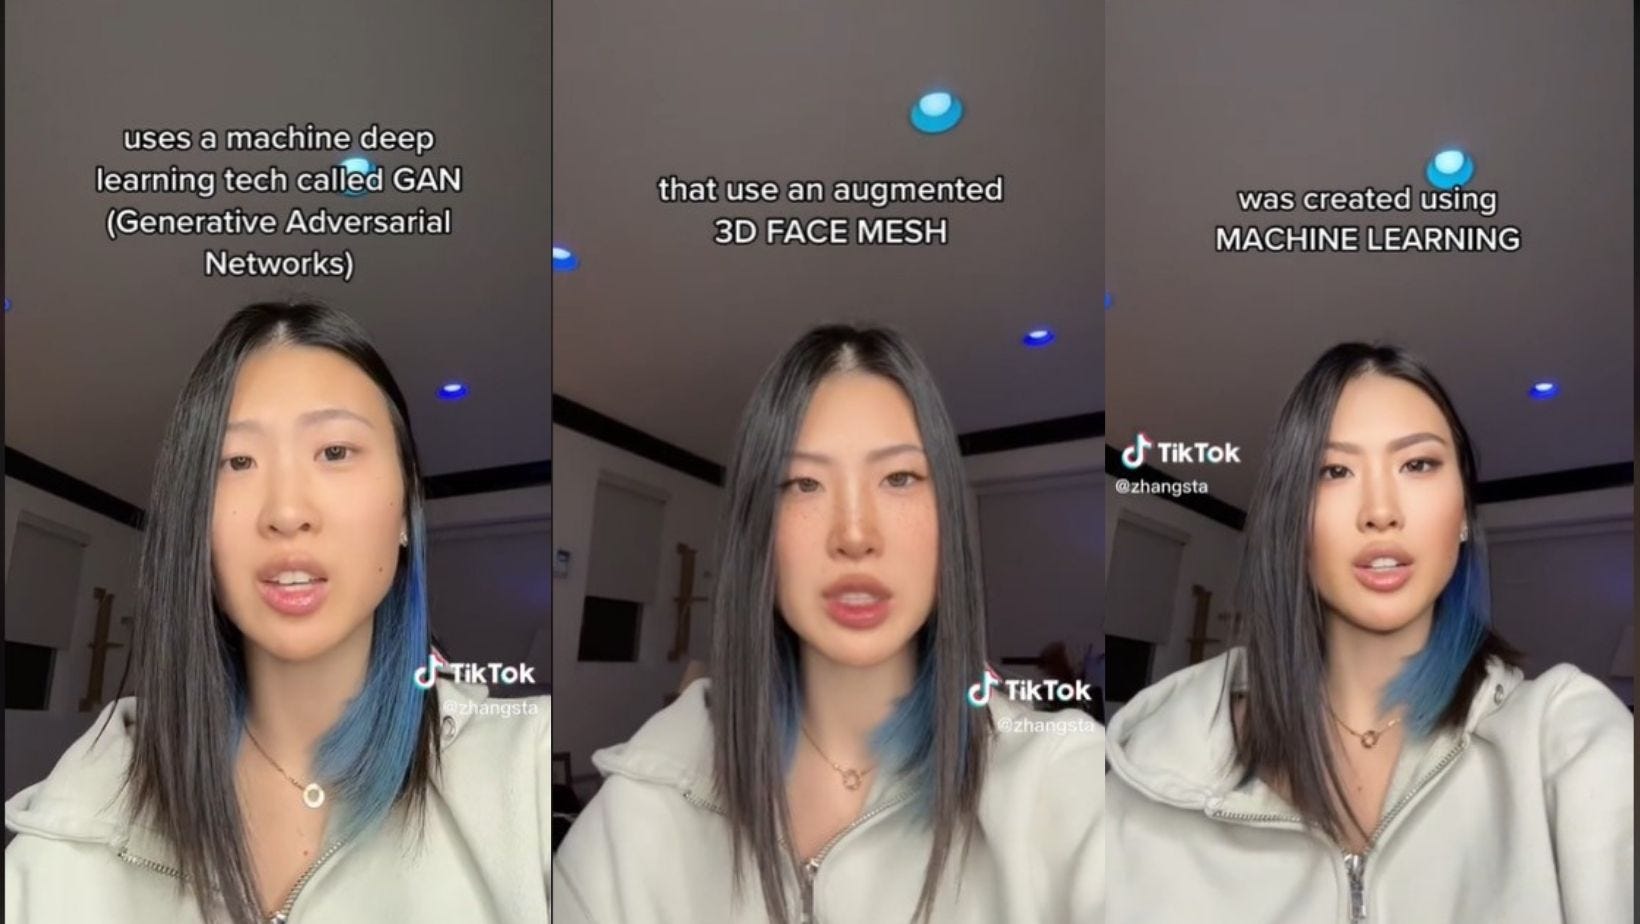
A 2021 study found that 94% of female participants felt pressured to look a certain way, and 90% reported using filters or editing tools to achieve that aspirational look. A 2017 study found that people only recognize when an image is manipulated about 60% of the time.
The rise of beautifying filters—Bold Glamour is only the latest example—reminds me of a plot line from David Foster Wallace’s Infinite Jest. In the 1996 book, a new technology emerges called the videophone; this is effectively FaceTime, 14 years before Steve Jobs would announce FaceTime at Apple’s 2010 Developers Conference. People begin buying “virtual masks” to make themselves look more attractive on their videophones. Foster Wallace writes:
It turned out that consumers’ instinctively skewed self-perception, plus vanity-related stress, meant that they began preferring and then outright demanding videophone masks that were really quite a lot better-looking than they themselves were in person.
In Infinite Jest, people become addicted to looking more attractive, so they stop going out in person—they only interact with other people online, where they can warp their appearances to achieve an otherwise-unattainable beauty standard.
2️⃣ Decline in Friendship, Rise in Loneliness
The deterioration in mental health charted above is also connected to a rise in loneliness, again precipitated by technology.
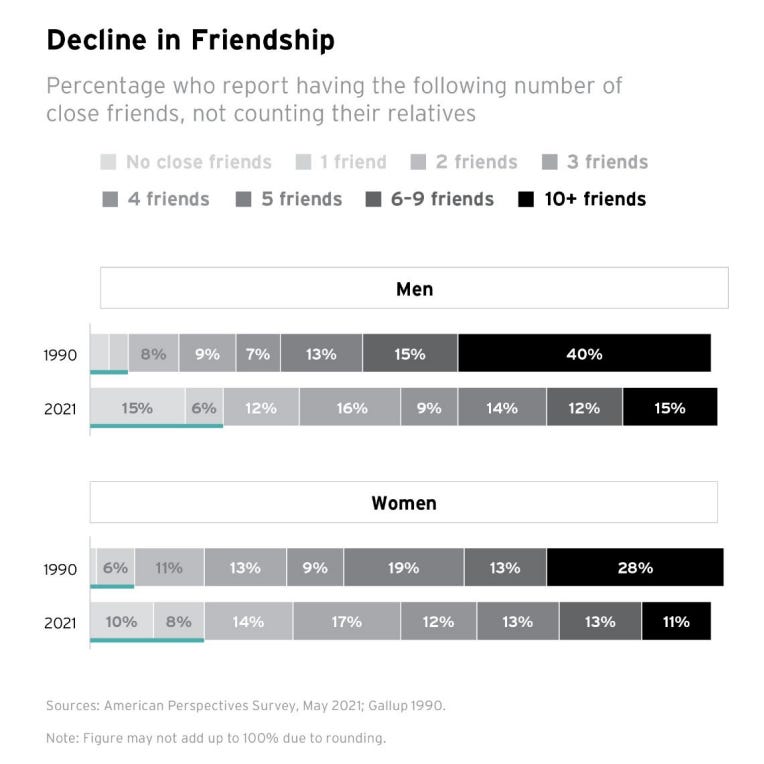
In the last 30 years, the percentage of people with <=1 close friend has nearly tripled to 20% of the population. The percentage of people who report 10+ close friends has dropped from 40% to 15%.
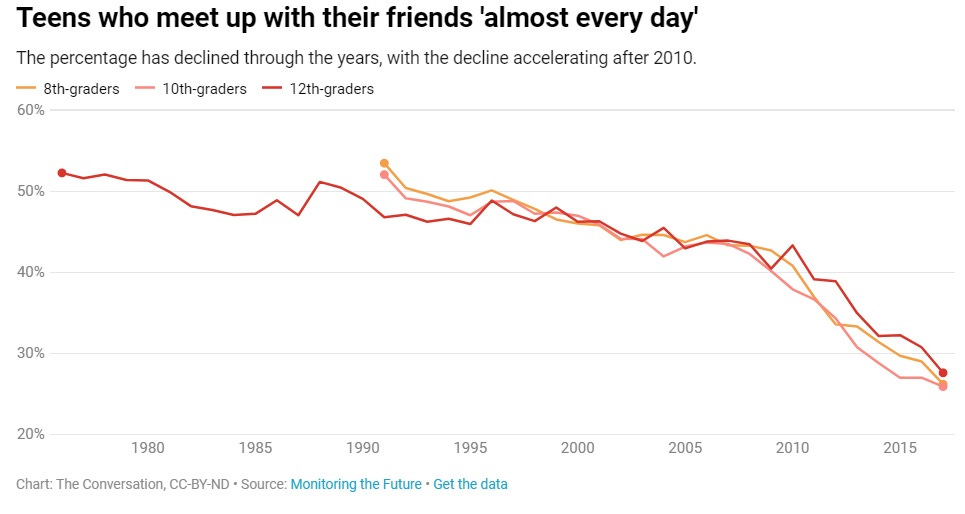
Jean Twenge has also charted social isolation among teens. Again, alongside the rise of smartphones and social media, in-person interaction falls off a cliff.
I saw a TikTok last week from a woman who was devastated because of the 100 people who had RSVP’d “yes” to her wedding, fewer than 40 showed up. She ended up shortening her ceremony and cancelling her reception. It was hard to watch.
Technology is a double-edged sword: it expands our social circles by connecting us with likeminded people we would never otherwise meet. But, uncontrolled, it can also subsume offline interactions, whose richness can’t be replicated digitally. I expect that in 20 or 30 years, we’ll look back at the early days of social media and be aghast at how we let it absorb of our time and crowd out true human connection.
One possible saving grace? An increase in multigenerational households. In the 1970s, only 7% of Americans lived in a multigenerational house (defined as two or more generations under one roof); in 2021, that figure was up to 1 in 5 Americans.

This is accelerated by COVID, but also the result of longer-term trends like growing income inequality and ballooning student debt. The silver lining: of those living in multigenerational households, 54% say it’s rewarding and 23% say it’s stressful.
Over the past few generations, America has seen a sharp decline in church membership and memberships to “third places” like community centers. Household sizes are declining, with a growing share of Americans living alone. This has coincided with the rise of the internet—we may have more loose social connections than ever before (we keep up with the Joneses through Facebook and Instagram), but we have fewer deep social bonds. One of the challenges this generation faces is reversing course, better using technology to augment human connection without outright replacing it.
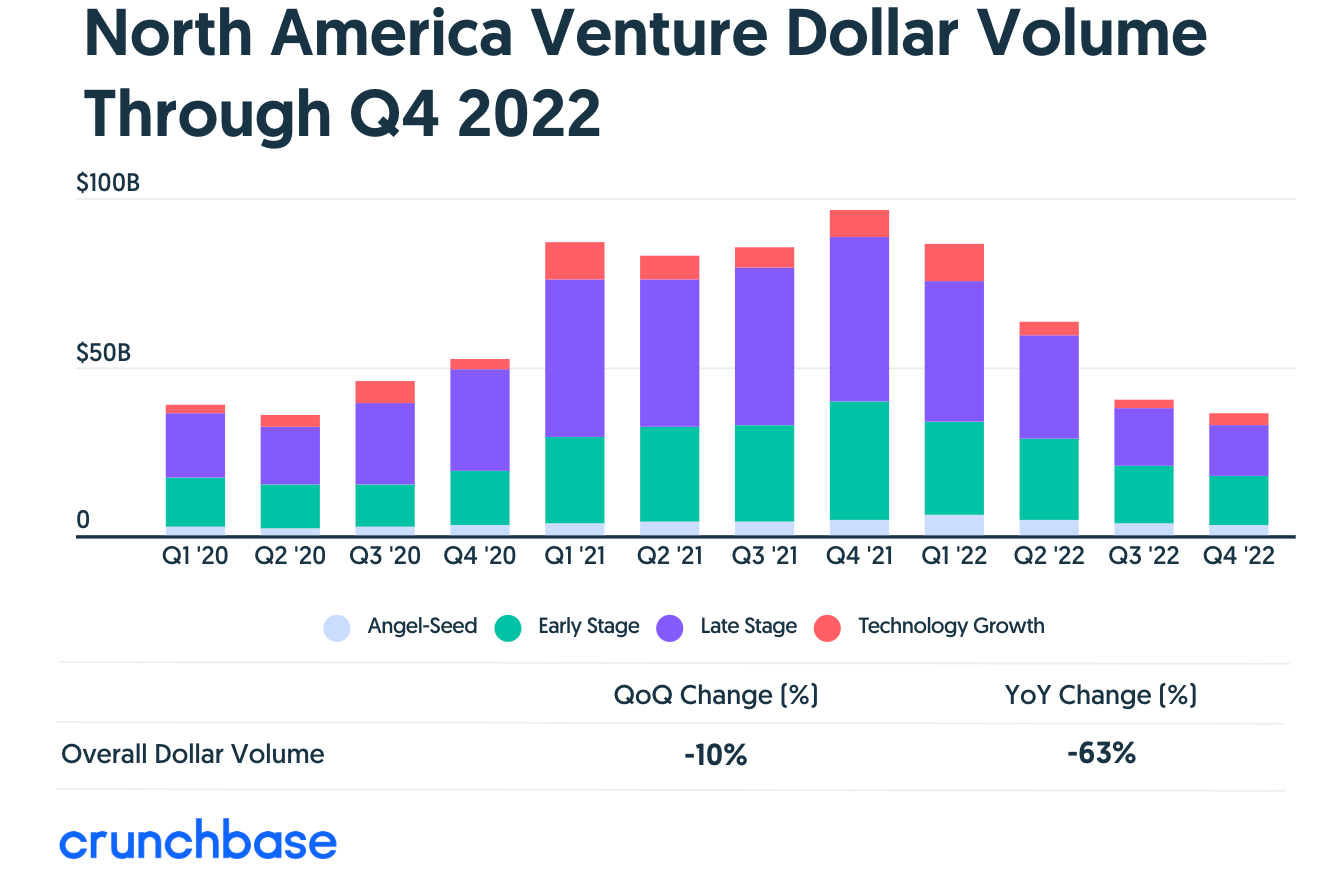
3️⃣ The Tech Bubble Has Burst
Over the past few quarters, the tech sector has gone through a brutal correction. Low interest rates and COVID-era money printing powered a bubble in venture capital funding and startup valuations. Companies over-fundraised and over-hired, and now, as interest rates rise, they’re finding themselves ahead of their skis. (Rising interest rates will always punish tech stocks, as tech stocks are highly dependent on future cash flows discounted to the present.)
Elad Gil had an excellent piece on the startup reckoning, arguing that we’re about to see many startups shut down. As he puts it: “Multiples in the COVID era were the anomaly, not the 14 years prior. We are not going back to 2020-2021 valuation multiples (or anything close to it) until the next bubble.”
Take a look at this chart and tell me which years look out of place:
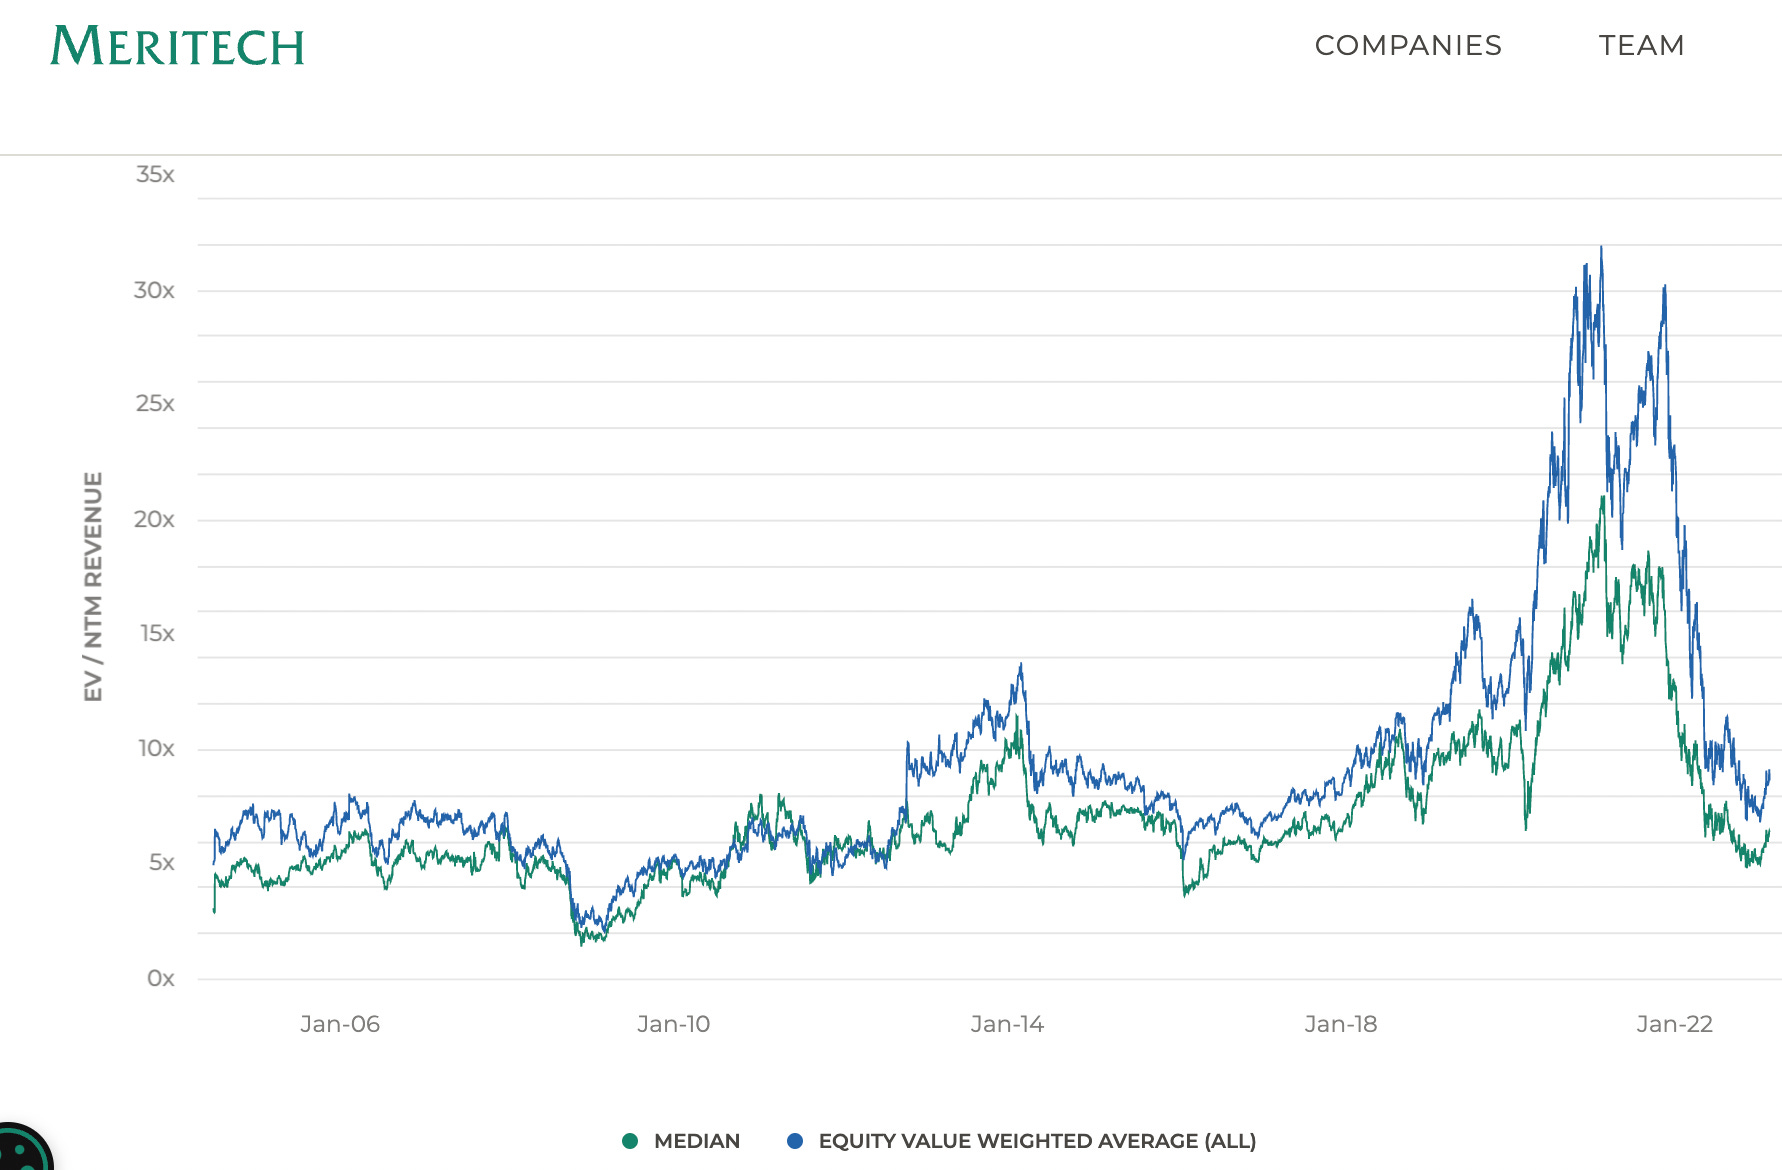
In 2021, it wasn’t uncommon to see startups raising at 50x or even 100x ARR multiples. Many companies will struggle to grow into those valuations. As Gil points out, a company that raised at 50X ARR will take 9 years growing 20% a year to just grow into its current valuation (assuming a 10X exit multiple). A company that raised at 100x ARR would take 6-7 years, growing 85% year-over-year, to grow into that last round price. That’s to say nothing of being a 2-3x step-up in valuation for the next fundraise.
My partner Mark Goldberg shares this cautionary tale from his time at Dropbox:
Many startups will never again be worth as much as they were worth in 2021.
Gil’s piece is worth reading for his forecasting of what will happen next. Several startups have already raised at lower valuations in order to reset prices for their employees or to amass more capital during a difficult macro environment: Instacart is rumored to have repriced from $39B to $10B; Stripe is reportedly raising at $50B, down from $95B in 2021; Klarna saw its valuation drop 85% from $45B to $6.7B. These corrections make sense, as public company peers are down 70%+.
Other companies won’t be able to fundraise when they run out of cash from their last round, and they’ll likely shut down or look to be acquired.
But it’s not bad news for everyone: the best companies will persevere through this time and will eventually thrive. People forget that Facebook did a down round and that Square IPO’d under its last private round valuation of $6B (it’s now trading at $50B).
The companies with best-in-class products, efficient growth channels, and long-term competitive differentiation will be fine. To quote Benjamin Graham, “In the short run, the market is a voting machine, but in the long run, it is a weighing machine.”
4️⃣ Climate Tech Defies the Downturn
One sector that’s defied the venture downturn: climate tech.
In 2021, venture funding into climate technology swelled to a record $37B, +64% over 2020. And last year, as the broader funding market cooled, that growth actually accelerated: according to HolonIQ, climate tech startups raised $70.1B in 2022, +89% year-over-year.
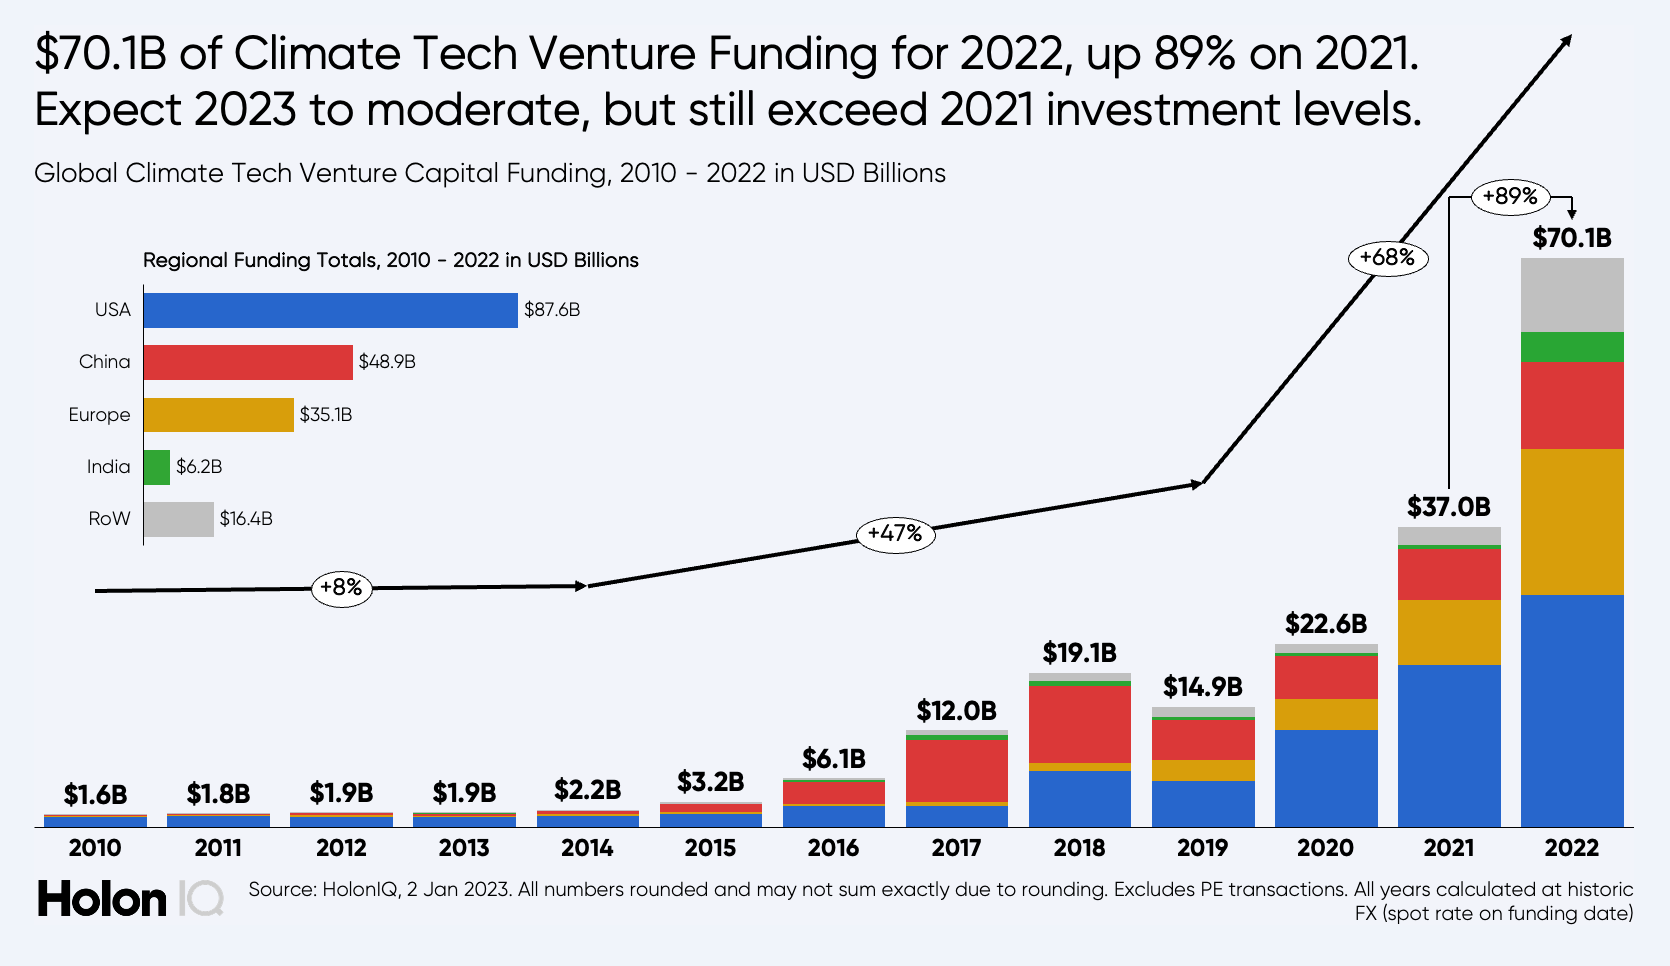
PWC reported that $1 in every $4 of venture capital funding last year went into climate tech.
That report also included the interesting insight that more funding is going toward the dirtiest sectors. In 2021, climate tech startups focused on the sectors responsible for 85% of emissions (think oil and gas) attracted just 39% of investment; in 2022, that was up to 52%.
I see this trend continuing. Many of the buzziest climate startups, like Watershed, began with a focus on technology companies: Watershed, led by Stripe alumni, served early customers like Shopify, Airbnb, and DoorDash. But there are exciting, lesser-known startups focused on cleaning up the most polluting sectors: Iconic Air, for instance, offers carbon accounting (similar to Watershed) for energy intensive sectors—oil & gas, utilities, manufacturing; and Sylvera, a company we work with at Index, offers carbon ratings to “dirty” companies like Chevron and Delta Airlines. Over time, technology solutions will flow to the parts of the economy that need them most.
5️⃣ ChatGPT Adoption & Exponential AI
ChatGPT is among the fastest-growing products in history.
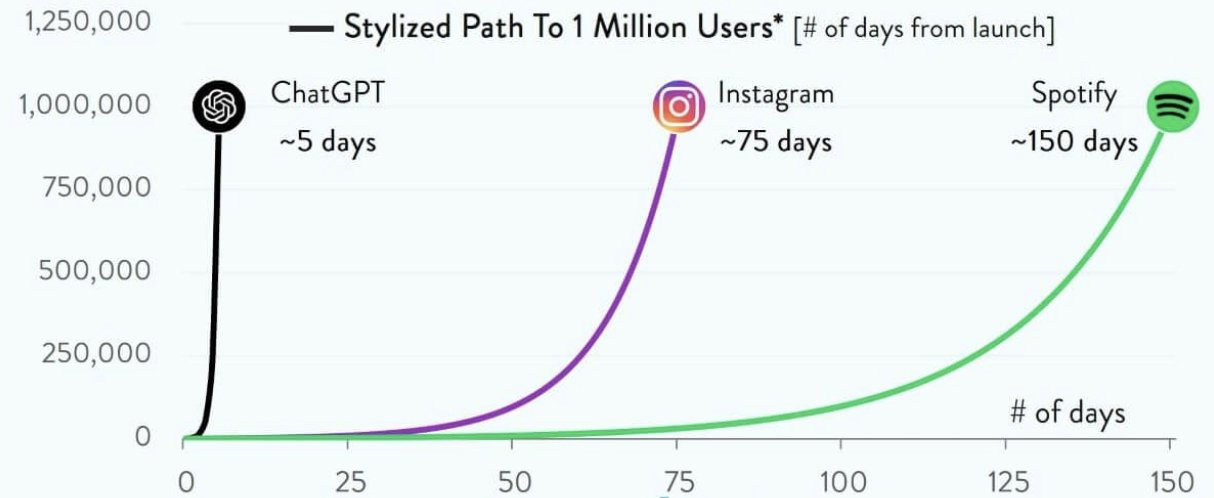
Here’s another view, tracking time (in months) to 100M users.
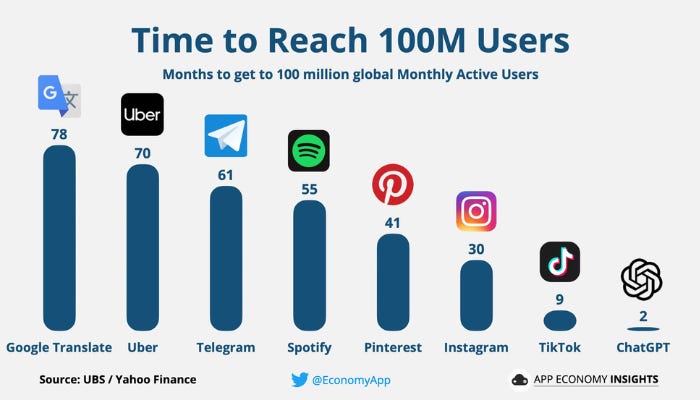
These charts might not be perfectly accurate—user numbers might be measured differently—but the charts are directional. ChatGPT is a certified phenomenon. One study last week found that more teachers than students are using ChatGPT: 51% of teachers report using ChatGPT (primarily for lesson plans), with 40% using it weekly; 22% of students report using ChatGPT weekly. Across all users, ChatGPT seems to have 25-30% weekly active user numbers. This strikes me as low for such a groundbreaking innovation, but that’s likely due to how the technology is delivered; as more products with existing distribution integrate ChatGPT, that figure should grow.
And more tech companies areintegrating ChatGPT, with ChatGPT now available as an API. Snap, which just announced that it hit 750 million monthly actives (12 years after its founding), is offering ChatGPT through its “My AI” chatbot, initially available only to paying Snapchat Plus subscribers.

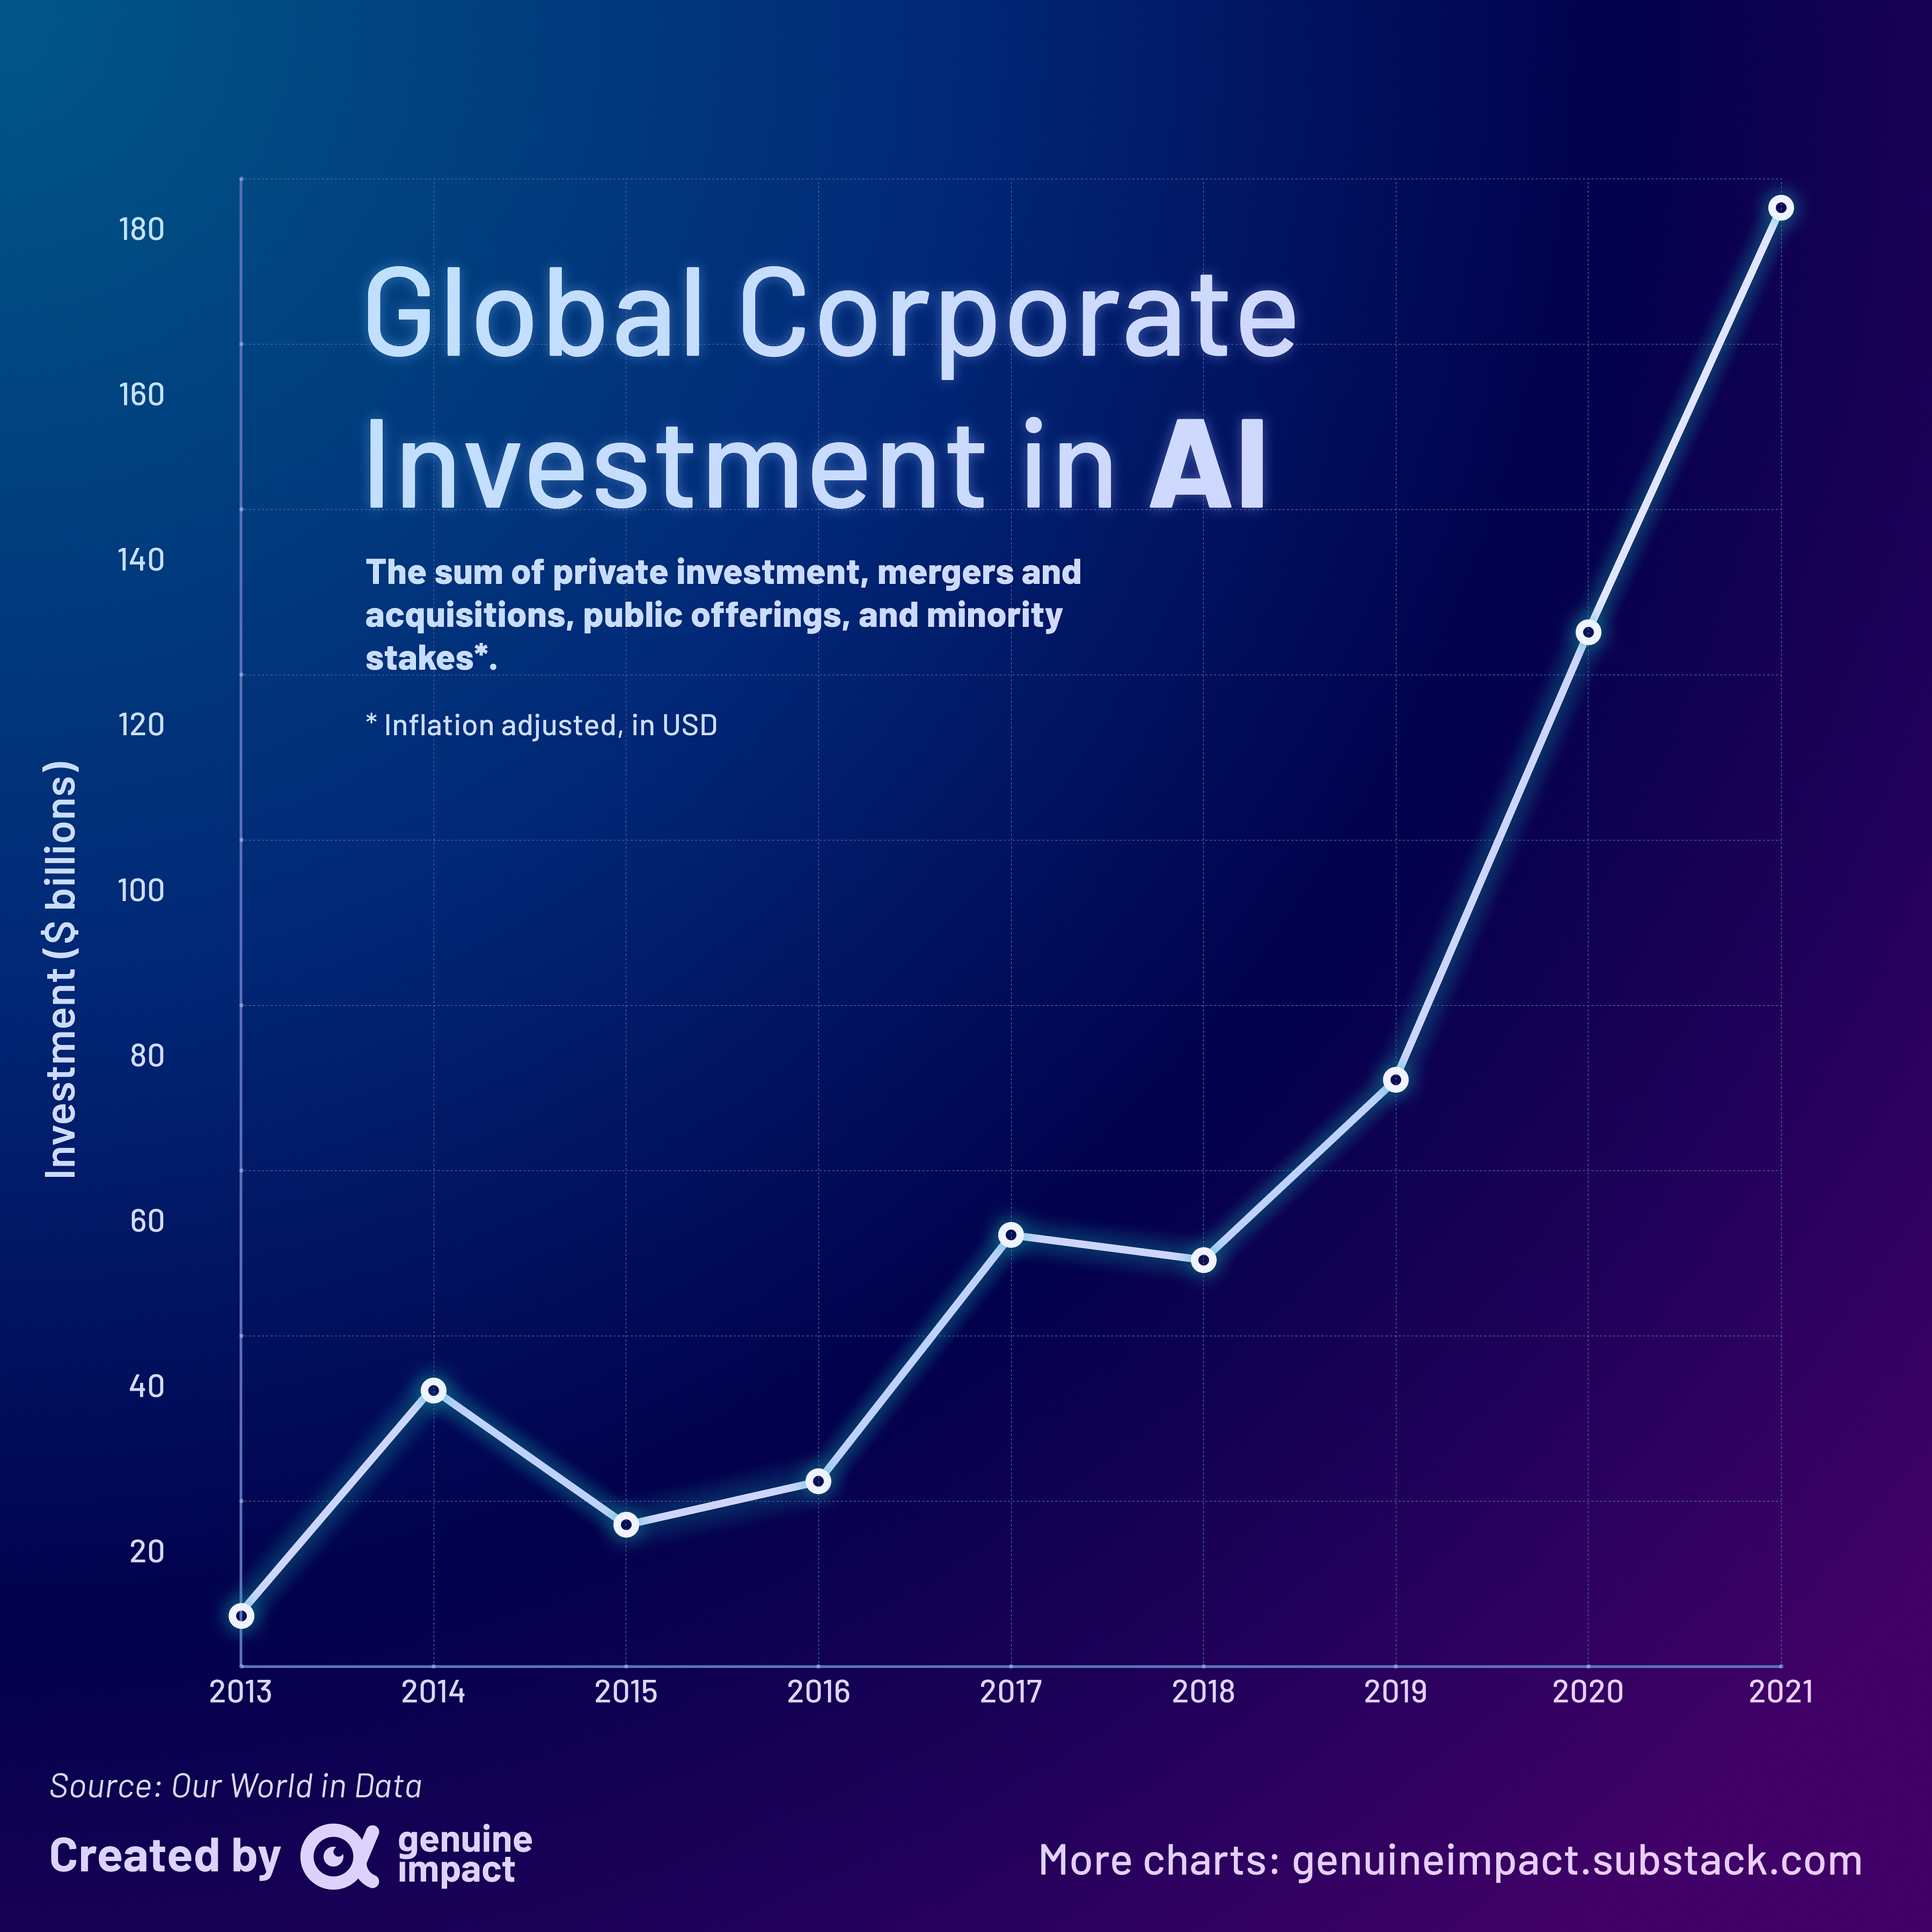
Instacart and Shopify are also using ChatGPT in their products. TikTok’s Bold Glamour feature, mentioned earlier, is also built with AI (though not ChatGPT, of course). Across the economy, corporate investment in AI is exploding.
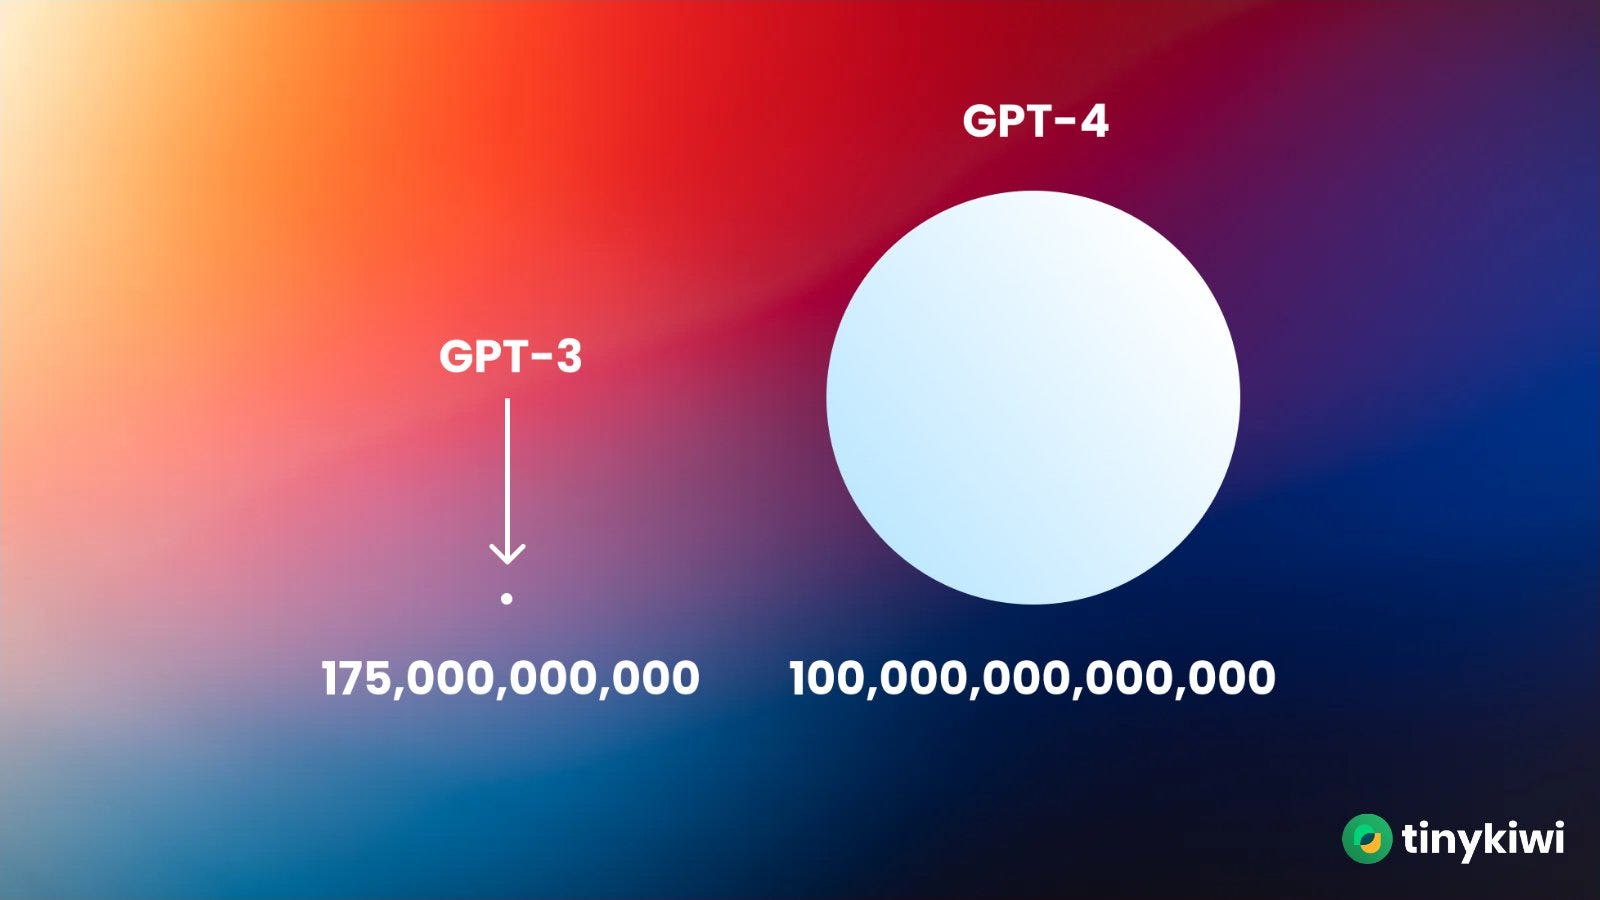
AI is also improving at an exponential rate. While GPT-3 has 175 billion parameters, GPT-4 is now expected to have 100 trillion parameters—roughly 500x its predecessor.
Larger models are, of course, much more expensive to train. Training a model with hundreds of billions of parameters can cost several million dollars. Having that model stay up-to-date (ChatGPT often surfaces outdated information, or doesn’t know current events) means that you have to re-train the model on a regular basis. Only a few companies will have the resources to maintain these models (this is why OpenAI is backed by Microsoft), and our view at Index is that Foundation Models will evolve in a similar fashion as large cloud providers like AWS and Azure—underlying infrastructure provided by a handful of players, upon which other companies build.
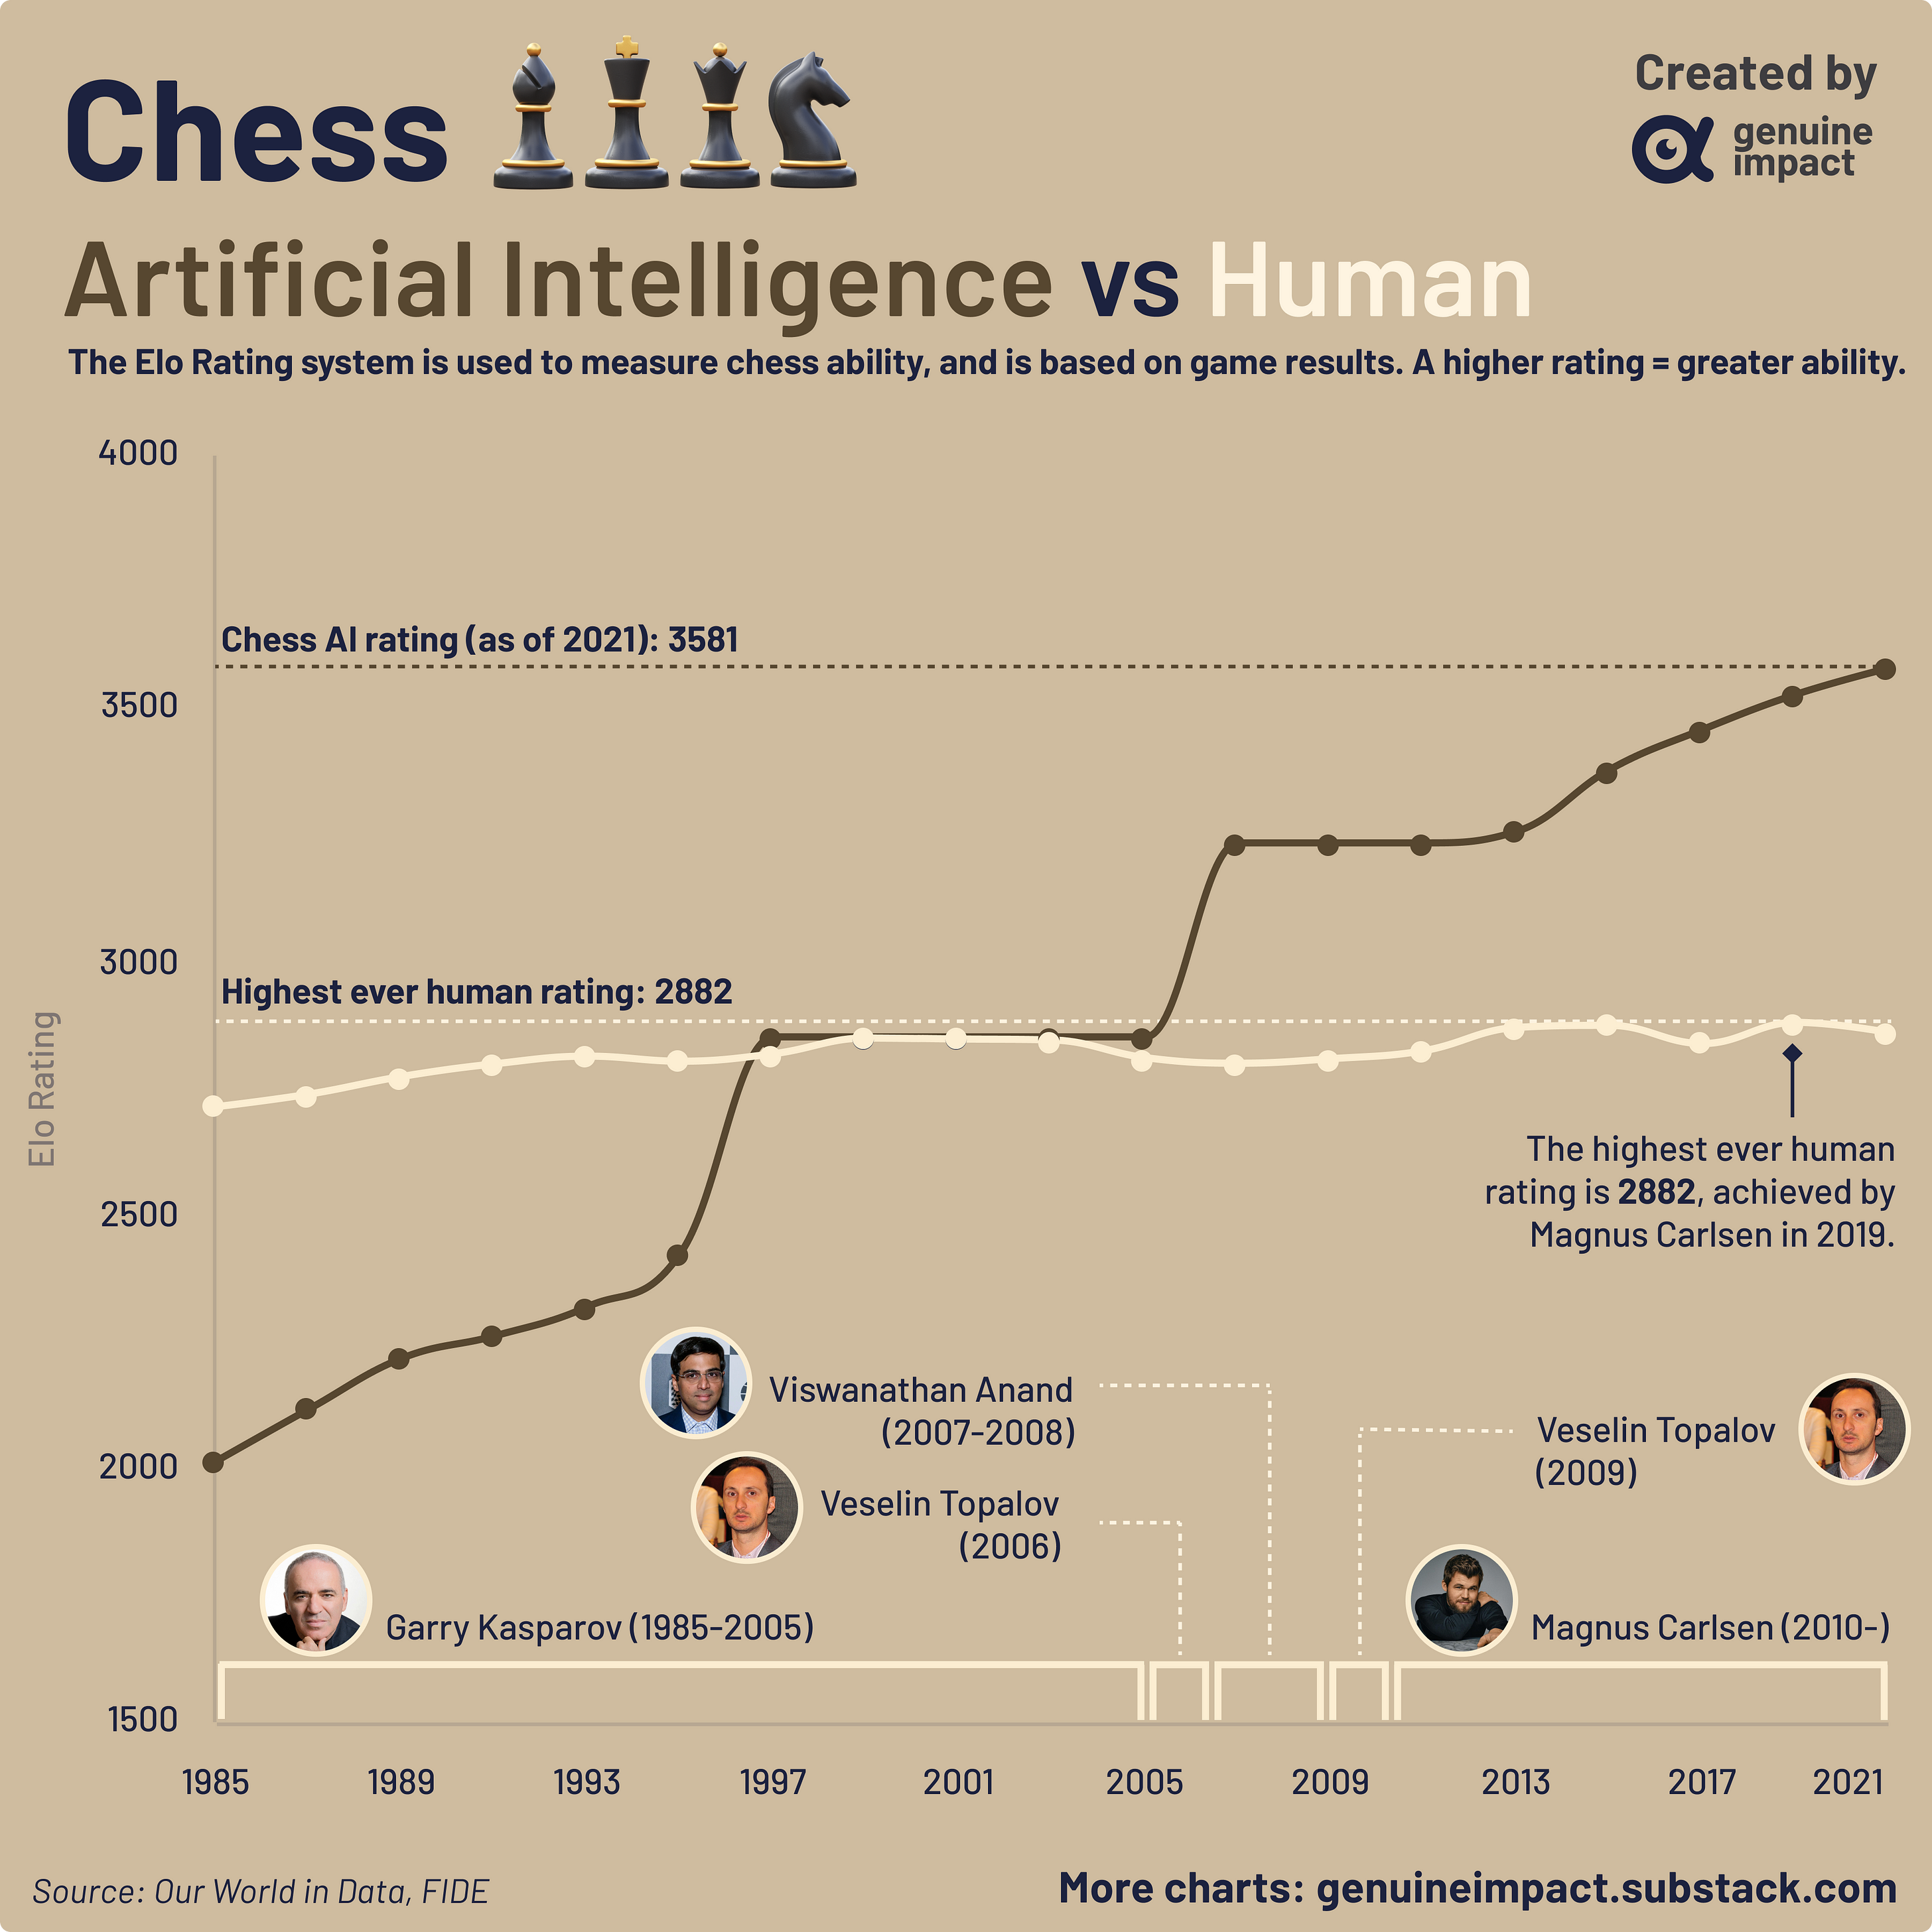
AI has been improving rapidly for years—
It’s been interesting to see the world react to ChatGPT and Bing. AI is officially mainstream, and adoption will accelerate as more platforms integrate AI into their existing products.
6️⃣ The Market for Obesity Drugs
Obesity treatment drugs (also called GLP-1 agonists) are all the rage right now. Last year, there was speculation that Kim Kardashian used Ozempic to fit into Marilyn Monroe’s dress at the Met Gala. Headlines have declared the drugs “Hollywood’s weight loss secret” and people have scrambled to get their hands on them. But the drugs can take a toll on you: The Cut’s piece You May Go Through Hell for Your Post-Ozempic Body is chilling.
Consumer demand for obesity drugs is massive. If insurance doesn’t cover the drugs (they may cost you $1,000+ per month out of pocket), the drugs will only be accessible to the rich. The outcome here is dystopian: a society of thin, healthy rich people and obese lower-income people. But if studies show that the drugs improve cardiovascular health, they’ll be covered by insurance and thus more accessible. The jury’s out.
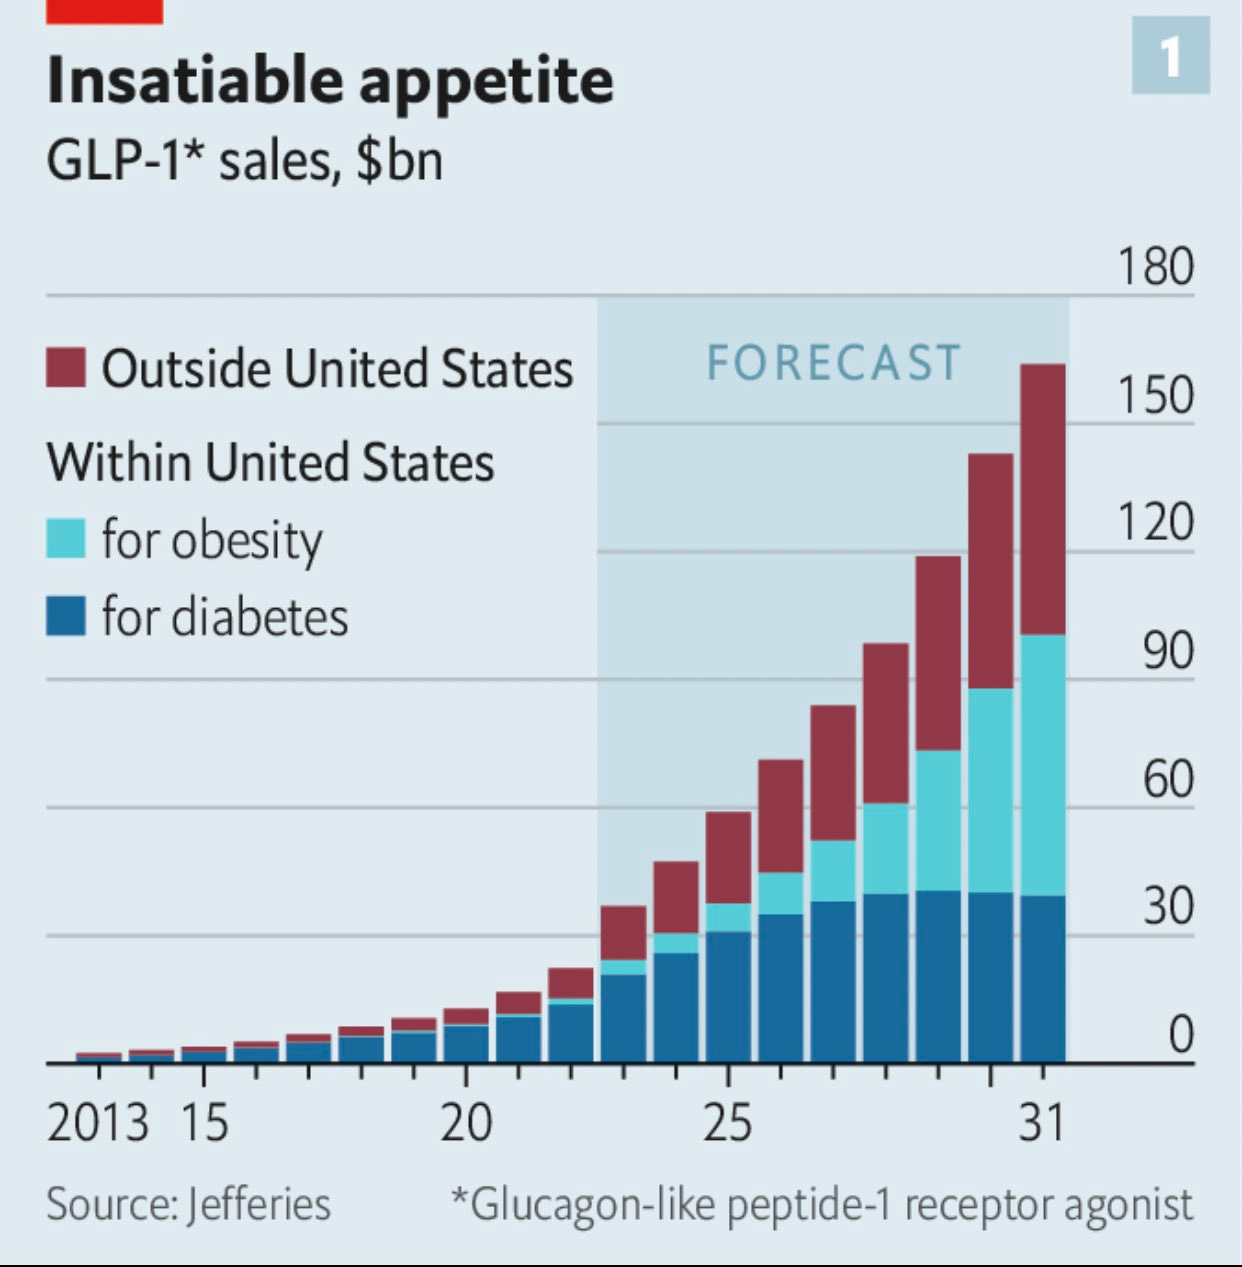
The Economist estimates that by 2031, the market for GLP-1 drugs will be over $150B. For perspective, that’s on par with the market size of all the drugs used to treat cancer ($185B in 2021). I expect there will be various opportunities here for enterprising entrepreneurs—the drug companies will win, sure, but there will also be ecosystems of “Ozempic influencers” and “Wegovy coaches” and online managed marketplaces for access to weight loss drugs.
7️⃣ Temu’s Explosion
Last week in The Retail Revolution, I wrote about the rise of discount retail: the top six retailers opening stores in 2022 were all dollar chains and discounters, led by Dollar General, Family Dollar, and Dollar Tree. In 2021, nearly 1 in 3 new chain stores opened in the U.S. was a Dollar General.
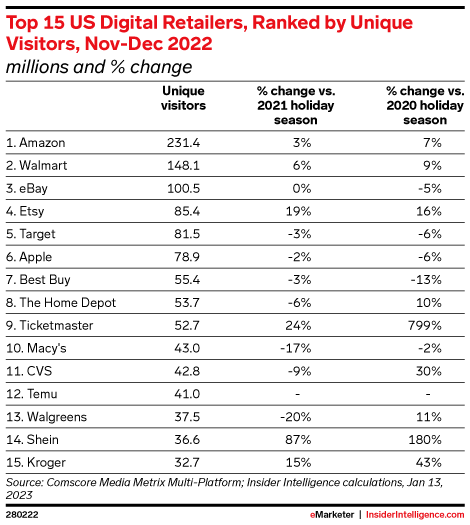
The startup equivalent is Temu, effectively an online dollar store, owned by the Chinese e-commerce giant Pinduoduo. In December, just four months after launching, Temu had more unique visitors than SHEIN and Wish.
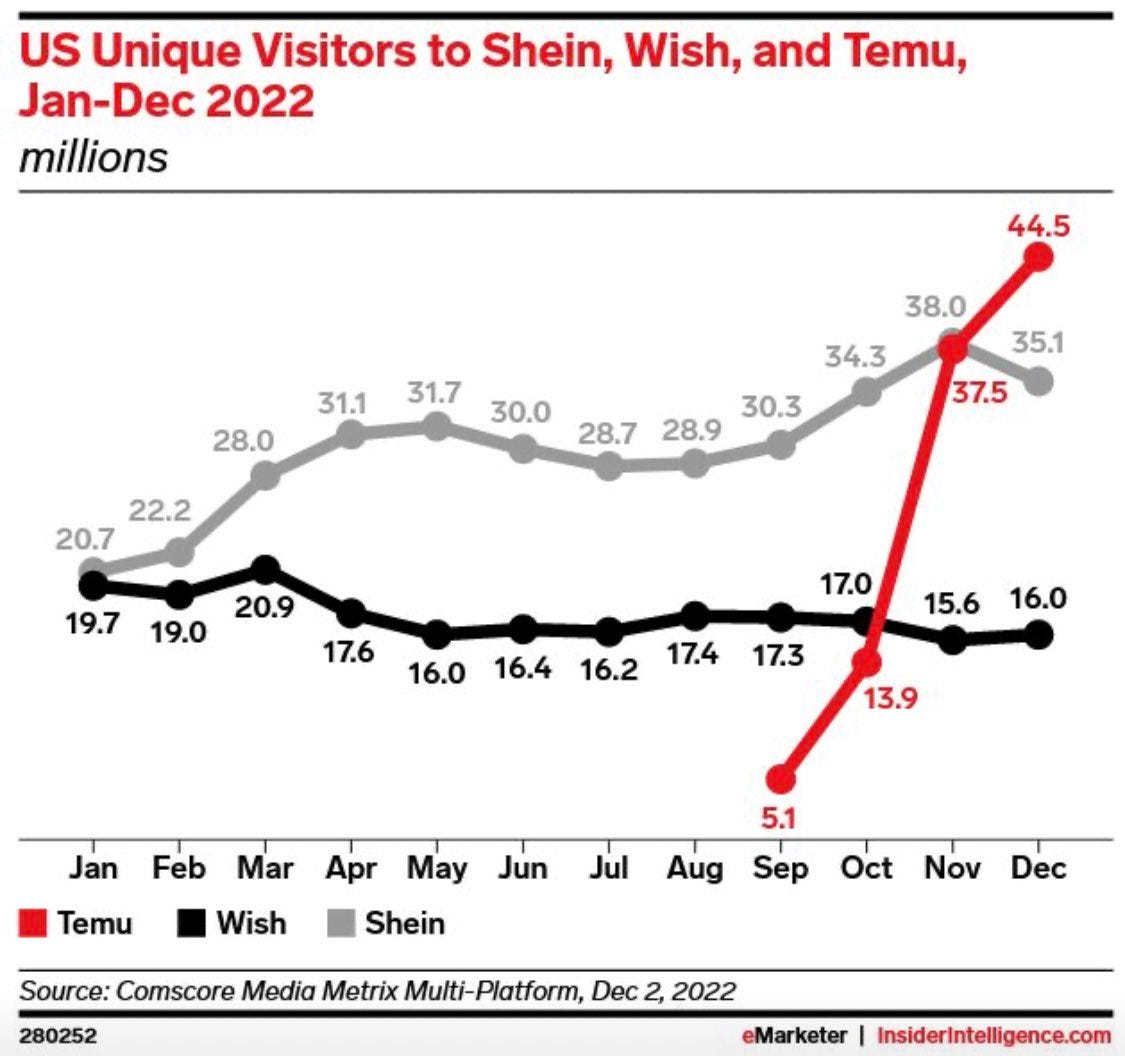
eMarketer reported that during the holiday shopping season, Temu ranked 12th in traffic among US retailers, wedged between CVS (#11) and Walgreens (#12). Temu came in ahead of major retail sites like Nordstrom, Wayfair, and Kohl’s.
Pinduoduo is following the Bytedance playbook of spending aggressively on user acquisition to win the U.S. market. Part of that plan included not one, but two Super Bowl commercials (costing $7M apiece). The strategy seems to have worked: Temu saw a 45% surge in downloads and a 20% uptick in daily active users on the day of the Super Bowl. As of this writing, Temu sits at #1 in the App Store within the Shopping category, and #2 overall, behind Bytedance-owned CapCut (#1), but ahead of Bytedance-owned TikTok (#3). The top three apps are all owned by Chinese internet giants.
The question for Temu is whether it can 1) keep momentum, and 2) make its unit economics work. It’s hard to profit on shipping a bunch of $1 items from China to America. But early data is promising: spend retention on early Temu cohorts shows that shoppers spend ~50% of initial month GMV in their second and third months. For SHEIN, that figure is closer to 20%.
8️⃣ Duolingo’s Inflection Point
In mid-2018, Duolingo daily active user growth had slowed to a crawl: DAUs were growing at just a single-digit rate year-over-year. Then, things changed. Starting in 2018, user growth reignited, and DAUs grew 4.5x over the next four years.
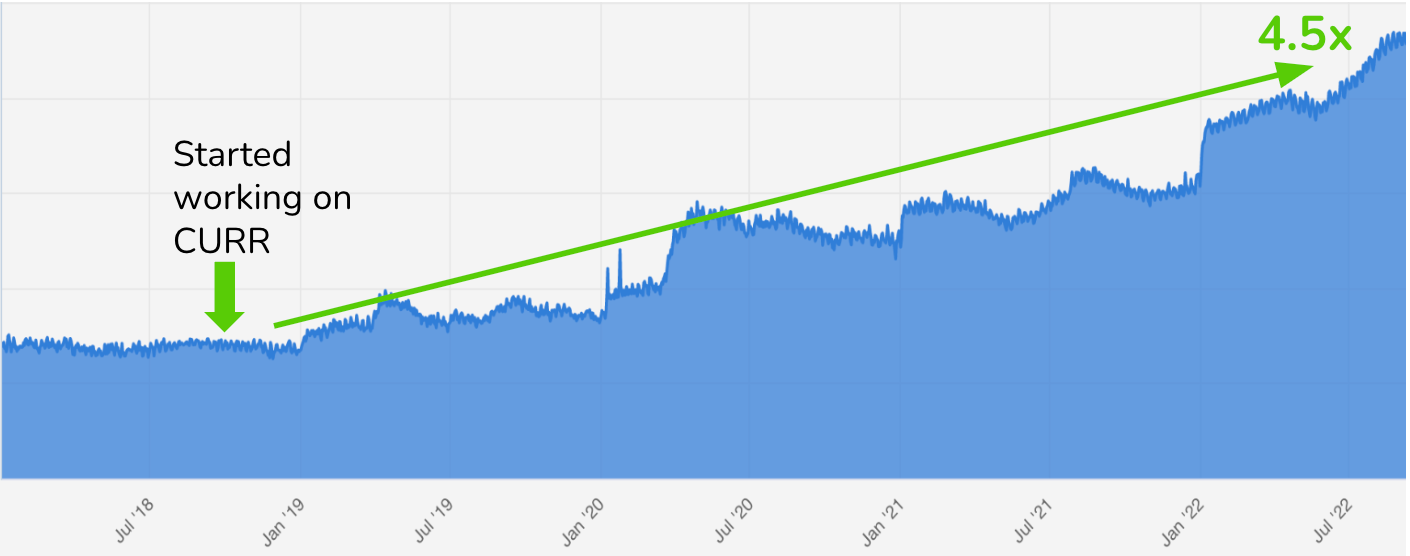
What happened?
Jorge Mazal, the former CPO of Duolingo, wrote a terrific feature in Lenny’s Newsletter about how Duolingo reignited user growth. I found it a fascinating case study in how relentless, data-driven testing and product innovation can meaningfully improve metrics.
In short, Mazal and his team drew on past experiences to test, implement, and scale new features. Three examples:
Leaderboards: At Zynga, Mazal had seen the power of leaderboards through which users could compare themselves to others. Duolingo had leaderboards, but they were limited to friends. The team broadened leaderboards and introduced leagues, which played into the human motivators of competitiveness and progression. Almost immediately, overall learning time increased by 17% and the number of highly-engaged learners (users who spend at least 1 hour a day for 5 days a week) tripled.
Notifications: The Duolingo team revamped notifications, sending better notifications but not necessarily more. Groupon’s founder warned Duolingo of the perils of too many notifications: Groupon saw massive benefits as it increased emails to customers, until it was sending up to five a day. What happened then is that customers opted out of emails, and Groupon never got them back—even after they stopped A/B testing. They’d gone too far. So Duolingo didn’t increase quantity of notifications, but improved quality by optimizing timing, images, copy, and localization.
Streaks: Mazal and his team revamped Streaks, which increase user motivation over time—the longer the streak, the greater the impetus to keep the streak going. That directly improved user retention, which improves growth in daily actives.

Duolingo is an interesting case study in non-stop product innovation and A/B testing breathing new life into a company that had plateaued. There are a lot of lessons for other startups looking to reignite growth.
9️⃣ National Office Occupancy
When people talk about the early weeks of the pandemic, they often trot out a Vladimir Lenin quote:
“There are decades where nothing happens, and there are weeks where decades happen.”
Overnight in March 2020, office occupancy plummeted from 100% to ~15%. Three years later (this coming Sunday marks the anniversary of the day Tom Hanks tested positive for COVID, which 50% of Americans say influenced their behavior), national office occupancy hasn’t recovered: right now, occupancy sits at 50%.
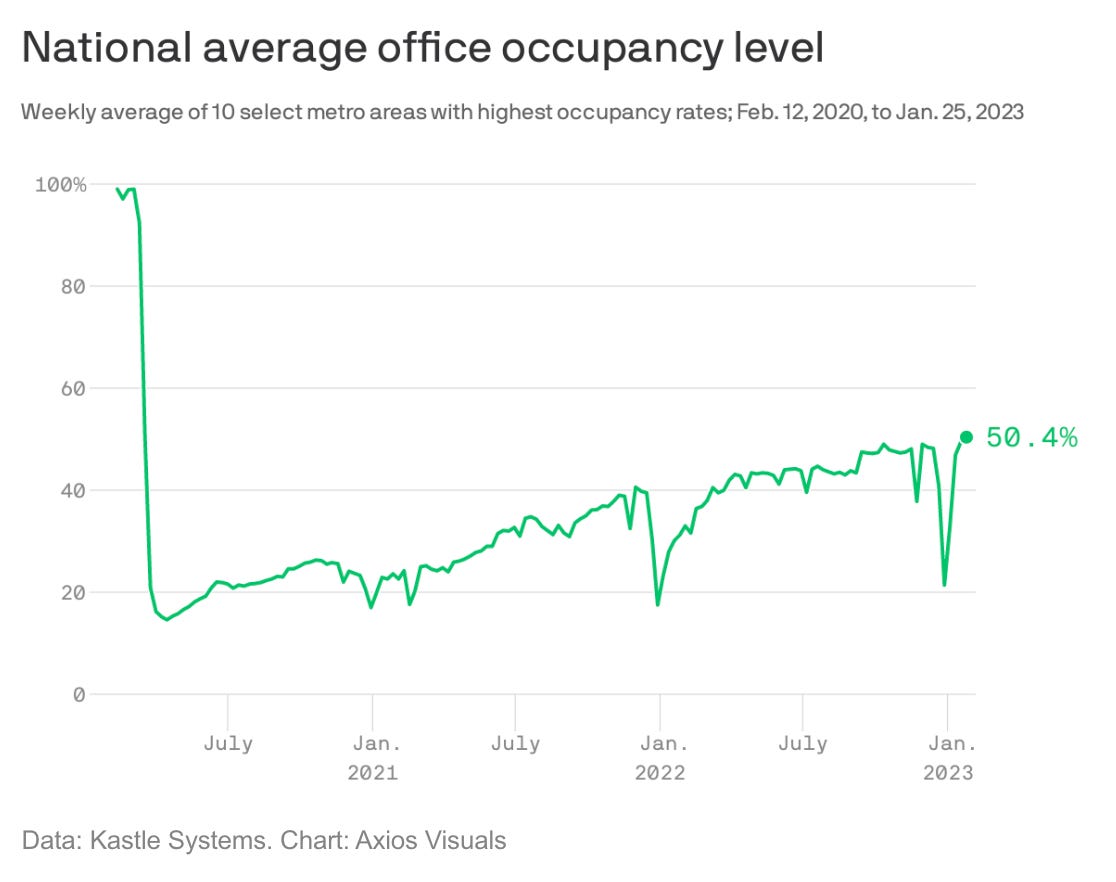
What are the ripple effects here? More people moving back home to live with their parents, as the earlier chart showed. More people moving out of blue-leaning cities into red-leaning suburban and rural districts (it will be interesting to see political impacts in upcoming elections). And with the unemployment rate at 3.4%, its lowest rate in 54 years, more leverage for workers that can demand remote and hybrid work.
We’re also seeing cities get a facelift. Washington D.C. is aggressively pursuing an office-to-residential pivot, with 2,500 new apartments being built by converting vacant office buildings.
There are startups building on this new reality. Codi, for instance, is an all-in-one platform that allows companies to spin up private, flexible office spaces. In a post-COVID world, it’s harder than ever for executive teams to forecast how many people will actually come into the office. Rather than being stuck with a long-term lease for a too-large or too-small space, companies can use Codi for short-term, turnkey work spaces.
My guess is that the chart above ultimately plateaus in the 50-60% range. This is the new normal.
🔟 Long-Term Technological Innovation
When you zoom out, most of human innovation has happened very, very recently. It took us a long time to figure out how to use tools; it took us another million years to learn how to control fire, and another million years on top of that to teach ourselves agriculture.
In just the last century, we’ve gotten penicillin (1928) and the computer (1943) and space travel (1957) and the internet (1983) and CRISPR gene editing (2012). I like this visualization from OurWorldInData:
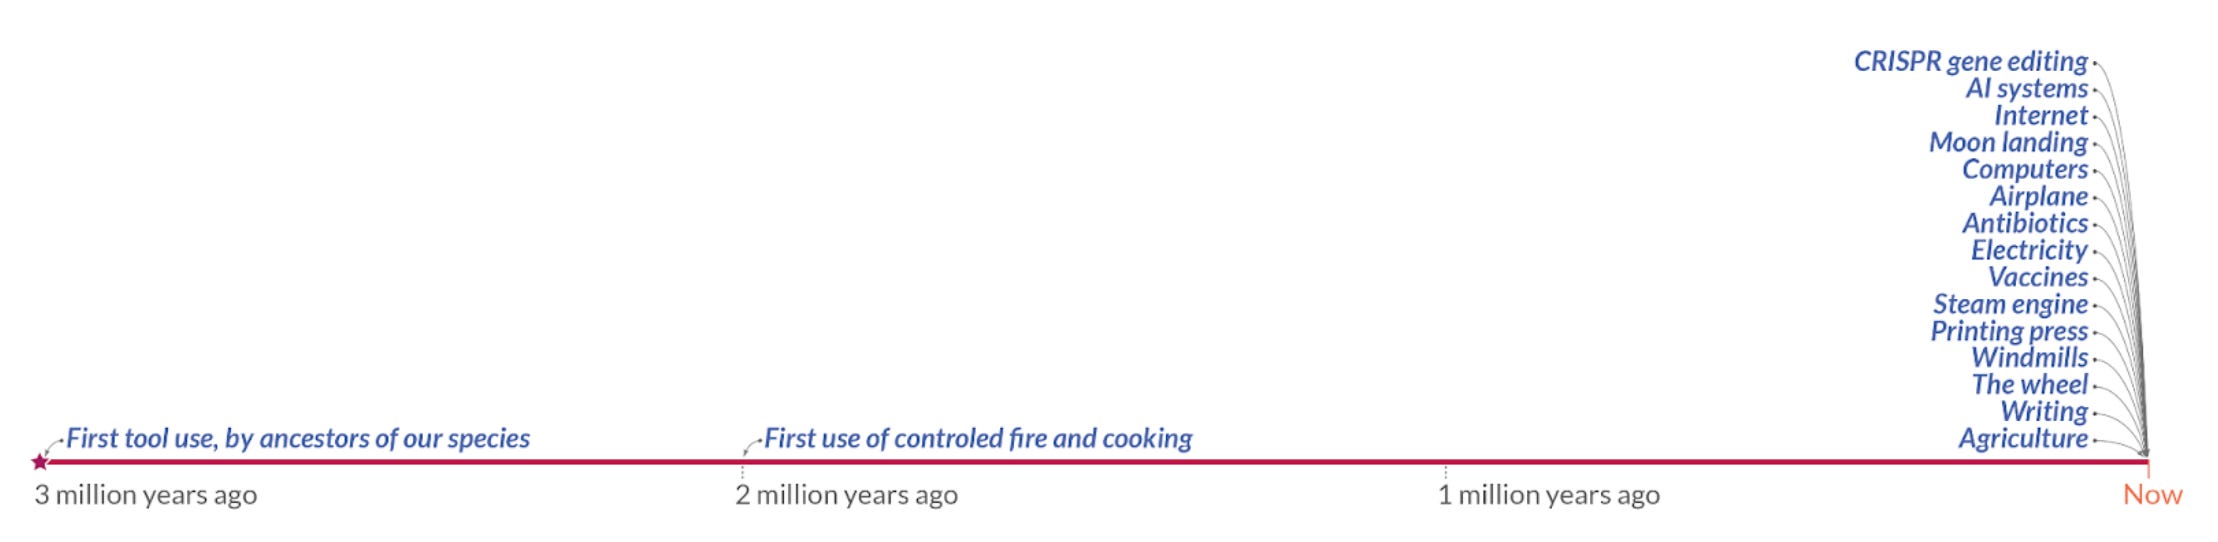
Impacts on quality of life are stunning: until 1870, human life expectancy was under 30 years; now, experts believe that today’s 5-year-olds will live to 100. Here’s a more detailed timeline of technology:
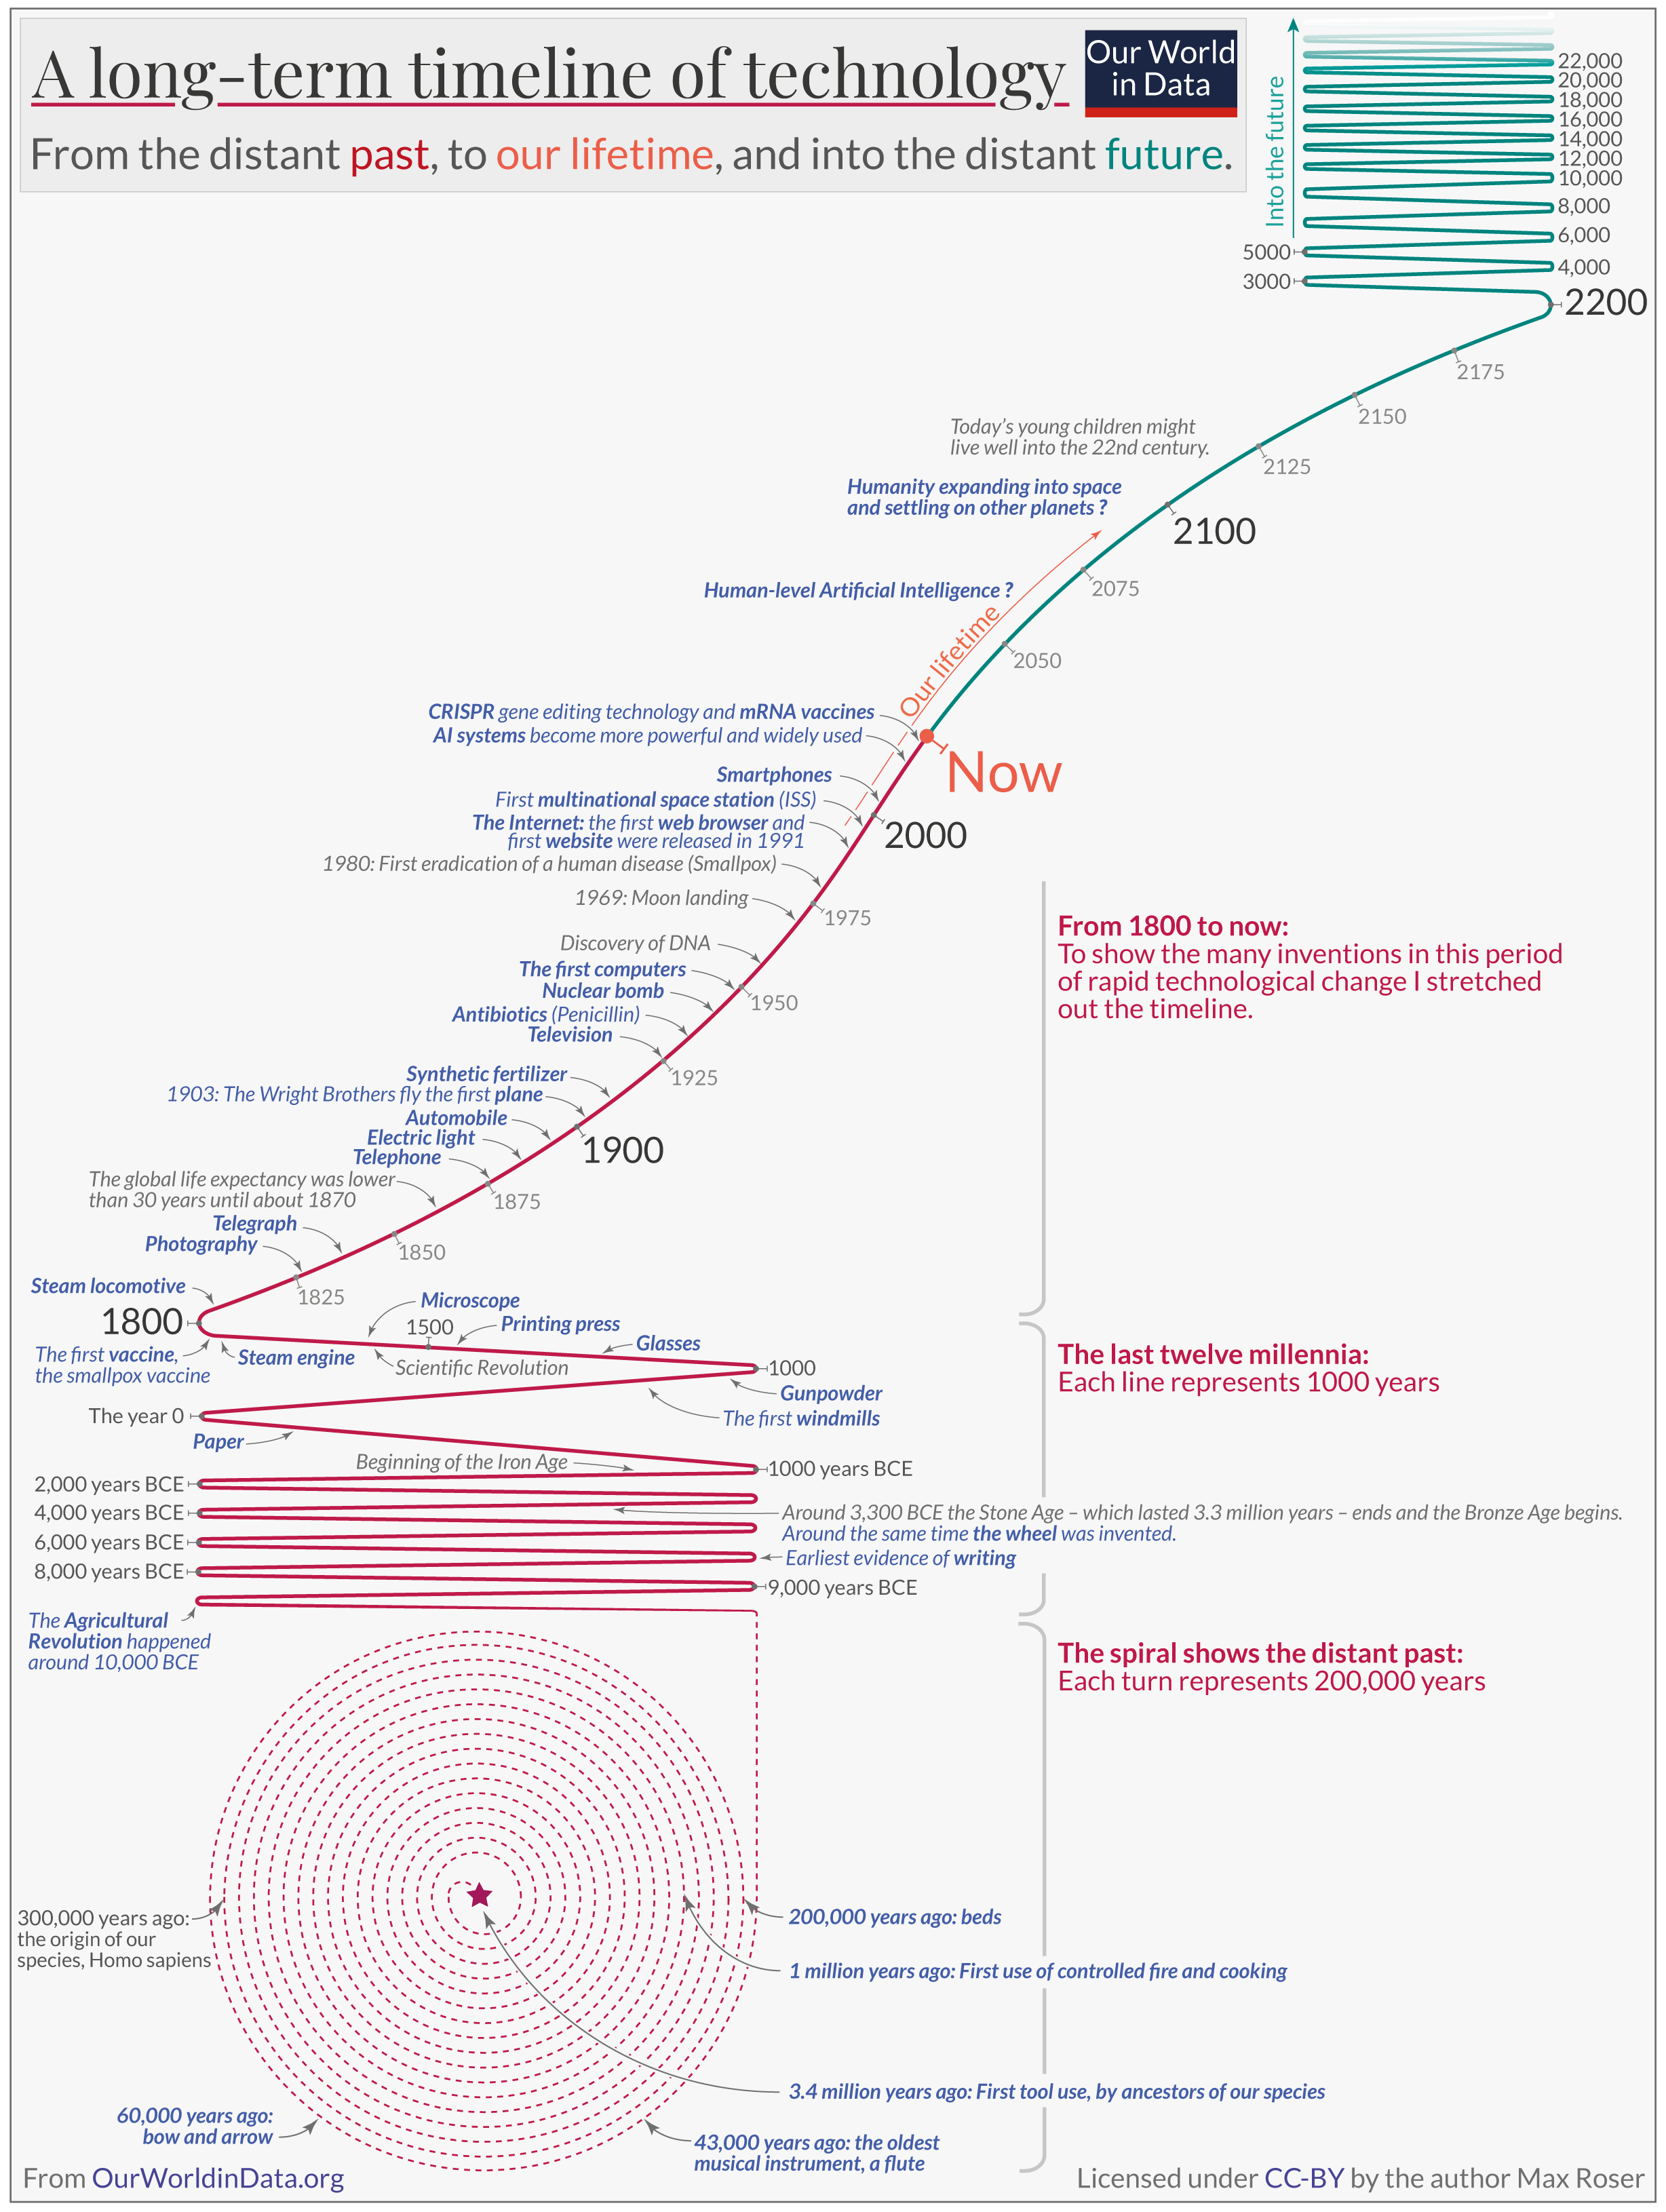
Technological innovation happens fast. I like to point to air travel as an example. The Wright Brothers took their first flight in 1903. That flight lasted 12 seconds, traveled 120 feet, and reached a top speed of 6.8 miles per hour.
Just 66 years later—less than a human lifetime—mankind put a man on the moon, some 239,000 miles from Earth. Also in 1969, Apollo 10 set the record for highest velocity reached by a crewed spacecraft: 24,791 miles per hour, a casual 3,646x multiple on the speed the Wright Brothers reached six decades earlier.
We’re living in a moment when human life is changing faster than ever before, with every day bringing new breakthrough innovations. It’s that fact that makes the charts in this piece so fascinating: on every dimension, the world is being transformed in front our eyes.
Final Thoughts
I’ll do another “10 charts” series later this spring. In the meantime, I’d love to see any charts that you’ve been struck by. You can reply to this email, or send me a DM on Twitter at @rex_woodbury.
Until next week 👋
Related Digital Native Pieces
Thanks for reading! Subscribe here to receive Digital Native in your inbox each week:
Recommend
About Joyk
Aggregate valuable and interesting links.
Joyk means Joy of geeK