

Status of Spring
source link: https://www.usanpn.org/news/spring
Go to the source link to view the article. You can view the picture content, updated content and better typesetting reading experience. If the link is broken, please click the button below to view the snapshot at that time.
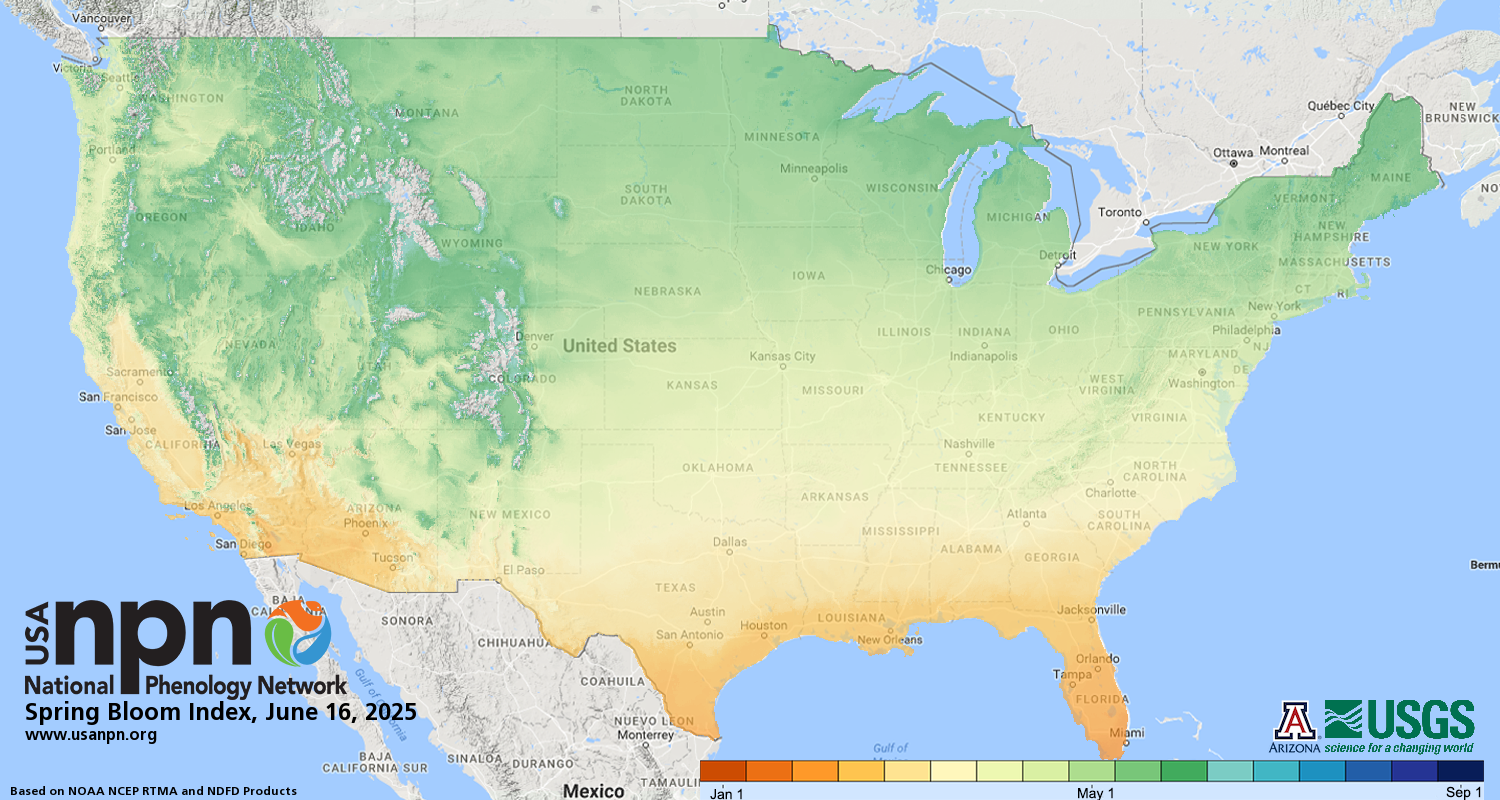
How do you know when spring has begun? Is it the appearance of the first tiny leaves on the trees, or the first crocus plants peeping through the snow? The First Leaf and First Bloom Indices are synthetic measures of these early season events in plants, based on recent temperature conditions. These models allow us to track the progression of spring onset across the country.
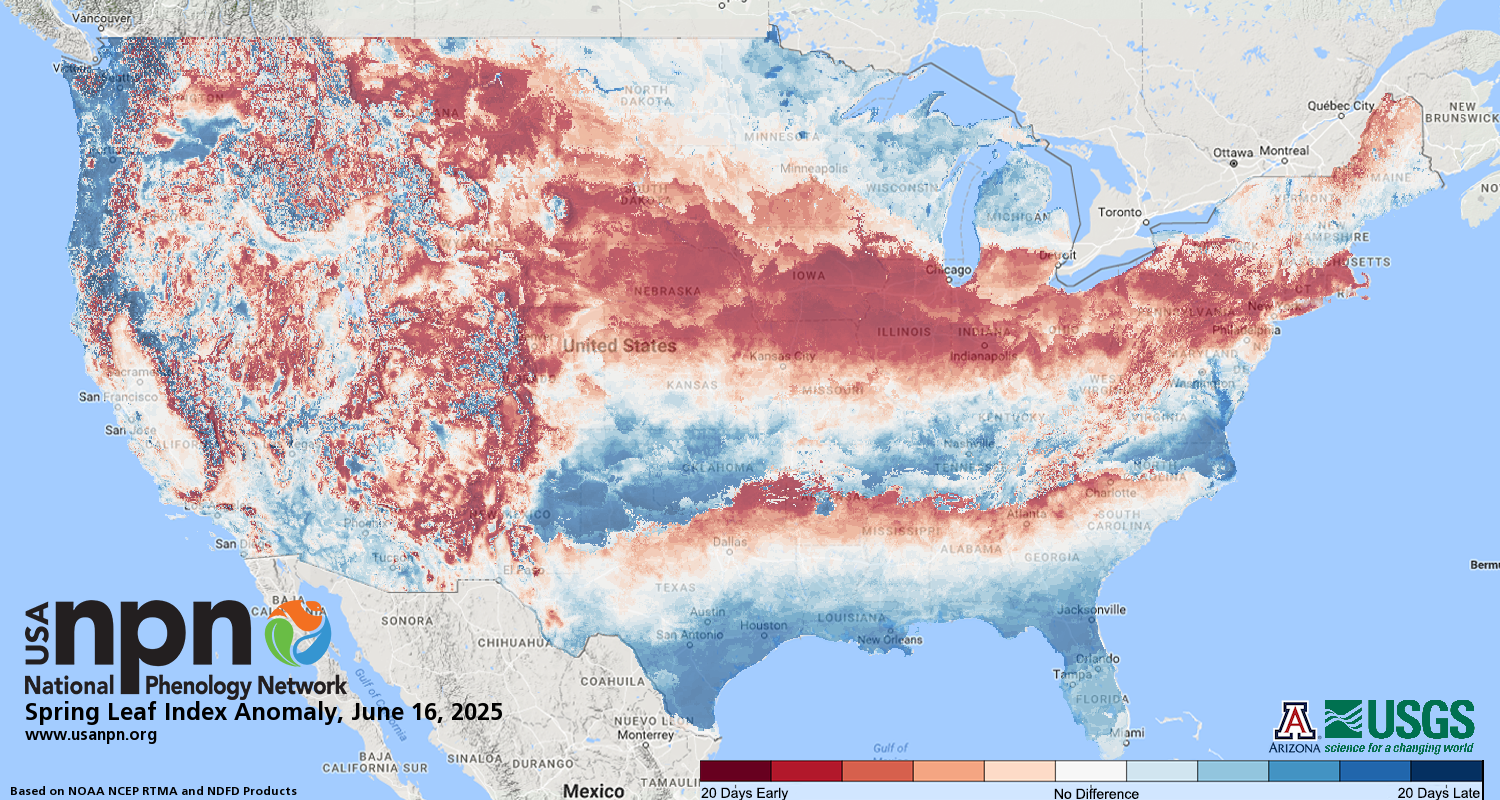
How does this spring compare to "normal"?

January 23, 2023
Spring leaf out conditions have arrived in southern states. Spring is up to three weeks earlier than average (the period of 1991-2020) in parts of Texas, Arkansas, Louisiana, Mississippi, Alabama, Georgia, and South Carolina. Austin, TX is 9 days early, Jackson, MS is 12 days early, and Charleston, SC is 10 days early. In central Florida, spring is 1-2 days later than average.
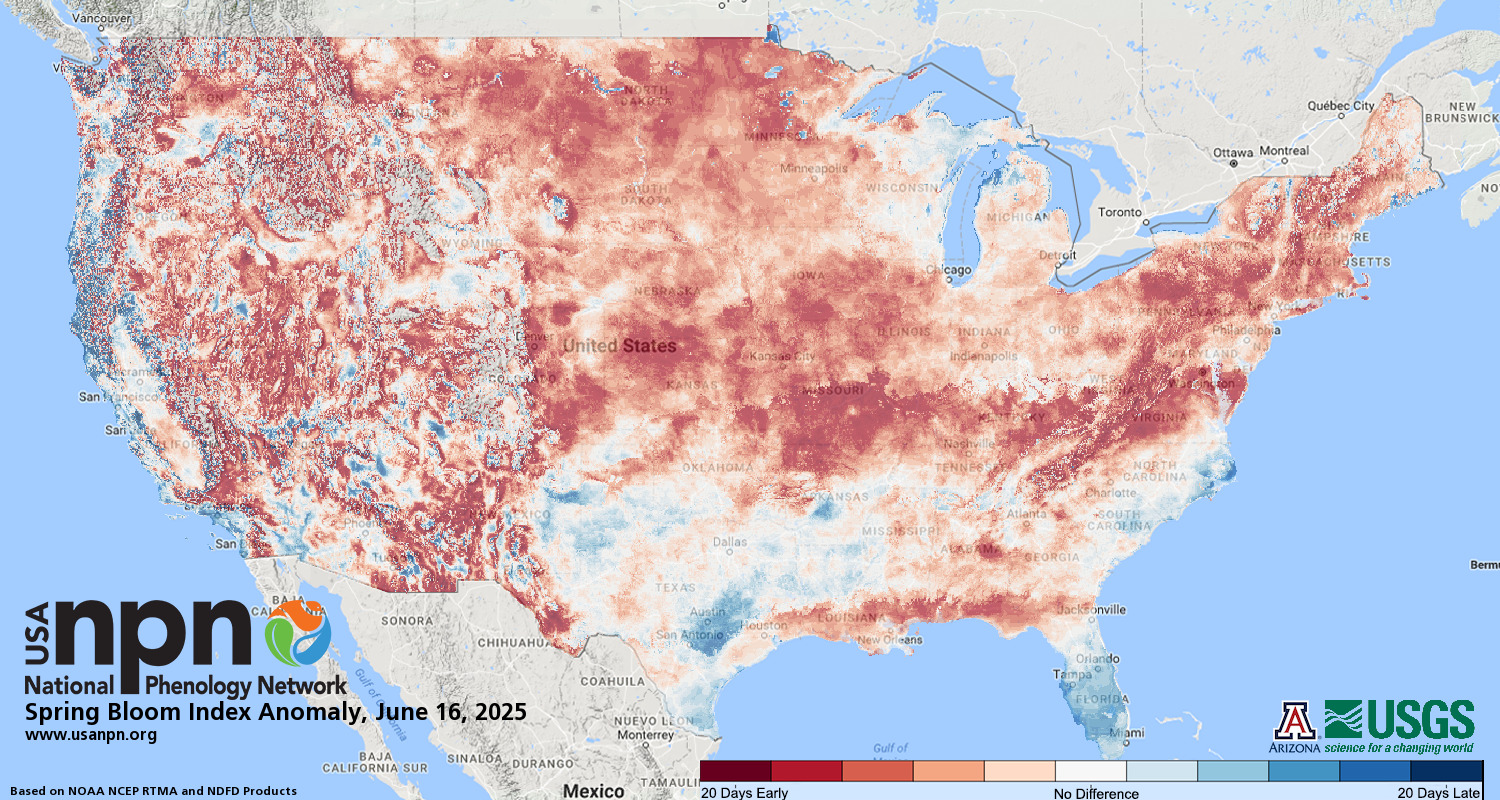
Spring bloom has also arrived in the southernmost parts of Texas and Florida. Spring bloom is 8-12 days early in Texas and on time to a few days early in Florida.
When will spring arrive at your location? Check back on this page, we will update it frequently as spring progresses across the country!
Download the maps in KML/KMZ and other formats via our Geoserver Request Builder Tool. Download static .png maps of leaf and bloom.
How often do we see a spring this early or late?
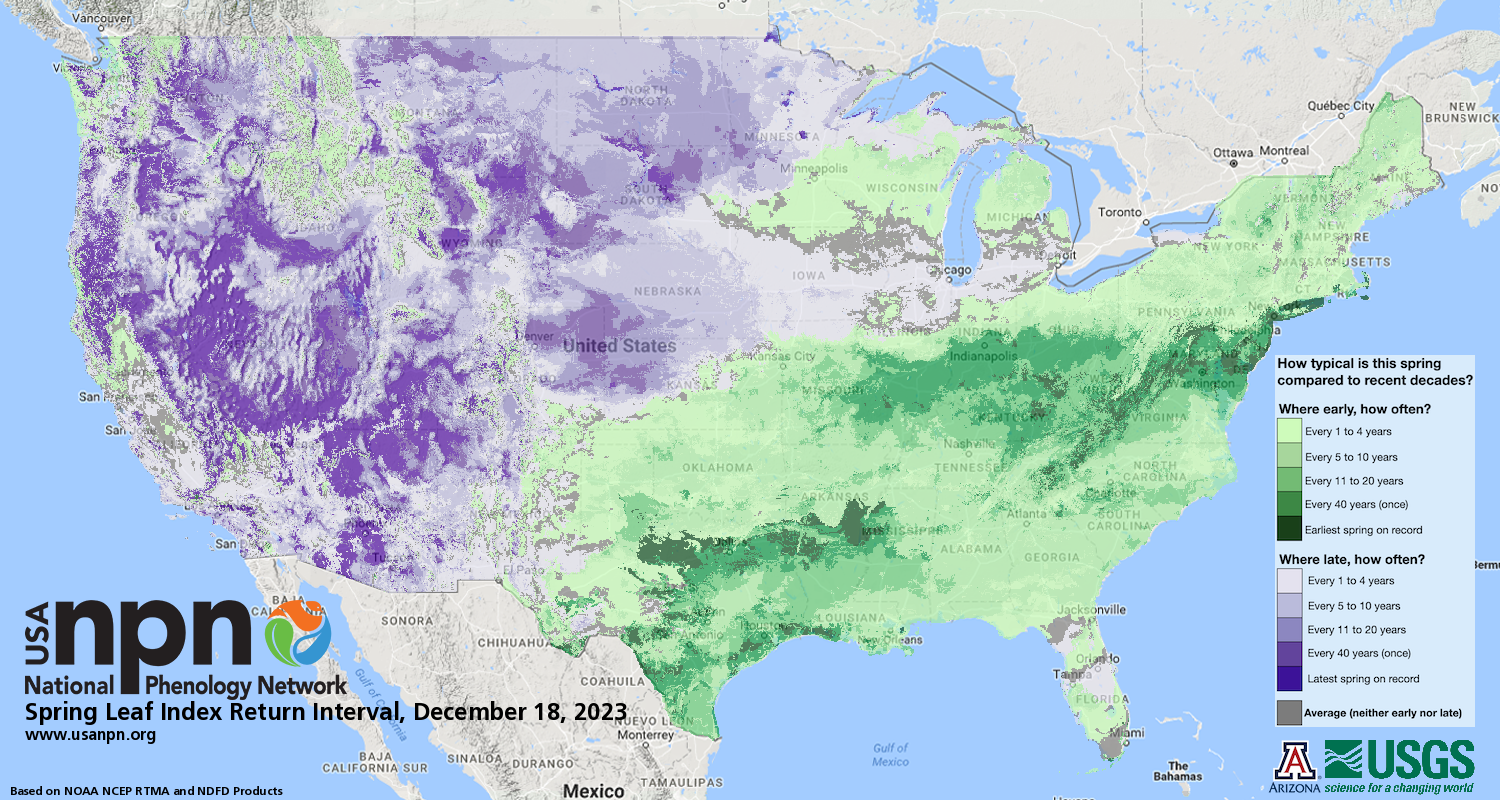
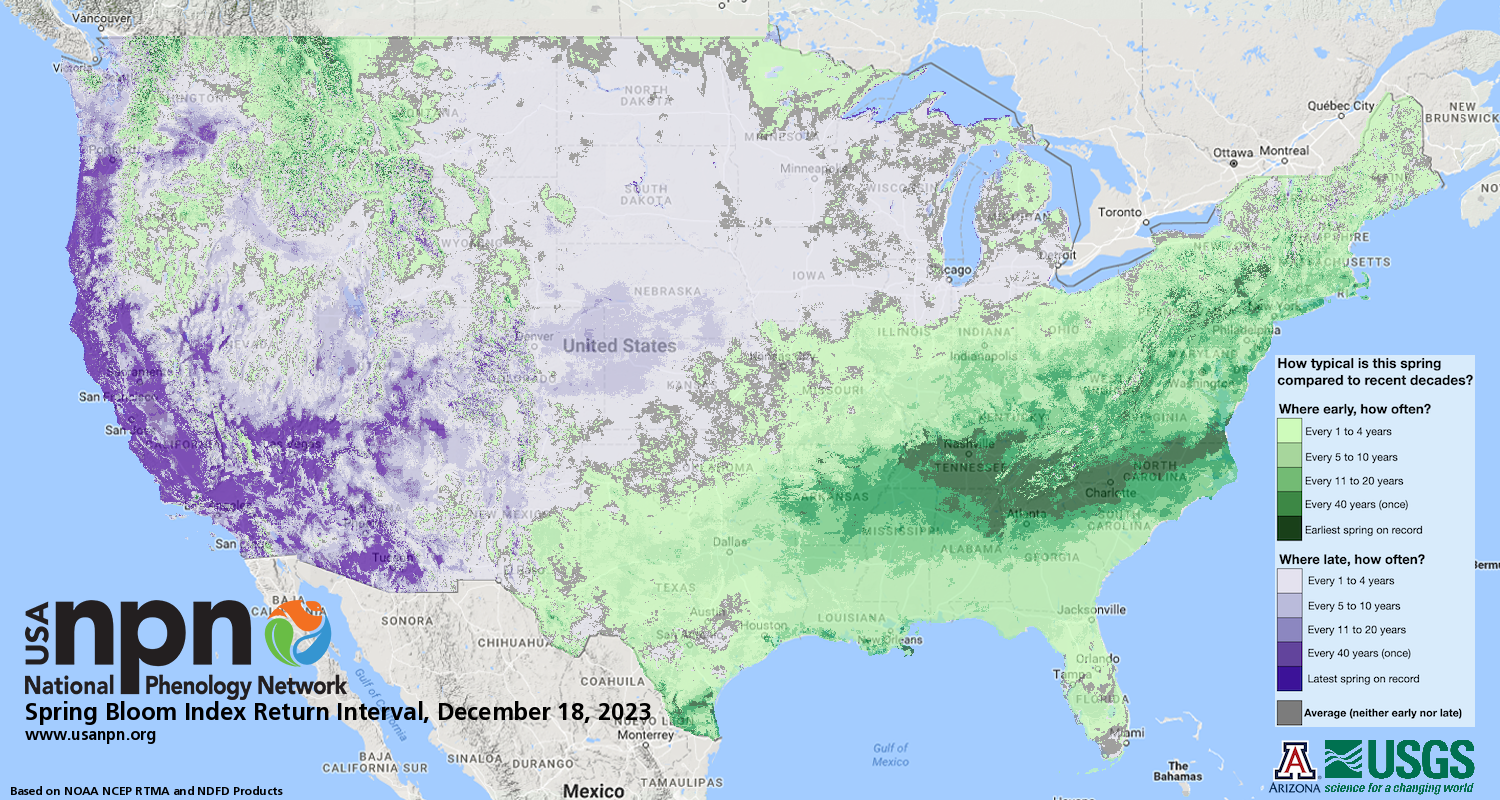
How typical is this year’s spring? Darker colors represent springs that are unusually early or late in the long-term record. Gray indicates an average spring.
Check back on this page to see how spring unfolds this year!
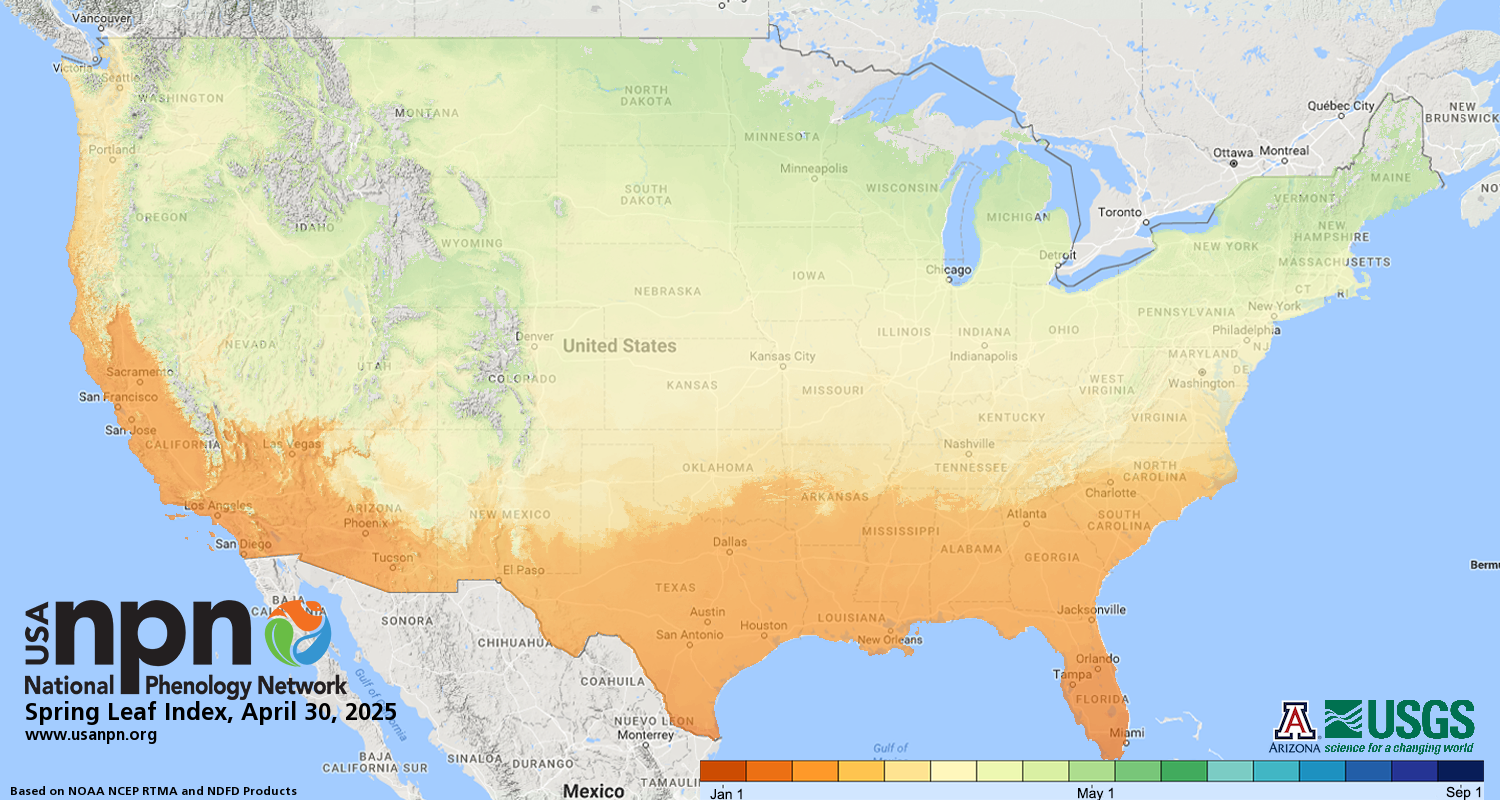
When did spring arrive at locations across the country?
The First Leaf Index map at right shows locations that have reached the requirements for the Spring Leaf Index model so far this year.
The First Bloom Index map at right shows locations that have reached the requirements for the First Bloom Index model.
Learn more about the Extended Spring Indices and the data products available.
USA-NPN also produces a suite of Accumulated Growing Degree Day map products.
What is behind these maps?
The Extended Spring Indices are mathematical models that predict the "start of spring" (timing of leaf out or bloom for species active in early spring) at a particular location (Schwartz 1997, Schwartz et al. 2006, Schwartz et al. 2013). These models were constructed using historical ground-baesd observations of the timing of first leaf and first bloom in a cloned lilac cultivar (S. x chinensis 'Red Rothomagensis') and two cloned honeysuckle cultivars (Lonicera tatarica 'Arnold Red' and L. korolkowii 'Zabelii'). These species were selected because they are among the first woody plants to leaf out and bloom in the springtime and are common across much of the country.
Primary inputs to the model are temperature and weather events, beginning January 1 of each year (Ault et al. 2015). Maps for the current year are generated using temperature products from NOAA National Centers for Environmental Prediction Real-Time Mesoscale Analysis. More information is provided in our Gridded Product Documentation.
To determine how the current spring compares to “normal”, we difference the day of year the leaf out or bloom was reached this year from the long-term average (1991-2020) day of year it was met. Long-term averages were calculated using PRISM Climate Data daily minimum/maximum temperature data (Oregon State University).
In 2022, we updated the period of comparison for our spring leaf out and bloom anomaly maps to the new climate normal of 1991-2020, following standards set by NOAA and the World Meteorological Organization. Climate Central offers more detail about how seasonal average temperatures have shifted from the prior to the current climate normal period.
To calculate how often we see a spring as early or late as the current spring, we compare the current year's Spring Index Anomaly value to the anomaly values from the previous decades. We determine how often a spring was at least this early (or late) by taking the number of years in the record divided by the count of years that were earlier (or later) than the current year.
Re-use of Maps and Data
Content, maps, and data accessible via usanpn.org are openly and universally available to all users. USA-NPN is not responsible for the content or the use of the data. Content may be re-used and modified with appropriate attribution (e.g., "source: USA National Phenology Network, www.usanpn.org"). See our complete Content Policy and Data Use Policy.
![]()
Recommend
About Joyk
Aggregate valuable and interesting links.
Joyk means Joy of geeK