
4

用Echarts实现前端表格引用从属关系可视化 - 葡萄城技术团队
source link: https://www.cnblogs.com/powertoolsteam/p/17001338.html
Go to the source link to view the article. You can view the picture content, updated content and better typesetting reading experience. If the link is broken, please click the button below to view the snapshot at that time.

用Echarts实现前端表格引用从属关系可视化
在金融行业,我们经常会有审计审查的需求,对某个计算结果进行审查,但是这个计算结果可能依赖多个单元格,而且会有会有多级依赖的情况,如果让我们的从业人员靠眼睛找,工作量巨大,而且准确性存疑,基本上死路一条,因此让整个审查过程可视化,迫在眉睫,现在我们利用纯前端表格和Echarts将审计审查过程可视化
一.首先我们先了解一下前端表格或Excel中引用和从属关系:
1.在单元格B1中设置公式 =SUM(A1)。 单元格A1是单元格B1的引用单元格(引用关系)
2.在单元格B1中设置公式 =SUM(A1)。 单元格B1是单元格A1的从属单元格(从属关系)
二.接下来我们看一下最终实现效果:
1.引用关系

2.从属关系
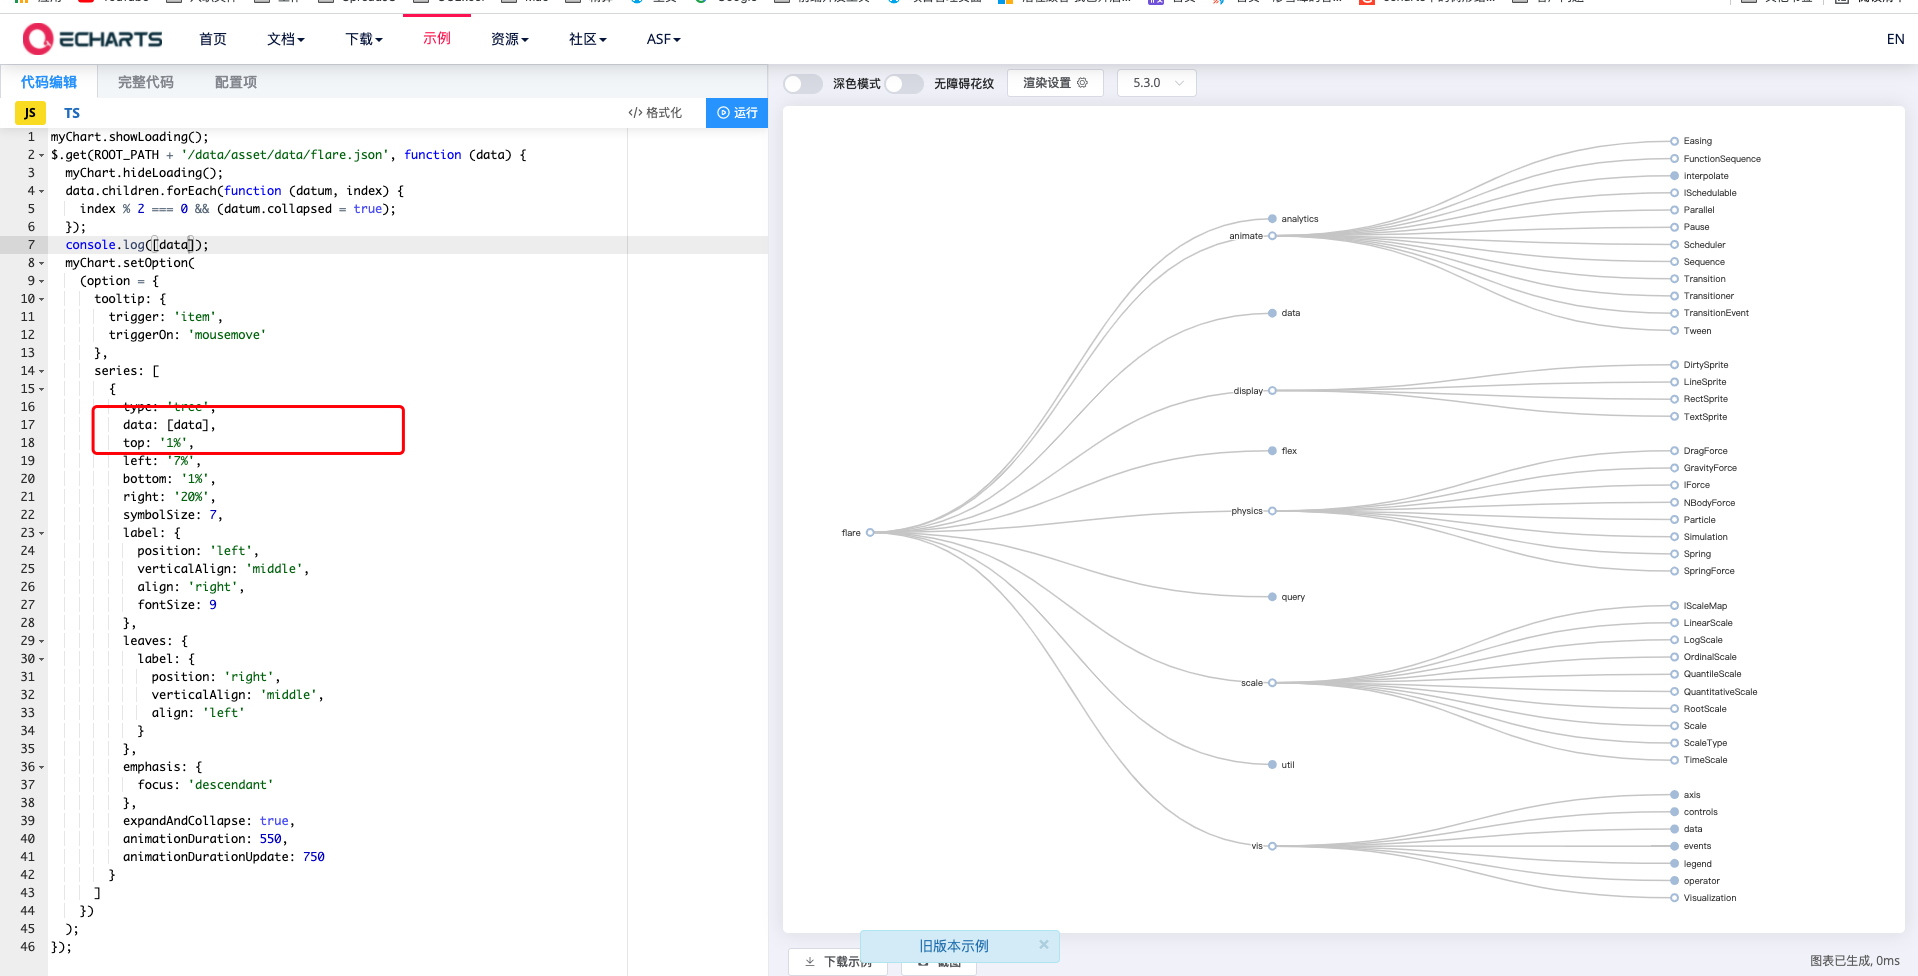
三.本次我们用的是Echarts的树图将引用和从属关系可视化,关于Echarts上手,大家去Echarts官网有完整上手教程,Echarts社区有很多开发者做的许多有趣又实用的demo,这里我们用的是树图
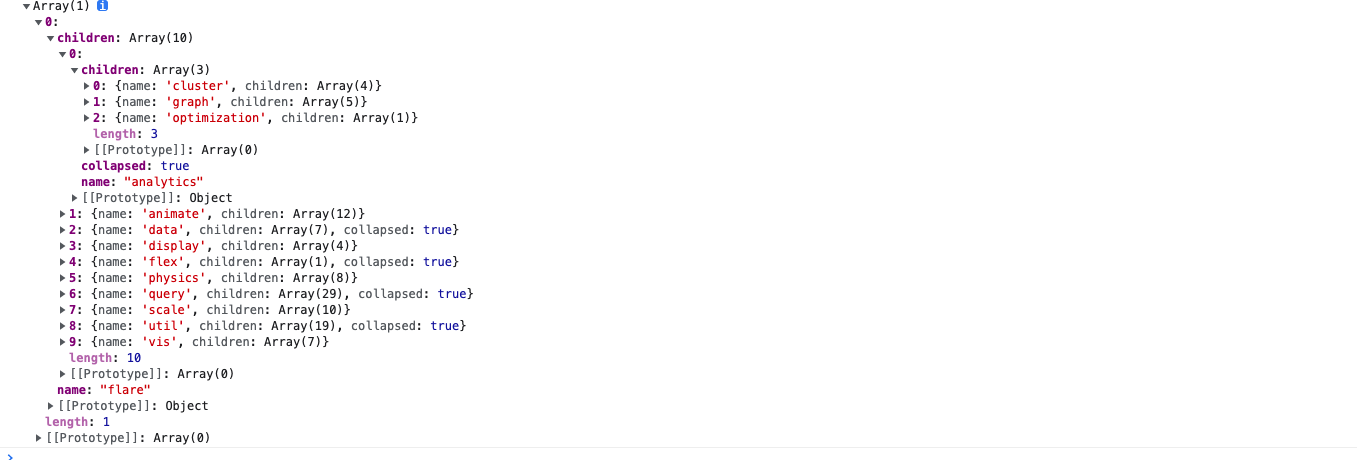
四.接下来我们要用纯前端表格控件的获取引用和从属关系的api将某个单元格的引用和从属关系顺藤摸瓜,刨根问题,刨到“祖坟”上,将这些关系,构造成Echarts树图的data结构,废话不说,直接上核心代码
// 递归构建追踪树
    buildNodeTreeAndPaint = (spreadSource, trackCellInfo) => {
        let info = this.getCellInfo(trackCellInfo);
        let sheetSource = spreadSource.getSheetFromName(info.sheetName);
        // 创建跟节点
        let rootNode = this.creatNode(info.row, info.col, sheetSource, 0, "");

        let name = rootNode.sheetName + "*" + rootNode.row + "*" + rootNode.col + "*" + Math.random().toString();
        let precedentsRootNode = '';
        let dependentsRootNode = '';
        if (this.state.trackType === "Precedents" || this.state.trackType === "Both") {
            this.getNodeChild(rootNode, sheetSource, "Precedents")
            debugger;
            console.log(rootNode)
            if (this.state.trackType === "Both") {
                let rootNodeChildren = JSON.parse(JSON.stringify(rootNode.children));
                rootNode.children = [];
                precedentsRootNode = JSON.parse(JSON.stringify(rootNode));
                precedentsRootNode.children.push({
                    name: "Precedents",
                    value: "Precedents",
                    children: rootNodeChildren
                })
                this.setState({
                    precedentsRootNode: JSON.parse(JSON.stringify(precedentsRootNode)),
                })
            }
        }
        if (this.state.trackType === "Dependents" || this.state.trackType === "Both") {
            this.getNodeChild(rootNode, sheetSource, "Dependents")
            console.log(rootNode)
            if (this.state.trackType === "Both") {
                let deepInfo = [1];
                let rootNodeChildren = JSON.parse(JSON.stringify(rootNode.children));
                rootNode.children = [];
                dependentsRootNode = JSON.parse(JSON.stringify(rootNode));
                dependentsRootNode.children.push({
                    name: "Dependents",
                    value: "Dependents",
                    children: rootNodeChildren
                })
                this.setState({
                    dependentsRootNode: JSON.parse(JSON.stringify(dependentsRootNode)),
                })
            }


        }
        if (this.state.trackType === "Both") {
            precedentsRootNode.children = precedentsRootNode.children.concat(dependentsRootNode.children);
            // let bothRootNode = precedentsRootNode.children[0].children.concat(dependentsRootNode.children[0].children)
            this.setState({
                rootNode1: JSON.parse(JSON.stringify(precedentsRootNode)),
            })
        } else {
            this.setState({
                rootNode1: JSON.parse(JSON.stringify(rootNode)),
            })
        }
    }
    creatNode = (row, col, sheet, deep, trackType) => {
        let node = {
            value: sheet.getValue(row, col),
            position: sheet.name() + "!" + GC.Spread.Sheets.CalcEngine.rangeToFormula(new GC.Spread.Sheets.Range(row, col, 1, 1)),
            deep: deep,
            name: `${sheet.name()}!${GC.Spread.Sheets.CalcEngine.rangeToFormula(new GC.Spread.Sheets.Range(row, col, 1, 1))}\nvalue:${sheet.getValue(row, col)}`,
            sheetName: sheet.name(),
            row: row,
            col: col,
            trackType: trackType
        };
        return node;
    }
    getNodeChild = (rootNode, sheet, trackType) => {
        let childNodeArray = [];
        let children = [];
        let row = rootNode.row, col = rootNode.col, deep = rootNode.deep;
        if (trackType == "Precedents") {
            children = sheet.getPrecedents(row, col);
        }
        else {
            children = sheet.getDependents(row, col);
        }
        // let self = this;
        if (children.length >= 1) {
            children.forEach((node) => {
                let row = node.row,
                    col = node.col,
                    rowCount = node.rowCount,
                    colCount = node.colCount,
                    _sheet = sheet.parent.getSheetFromName(node.sheetName);
                if (rowCount > 1 || colCount > 1) {
                    for (let r = row; r < row + rowCount; r++) {
                        for (let c = col; c < col + colCount; c++) {
                            let newNode = this.creatNode(r, c, _sheet, deep + 1, trackType)
                            // if (deep < self.maxDeep) {
                            this.getNodeChild(newNode, _sheet, trackType);
                            // }
                            childNodeArray.push(newNode);
                        }
                    }
                } else {
                    let newNode = this.creatNode(row, col, _sheet, deep + 1, trackType)
                    // if (deep < self.maxDeep) {
                    this.getNodeChild(newNode, _sheet, trackType);
                    // }
                    childNodeArray.push(newNode);
                }
            });
        }
        rootNode.children = childNodeArray;
    }
五.将构造好的引用和从属树rootNode在Echarts中渲染
myChart.setOption(
            (option = {
                tooltip: {
                    trigger: 'item',
                    triggerOn: 'mousemove'
                },
                series: [
                    {
                        type: 'tree',
                        data: [this.state.rootNode1],
                        top: '1%',
                        left: '15%',
                        bottom: '1%',
                        right: '7%',
                        symbolSize: 10,
                        orient: this.state.trackType === 'review'?'LR':'RL',
                        label: {
                            position: this.state.trackType === 'review'?'left':'right',
                            verticalAlign: 'middle',
                            align: this.state.trackType === 'review'?'right':'left',
                        },
                        leaves: {
                            label: {
                                position: this.state.trackType === 'review'?'right':'left',
                                verticalAlign: 'middle',
                                align: this.state.trackType === 'review'?'left':'right'
                            }
                        },
                        emphasis: {
                            focus: 'descendant'
                        },
                        // layout: 'radial',
                        expandAndCollapse: true,
                        animationDuration: 550,
                        animationDurationUpdate: 750
                    }
                ]
            })
        );

        option && myChart.setOption(option);
以上就是实现报表中公式引用从属关系Echarts可视化的核心实现逻辑,由于工程较大,需要完整内容可以留言。。
拓展阅读
Recommend
About Joyk
Aggregate valuable and interesting links.
Joyk means Joy of geeK