

eBPF原理介绍与C语言实现eBPF程序
source link: http://just4coding.com/2022/03/22/ebpf-c/
Go to the source link to view the article. You can view the picture content, updated content and better typesetting reading experience. If the link is broken, please click the button below to view the snapshot at that time.

eBPF原理介绍与C语言实现eBPF程序
发表于
2022-03-22 分类于 Network
之前的文章<<使用eBPF和BCC调查创建文件的进程>>介绍了基于BCC来实现eBPF程序。BCC实现了对eBPF的封装,用户态部分提供Python API, 内核态部分使用的eBPF程序还是通过C语言来实现。运行时BCC会把eBPF的C程序编译成字节码、加载到内核执行,最后再通过用户空间的前端程序获取执行状态。
可以在BCC的BPF调用中,指定参数debug=4, 我们可以看到BCC的执行过程, 如:
from bcc import BPF
BPF(text="""
#include <linux/ptrace.h>
int kprobe__tty_write(struct pt_regs *ctx, struct file *file, const char __user *buf, size_t count) {
return 0;
}
""", debug=4)
eBPF编程的门槛还是比较高的,在当前还是快速发展的情况,API也还不稳定,对程序员的C语言、编译过程和内核等知识都有比较高的要求。BCC把这些都封装起来给用户提供了一个更为简单的使用框架。但本身也存在的一些问题,比如:
- 每次执行时都需要重新编译
- 执行程序的机器都需要安装内核头文件
eBPF: extended Berkeley Packet Filter是对BPF(现在称为cBPF: classic BPF)的扩展, 现在尽管还叫做BPF, 但应用场景已经远远超过了它的名称的范畴。它的应用范围的扩大主要得益于这几方面:
- 内核中
BPF字节码虚拟机扩展为一个通用的执行引擎 - 执行可节码的安全校验
JIT支持,可以直接将字节码指令转成内核可执行的原生指令运行
这样在安全性、可编程性和性能方面的提升都使得eBPF在包过滤以外的其他领域获取巨大的应用空间。
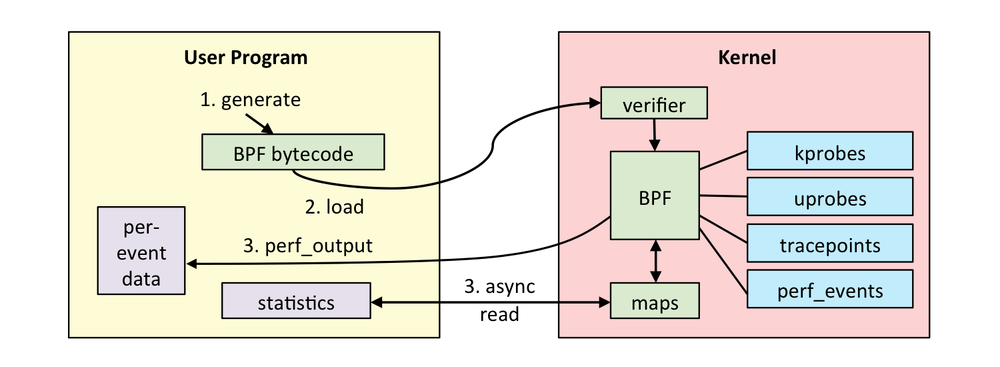
eBPF的整体架构图如下:
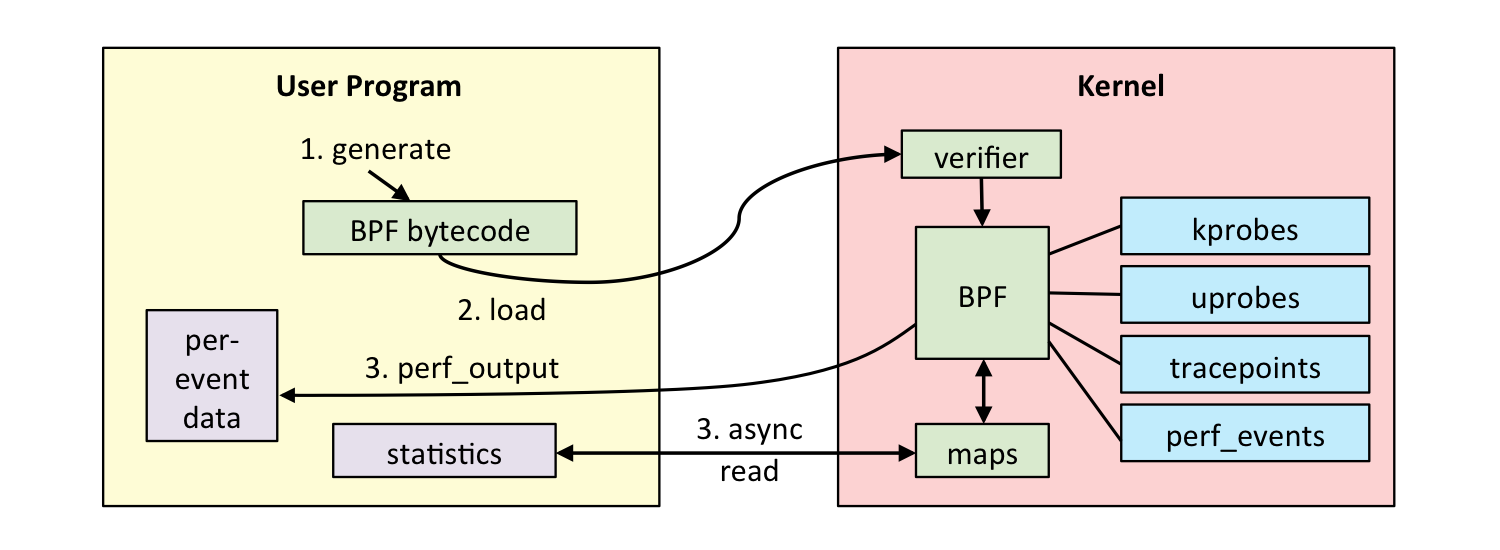
图片来自: https://cloudnative.to/blog/bpf-intro/linux_ebpf_internals.png
eBPF程序分为两部分:
- 内核态部分: 内核中的
eBPF字节码程序负责在内核中处理特定事件,并可以将处理的结果通过maps或者perf-event发送到用户空间 - 用户态部分: 用户态部分主要有两方面作用:
- 加载
eBPF字节码程序到内核中 - 与内核态
eBPF程序之写读写信息
- 加载
eBPF本身是事件驱动触发的机制,因而需要将特定的内核事件与eBPF字节码程序进行关联。
eBPF程序的开发及运行的一个典型过程如下:
- 编写
eBPF程序,并编译成字节码,目前只能使用CLANG和LLVM编译成eBPF字节码 - 将
eBPF程序加载到内核中,内核会校验字节码避免内核崩溃 - 将内核事件与
eBPF程序进行关联 - 内核事件发生时,
eBPF程序执行,发送信息给用户态程序 - 用户态程序读取相关信息
我们还是以之前文章中的示例来说明上述过程。上文我们提到我们的系统是CentOS7.8, 尽管CentOS7上的eBPF支持还是比较实验性的,但大多数功能还是能支持的。
由于要使用CLANG和LLVM来编译eBPF程序,而CentOS7上默认yum安装的CLANG和LLVM的版本比较老,不支持eBPF的编译。可以从这个repo中安装, 在/etc/yum.repos.d/下创建文件c7-llvm.repo文件, 内容如下:
[c7-llvm-toolset-9]
name=c7-llvm-toolset-9
baseurl=https://buildlogs.centos.org/c7-llvm-toolset-9.0.x86_64/
gpgcheck=0
enabled=1
然后执行以下命令进行安装并启用:
yum install llvm-toolset-9.0
source /opt/rh/llvm-toolset-9.0/enable
准备好编译环境之后,我们开始编写eBPF程序, vfs_create.c内容如下:
#include <linux/kconfig.h>
#include <linux/fs.h>
#include <uapi/linux/ptrace.h>
#include <uapi/linux/bpf.h>
#include <linux/version.h>
#include <linux/sched.h>

#define SEC(NAME) __attribute__((section(NAME), used))
static int (*bpf_trace_printk)(const char *fmt, int fmt_size, ...) =
    (void *) BPF_FUNC_trace_printk;
static int (*bpf_probe_read)(void *dst, int size, void *src) =
    (void *) BPF_FUNC_probe_read;

#define PT_REGS_PARM1(x) ((x)->di)
#define PT_REGS_PARM2(x) ((x)->si)
#define PT_REGS_PARM3(x) ((x)->dx)
#define PT_REGS_PARM4(x) ((x)->cx)
#define PT_REGS_PARM5(x) ((x)->r8)
#define PT_REGS_RET(x) ((x)->sp)
#define PT_REGS_FP(x) ((x)->bp)
#define PT_REGS_RC(x) ((x)->ax)
#define PT_REGS_SP(x) ((x)->sp)
#define PT_REGS_IP(x) ((x)->ip)

SEC("kprobe/vfs_create")
int kprobe__vfs_create(struct pt_regs *ctx)
{
    char fmt[] = "FNAME: %s\n";
    struct dentry *dentry = (struct dentry *) PT_REGS_PARM2(ctx);
    struct qstr d_name = {};

bpf_probe_read(&d_name, sizeof(d_name), &dentry->d_name);

if (d_name.len == 0)
        return 0;

bpf_trace_printk(fmt, sizeof(fmt), d_name.name);
    return 0;
};

char _license[] SEC("license") = "GPL";
u32 _version SEC("version") = LINUX_VERSION_CODE;
程序逻辑和之前文章中类似,可以看到和写在BCC中的C代码是不同的。例如,这里使用的eBPF程序的参数只有一个struct pt_regs *ctx, 其他的参数需要从ctx中获取到,而BCC中的C代码的函数参数中就已经带有相关参数了。因为BCC会在编译代码前对代码进行处理,可以使用文章开头所说的debug=4来查看这些细节。
然后编写Makefile:
OBJS = vfs_create.o

LLC ?= llc
CLANG ?= clang
INC_FLAGS = -nostdinc -isystem `$(CLANG) -print-file-name=include`
EXTRA_CFLAGS ?= -O2 -emit-llvm

linuxhdrs ?= /usr/src/kernels/`uname -r`
LINUXINCLUDE =  -I$(linuxhdrs)/include \
                -I$(linuxhdrs)/include/uapi \
                -I$(linuxhdrs)/include/generated \
                -I$(linuxhdrs)/include/generated/uapi \
                -I$(linuxhdrs)/arch/x86/include \
                -I$(linuxhdrs)/arch/x86/include/uapi \
                -I$(linuxhdrs)/arch/x86/include/generated \
                -I$(linuxhdrs)/arch/x86/include/generated/uapi

prefix ?= /usr/local

INSTALLPATH = $(prefix)/lib/bpf

install_PROGRAM = install
install_DIR = install -dv

all: $(OBJS)

.PHONY: clean

clean:
    rm -f $(OBJS)

INC_FLAGS = -nostdinc -isystem `$(CLANG) -print-file-name=include`

$(OBJS):  %.o:%.c
    $(CLANG) $(INC_FLAGS) \
    -D__KERNEL__ -D__ASM_SYSREG_H -D__BPF_TRACING__ \
    -Wno-unused-value -Wno-pointer-sign \
    -Wno-compare-distinct-pointer-types \
    -Wno-gnu-variable-sized-type-not-at-end \
    -Wno-address-of-packed-member -Wno-tautological-compare \
    -Wno-unknown-warning-option \
    -I../include $(LINUXINCLUDE) \
    $(EXTRA_CFLAGS) -c $< -o -| $(LLC) -march=bpf -filetype=obj -o $@

install: $(OBJS)
    $(install_DIR) -d $(INSTALLPATH) ; \
    $(install_PROGRAM) $^ -t $(INSTALLPATH)

uninstall: $(OBJS)
    rm -rf $(INSTALLPATH)
编译我们编写的eBPF程序,这需要提前安装好相应内核版本的kernel-devel包:
make
这会在当前目录生成vfs_create.o文件, 使用llvm-objdump查看生成的eBPF程序:
[root@default bpf]# llvm-objdump -S ./vfs_create.o

./vfs_create.o:	file format ELF64-BPF


Disassembly of section kprobe/vfs_create:

0000000000000000 kprobe__vfs_create:
       0:	b7 02 00 00 73 0a 00 00	r2 = 2675
       1:	6b 2a f8 ff 00 00 00 00	*(u16 *)(r10 - 8) = r2
       2:	18 02 00 00 46 4e 41 4d 00 00 00 00 45 3a 20 25	r2 = 2675202247981354566 ll
       4:	7b 2a f0 ff 00 00 00 00	*(u64 *)(r10 - 16) = r2
       5:	b7 02 00 00 00 00 00 00	r2 = 0
       6:	73 2a fa ff 00 00 00 00	*(u8 *)(r10 - 6) = r2
       7:	79 13 68 00 00 00 00 00	r3 = *(u64 *)(r1 + 104)
       8:	7b 2a e8 ff 00 00 00 00	*(u64 *)(r10 - 24) = r2
       9:	7b 2a e0 ff 00 00 00 00	*(u64 *)(r10 - 32) = r2
      10:	07 03 00 00 20 00 00 00	r3 += 32
      11:	bf a1 00 00 00 00 00 00	r1 = r10
      12:	07 01 00 00 e0 ff ff ff	r1 += -32
      13:	b7 02 00 00 10 00 00 00	r2 = 16
      14:	85 00 00 00 04 00 00 00	call 4
      15:	61 a1 e4 ff 00 00 00 00	r1 = *(u32 *)(r10 - 28)
      16:	15 01 05 00 00 00 00 00	if r1 == 0 goto +5 <LBB0_2>
      17:	79 a3 e8 ff 00 00 00 00	r3 = *(u64 *)(r10 - 24)
      18:	bf a1 00 00 00 00 00 00	r1 = r10
      19:	07 01 00 00 f0 ff ff ff	r1 += -16
      20:	b7 02 00 00 0b 00 00 00	r2 = 11
      21:	85 00 00 00 06 00 00 00	call 6

00000000000000b0 LBB0_2:
      22:	b7 00 00 00 00 00 00 00	r0 = 0
      23:	95 00 00 00 00 00 00 00	exit
至此我们完成了上述典型过程的第一步。接下来看如何加载eBPF程序。
可以直接使用bpftool来加载程序,具体的使用信息可以参考man bpftool-prog。
执行bpftool之前需要加挂载/sys/fs/bpf目录,这是因为内核中的eBPF对象由一个文件描述符引用,当bpftool工具退出时,相应的文件描述符关闭时,eBPF程序也就销毁了,因而内核提供了/sys/fs/bpf机制,保证程序退出后,eBPF程序依然存在,对细节感兴趣可以参考LWN的这篇。
mount -t bpf none /sys/fs/bpf
加载eBPF程序, 使用show命令可以看到我们创建的eBPF程序:
[root@default bpf]# bpftool prog load vfs_create.o /sys/fs/bpf/vfs_create
[root@default bpf]# bpftool prog show
41: kprobe  name kprobe__vfs_cre  tag f7facf2555238156  gpl
	loaded_at 2022-03-21T17:06:01+0000  uid 0
	xlated 192B  jited 153B  memlock 4096B
要删除eBPF程序只需要移除bpffs里的文件:
rm /sys/fs/bpf/vfs_create
为了更好的说明加载的过程,我们使用C语言调用bpf系统调用实现一个简单的加载器loader.c:
#define _GNU_SOURCE
#include <unistd.h>
#include <string.h>
#include <sys/syscall.h>
#include <stdlib.h>
#include <stdio.h>
#include <sys/stat.h>
#include <fcntl.h>
#include <linux/bpf.h>
#include <linux/version.h>
#include <errno.h>

int main(int argc, char **argv)
{
    int bfd, pfd;
    unsigned char buf[1024] = {};
    struct bpf_insn *insn;
    union bpf_attr attr = {};
    unsigned char log_buf[4096] = {};
    int ret, n, i;

if (argc != 3) {
        printf("Usage: loader <ebpf file> <pathname>\n");
        exit(-1);
    }

bfd = open(argv[1], O_RDONLY);
    if (bfd < 0) {
        printf("open eBPF program error: %s\n", strerror(errno));
        exit(-1);
    }

n = read(bfd, buf, 1024);
    for (i = 0; i < n; ++i) {
        if (i % 8 == 0)
            printf("\n%03x: ", i);

printf("%02x ", buf[i]);
    }
    close(bfd);

printf("\n");

insn = (struct bpf_insn*)buf;

attr.prog_type = BPF_PROG_TYPE_KPROBE;
    attr.insns = (unsigned long)insn;
    attr.insn_cnt = n / sizeof(struct bpf_insn);
    attr.license = (unsigned long) "GPL";
    attr.log_size = sizeof(log_buf);
    attr.log_buf = (unsigned long)log_buf;
    attr.log_level = 1;
    attr.kern_version = LINUX_VERSION_CODE;
    memcpy(attr.prog_name, "vfs_create", sizeof("vfs_create"));

pfd = syscall(SYS_bpf, BPF_PROG_LOAD, &attr, sizeof(attr));
    if (pfd < 0) {
        printf("bpf syscall load error: %s\n", strerror(errno));
        printf("log_buf = %s\n", log_buf);
        exit(-1);
    }

bzero(&attr, sizeof(attr));
    attr.pathname = (unsigned long)((void *)argv[2]);
    attr.bpf_fd = pfd;

if (syscall(SYS_bpf, BPF_OBJ_PIN, &attr, sizeof(attr)) < 0) {
        printf("bpf syscall pin error: %s\n", strerror(errno));
        exit(-1);
    }

printf("eBPF prog loaded\n");
}
为了简单没有在代码中处理ELF文件格式,而直接使用eBPF的字节码。我们可以使用dd程序从vfs_create.o这个ELF文件中抽取出字节码。
使用llvm-readelf查看vfs_create.o, 可以看到kprobe/vfs_create段的偏移量是000040,也就是64, 大小是0000c0, 也就是192字节:
[root@default bpf]# llvm-readelf -S ./vfs_create.o

There are 10 section headers, starting at offset 0x280:

Section Headers:
  [Nr] Name              Type            Address          Off    Size   ES Flg Lk Inf Al
  [ 0]                   NULL            0000000000000000 000000 000000 00      0   0  0
  [ 1] .strtab           STRTAB          0000000000000000 000200 00007f 00      0   0  1
  [ 2] .text             PROGBITS        0000000000000000 000040 000000 00  AX  0   0  4
  [ 3] kprobe/vfs_create PROGBITS        0000000000000000 000040 0000c0 00  AX  0   0  8
  [ 4] .rodata.str1.1    PROGBITS        0000000000000000 000100 00000b 01 AMS  0   0  1
  [ 5] license           PROGBITS        0000000000000000 00010b 000004 00  WA  0   0  1
  [ 6] version           PROGBITS        0000000000000000 000110 000004 00  WA  0   0  4
  [ 7] .eh_frame         PROGBITS        0000000000000000 000118 000030 00   A  0   0  8
  [ 8] .rel.eh_frame     REL             0000000000000000 0001f0 000010 10      9   7  8
  [ 9] .symtab           SYMTAB          0000000000000000 000148 0000a8 18      1   4  8
Key to Flags:
  W (write), A (alloc), X (execute), M (merge), S (strings), l (large)
  I (info), L (link order), G (group), T (TLS), E (exclude), x (unknown)
  O (extra OS processing required) o (OS specific), p (processor specific)
使用dd命令抽取字节码部分:
[root@default bpf]# dd if=./vfs_create.o of=vfs_create.bpf bs=1 count=192 skip=64
192+0 records in
192+0 records out
192 bytes (192 B) copied, 0.0136997 s, 14.0 kB/s
编译我们编写的loader, 并加载eBPF程序:
[root@default bpf]# ./loader ./vfs_create.bpf /sys/fs/bpf/vfs_create

000: b7 02 00 00 73 0a 00 00
008: 6b 2a f8 ff 00 00 00 00
010: 18 02 00 00 46 4e 41 4d
018: 00 00 00 00 45 3a 20 25
020: 7b 2a f0 ff 00 00 00 00
028: b7 02 00 00 00 00 00 00
030: 73 2a fa ff 00 00 00 00
038: 79 13 68 00 00 00 00 00
040: 7b 2a e8 ff 00 00 00 00
048: 7b 2a e0 ff 00 00 00 00
050: 07 03 00 00 20 00 00 00
058: bf a1 00 00 00 00 00 00
060: 07 01 00 00 e0 ff ff ff
068: b7 02 00 00 10 00 00 00
070: 85 00 00 00 04 00 00 00
078: 61 a1 e4 ff 00 00 00 00
080: 15 01 05 00 00 00 00 00
088: 79 a3 e8 ff 00 00 00 00
090: bf a1 00 00 00 00 00 00
098: 07 01 00 00 f0 ff ff ff
0a0: b7 02 00 00 0b 00 00 00
0a8: 85 00 00 00 06 00 00 00
0b0: b7 00 00 00 00 00 00 00
0b8: 95 00 00 00 00 00 00 00
eBPF prog loaded
此时使用bpftool查看eBPF程序, 可以看到我们的程序被成功加载:
[root@default user]# bpftool prog show
43: kprobe name vfs_create tag f7facf2555238156  gpl
	loaded_at 2022-03-21T17:18:36+0000  uid 0
	xlated 192B  jited 153B  memlock 4096B
至此第二步完成。
第三步是要内核事件与加载的eBPF程序进行关联。我们使用的事件源是kprobe。每个kprobe或kretprobe被创建时都会关联一个id, 存储在/sys/kernel/debug/tracing/events/[uk]probe/xxxxxx/id或/sys/kernel/debug/tracing/events/[uk]retprobe/xxxxxx/id中。具体怎样使用sysfs创建kprobe可以参考内核文档。我们需要使用这个id打开一个perf_event并启用它,关联到指定的eBPF程序做为我们的事件处理程序。
首先创建vfs_create的kprobe, 并查看相应probe的id:
[root@default user]# echo 'p:vfs_create vfs_create' >> /sys/kernel/debug/tracing/kprobe_events
[root@default user]# cat /sys/kernel/debug/tracing/events/kprobes/vfs_create/id
1462
编写关联逻辑的代码attacher.c:
#define _GNU_SOURCE
#include <unistd.h>
#include <string.h>
#include <sys/syscall.h>
#include <stdlib.h>
#include <stdio.h>
#include <sys/stat.h>
#include <fcntl.h>
#include <linux/bpf.h>
#include <linux/perf_event.h>
#include <linux/hw_breakpoint.h>
#include <errno.h>

int main(int argc, char **argv)
{
    int ret, efd, pfd;
    struct perf_event_attr pattr = {};
    long event_id, ebpf_id;
    union bpf_attr attr;

if (argc != 3) {
        printf("Usage: attacher <event id> <eBPF id>\n");
        exit(-1);
    }

event_id = strtol(argv[1], NULL, 10);
    ebpf_id = strtol(argv[2], NULL, 10);

printf("Event: %ld, eBPF: %ld\n", event_id, ebpf_id);

bzero(&attr, sizeof(attr));
    attr.prog_id = ebpf_id;

pfd = syscall(SYS_bpf, BPF_PROG_GET_FD_BY_ID, &attr, sizeof(attr));
    if (pfd < 0) {
        printf("bpf error: %s\n", strerror(errno));
        exit(-1);
    }

pattr.type = PERF_TYPE_TRACEPOINT;
    pattr.sample_type = PERF_SAMPLE_RAW;
    pattr.sample_period = 1;
    pattr.wakeup_events = 1;
    pattr.config = event_id;
    pattr.size = sizeof(pattr);
    efd = syscall(SYS_perf_event_open, &pattr, -1, 0, -1, 0);
    if (efd < 0) {
        printf("perf_event_open error: %s\n", strerror(errno));
        exit(-1);
    }

ret = ioctl(efd, PERF_EVENT_IOC_SET_BPF, pfd);
    if (ret < 0) {
        printf("PERF_EVENT_IOC_SET_BPF error: %s\n", strerror(errno));
        exit(-1);
    }

ret = ioctl(efd, PERF_EVENT_IOC_ENABLE, 0);
    if (ret < 0) {
        printf("PERF_EVENT_IOC_ENABLE error: %s\n", strerror(errno));
        exit(-1);
    }

printf("attach success\n");

while (1) {
        sleep(1);
    }
}
[root@default user]# gcc attacher.c -o attacher
[root@default user]# ./attacher 1462 43
Event: 1462, eBPF: 43
attach success
bpf_trace_printk会将信息写入到文件/sys/kernel/debug/tracing/trace_pipe。我们打开一个终端读取它的内容, 在另一个终端上,在/tmp目录下创建文件:
touch /tmp/dummy.xxx
可以看到trace_pipe内容中看到相应的文件记录:
[root@default tmp]# cat /sys/kernel/debug/tracing/trace_pipe
           touch-5892  [000] d... 116854.904439: : FNAME: dummy.xxx
eBPF现在发展很快,不同的内核版本上,这里所用的代码可能需要有所调整。想要具体的了解eBPF编程相关的内容还是要熟悉内核中eBPF相关的代码,而且在不同的内核版本上,文件目录可能都会有所不同。
参考链接:
Recommend
About Joyk
Aggregate valuable and interesting links.
Joyk means Joy of geeK