

Plot and Compare the Stock Price Trend using Python
source link: https://www.codeproject.com/Tips/5325459/Plot-and-Compare-the-Stock-Price-Trend-using-Pytho
Go to the source link to view the article. You can view the picture content, updated content and better typesetting reading experience. If the link is broken, please click the button below to view the snapshot at that time.

Introduction
Nowadays, whoever is dealing with finance data, specifically with stock market needs very good understanding of data. Obviously, understanding of data completely depends on how the data is displayed or shown to someone. When we are putting money in the stock market, it is always advisable to first understand the pattern or behavior of the stock which you are going to buy or sell. In this article, I'm neither going to cover the internals of finance nor am I going to discuss about what all parameters one needs to analyze or understand. The idea behind this article is, how one can use certain financial parameters to get the gist of market trend.
Getting Started
Let's consider a scenario, in which you would like to know, what is the opening price of Microsoft stock in the last few weeks. So that, by looking at the price, you can derive some conclusions. To perform this entire exercise, we need a few things:
- Stock symbol: In our case, it is MSFT.
- Programming language and library: In our case, it is Python, Yahoo Finance and Pandas.
- Plotting library: In our case, it is MatplotLib.
- IDE: In this case, I'm using Jupyter Notebook. You can use other IDE of your choice.
Using the Code
First of all, we need to import all the required packages:
import pandas
import yfinance
import matplotlib.pyplot as matplt
Then we need to get data for MSFT stock for the desired duration. Here, I'm interested in data for the duration 2021-10-01 to 2022-02-14.
stock = ["MSFT"]
stock_data = yfinance.download(stock,start="2021-10-01", end="2022-02-14")
To have a gist of the downloaded data, you can fetch initial few rows and see. To view initial five rows, you can do the following:
stock_data.head(5)
Executing the above statement will provide you with the output as shown below:
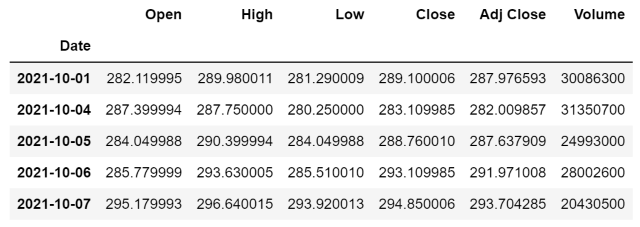
Now we have the data with us, it is completely on us that what all columns we consider for analysis. For this article, let's go with the opening price of stock, which is represented by Open column.
Let's take values from Open column in a variable as shown:
data = stock_data.loc[:,"Open"].copy()
The above line will create a copy of all the data available under Open column.
Next comes plotting the data of Open column. Using matplotlib, we can plot various types of charts and for this example, I'm taking seaborn. Once chart style is decided, we need to set the required height, width and font size as per our visualization needs. Here is the code for that:
data.plot(figsize=(20,7), fontsize = 16)
matplt.style.use("seaborn")
matplt.show()
The above lines will give you the visualization as shown below:

By looking at such visualization, you can easily say, which day stock opened very high and which day it was low.
Using the Code
Here is the complete code as explained above:
import pandas
import yfinance
import matplotlib.pyplot as matplt
stock = ["MSFT"] stock_data = yfinance.download(stock,start="2021-10-01", end="2022-02-14")
data = stock_data.loc[:,"Open"].copy()
data.plot(figsize=(20,7), fontsize = 16)
matplt.style.use("seaborn")
matplt.show()
Points of Interest
Hope you enjoyed reading this article. Check out the video recording of this article here. This article plots only one stock, but you can extend it to go for more.
References
History
- 18th February, 2022: Initial version
Recommend
About Joyk
Aggregate valuable and interesting links.
Joyk means Joy of geeK