

Example of Pushdown Using SingleStore and Spark - DZone Big Data
source link: https://dzone.com/articles/an-example-of-pushdown-using-singlestore-and-spark-1
Go to the source link to view the article. You can view the picture content, updated content and better typesetting reading experience. If the link is broken, please click the button below to view the snapshot at that time.

Abstract
In the first part of this Pushdown series, we successfully loaded our weather data into a Spark Dataframe, checked the number of rows, and then wrote the Dataframe to SingleStore using the SingleStore Spark Connector. In this final part of our query Pushdown series, we’ll see an example of Pushdown using our weather database.
The notebook files used in this article series are available on GitHub in DBC, HTML, and iPython formats.
Introduction
This is a two-part article series, and it is structured as follows:
- Load the Weather data into SingleStore.
- Demonstrate a Pushdown example.
This second article covers Part 2, Demonstrate a Pushdown example.
Fill Out the Notebook
Let’s now create a new notebook. We’ll call it Pushdown Example. We’ll attach our new notebook to our Spark cluster.
In the first code cell, let’s add the following:
%run ./SetupIn the Setup notebook, we need to ensure that the server address and password are added for our SingleStore Managed Service cluster.
In the next code cell, we’ll set some parameters for the SingleStore Spark Connector, as follows:
spark.conf.set("spark.datasource.singlestore.ddlEndpoint", cluster)
spark.conf.set("spark.datasource.singlestore.user", "admin")
spark.conf.set("spark.datasource.singlestore.password", password)
spark.conf.set("spark.datasource.singlestore.disablePushdown", "false")
In the next code cell, let’s read the data from the SingleStore table into a Spark Dataframe, as follows:
df = (spark.read
      .format("singlestore")
      .load("weather.temperatures_all"))
Next, we’ll create a temporary Spark table, as follows:
df.createOrReplaceTempView("temperatures")We’ll now create and register a Python UDF to convert temperatures from Fahrenheit to Celsius:
def convert_to_c(f):
  c = (f - 32) * (5 / 9)
  return round(c, 2)

spark.udf.register("convert_to_c", convert_to_c)
We’ll now formulate a query that uses the Python UDF:
spark.sql(
 "SELECT Date, convert_to_c(Max) as Max_C, convert_to_c(Min) as Min_C FROM temperatures WHERE City = 'San Francisco'"
).explain()
Adding .explain() to the end of the query shows us the Physical Query Plan. The output should look similar to the following:
== Physical Plan ==
*(2) Project [Date#1209, pythonUDF0#1293 AS Max_C#1286, pythonUDF1#1294 AS Min_C#1287]
+- BatchEvalPython [convert_to_c(Max#1218), convert_to_c(Min#1219)], [pythonUDF0#1293, pythonUDF1#1294]
   +- *(1) Scan
---------------
SingleStore Query
Variables: (San Francisco)
SQL:
SELECT `Date#1` , `Max#4` , `Min#5`
FROM (

  SELECT `Date#1` , `Max#4` , `Min#5`
  FROM (

    SELECT *
    FROM (
      SELECT ( `Precipitation` ) AS `Precipitation#8` , ( `Date` ) AS `Date#1` , ( `Month` ) AS `Month#9` , ( `Week` ) AS `Week#10` , ( `Year` ) AS `Year#11` , ( `City` ) AS `City#12` , ( `Code` ) AS `Code#13` , ( `Location` ) AS `Location#14` , ( `State` ) AS `State#15` , ( `Avg` ) AS `Avg#16` , ( `Max` ) AS `Max#4` , ( `Min` ) AS `Min#5` , ( `Wind_Direction` ) AS `Wind_Direction#17` , ( `Wind_Speed` ) AS `Wind_Speed#18`
      FROM (
        SELECT * FROM `weather`.`temperatures_all`
      ) AS `a2`
    ) AS `a3`
    WHERE ( ( `City#12` = ? ) AND ( `City#12` ) IS NOT NULL )
  ) AS `a4`
) AS `a5`
EXPLAIN:
Gather partitions:all alias:remote_0
Project [a5.Date AS `Date#1`, a5.Max AS `Max#4`, a5.Min AS `Min#5`]
ColumnStoreFilter [a5.City = 'San Francisco' AND a5.City IS NOT NULL]
ColumnStoreScan weather.temperatures_all AS a5, KEY Precipitation (Precipitation) USING CLUSTERED COLUMNSTORE table_type:sharded_columnstore
---------------
       [Date#1209,Max#1218,Min#1219] PushedFilters: [], ReadSchema: struct<Date:string,Max:int,Min:int>
The final plan shows a single projection on top of a scan. The SingleStore Connector was able to Pushdown the following to SingleStore:
SELECT Date, …WHERE City = 'San Francisco'Evaluation of the UDF on the fields Max and Min were left to Spark since that is where the UDF lives.
We can now run the query:
display(spark.sql(
 "SELECT Date, convert_to_c(Max) as Max_C, convert_to_c(Min) as Min_C FROM temperatures WHERE City = 'San Francisco'"
))
The Databricks environment allows us to create simple charts. If we select a Line Chart and use Date as the Key along the x-axis and select Max_C and Min_C as the Values along the y-axis, it gives us the following plot, shown in Figure 1.
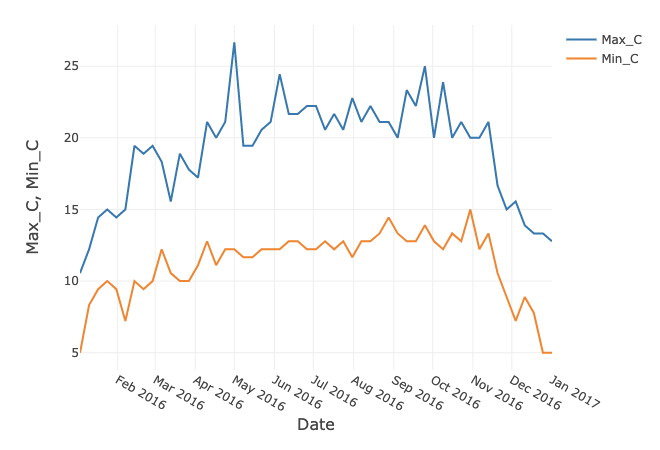
Figure 1. Max and Min in Celsius for San Francisco.
The shape of the graph is identical to the chart in the previous article, but the temperature scale is in Celsius.
Summary
In this article series, we have seen an example of Pushdown with Spark using the SingleStore Spark Connector. The key benefits of the SingleStore Spark Connector can be summarised as follows:
- Implemented as a native Spark SQL plugin.
- Accelerates ingest from Spark via compression.
- Supports data loading and extraction from database tables and Spark Dataframes.
- Integrates with the Catalyst query optimizer and supports robust SQL Pushdown.
- Accelerates ML workloads.
In the next article series, we’ll use Apache Kafka™ with SingleStore Pipelines. Stay tuned!
Recommend
About Joyk
Aggregate valuable and interesting links.
Joyk means Joy of geeK