

The Linked Open Data Cloud
source link: https://lod-cloud.net/
Go to the source link to view the article. You can view the picture content, updated content and better typesetting reading experience. If the link is broken, please click the button below to view the snapshot at that time.

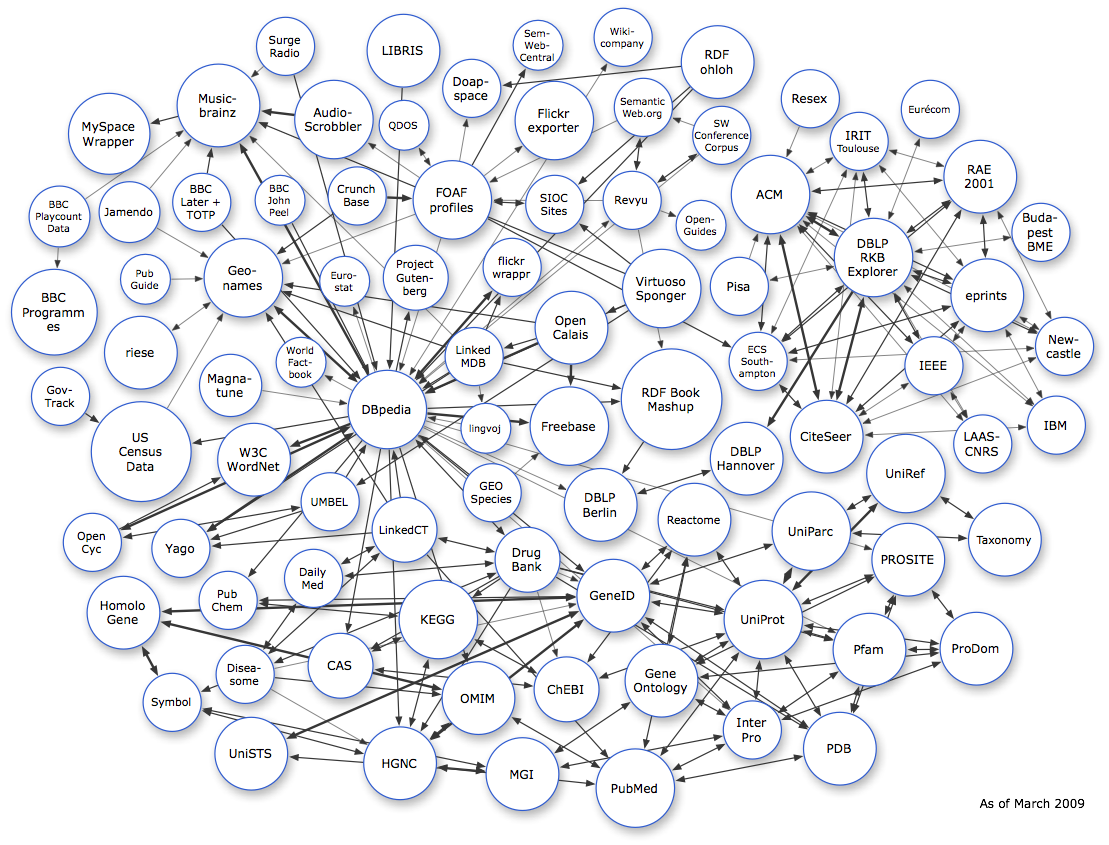
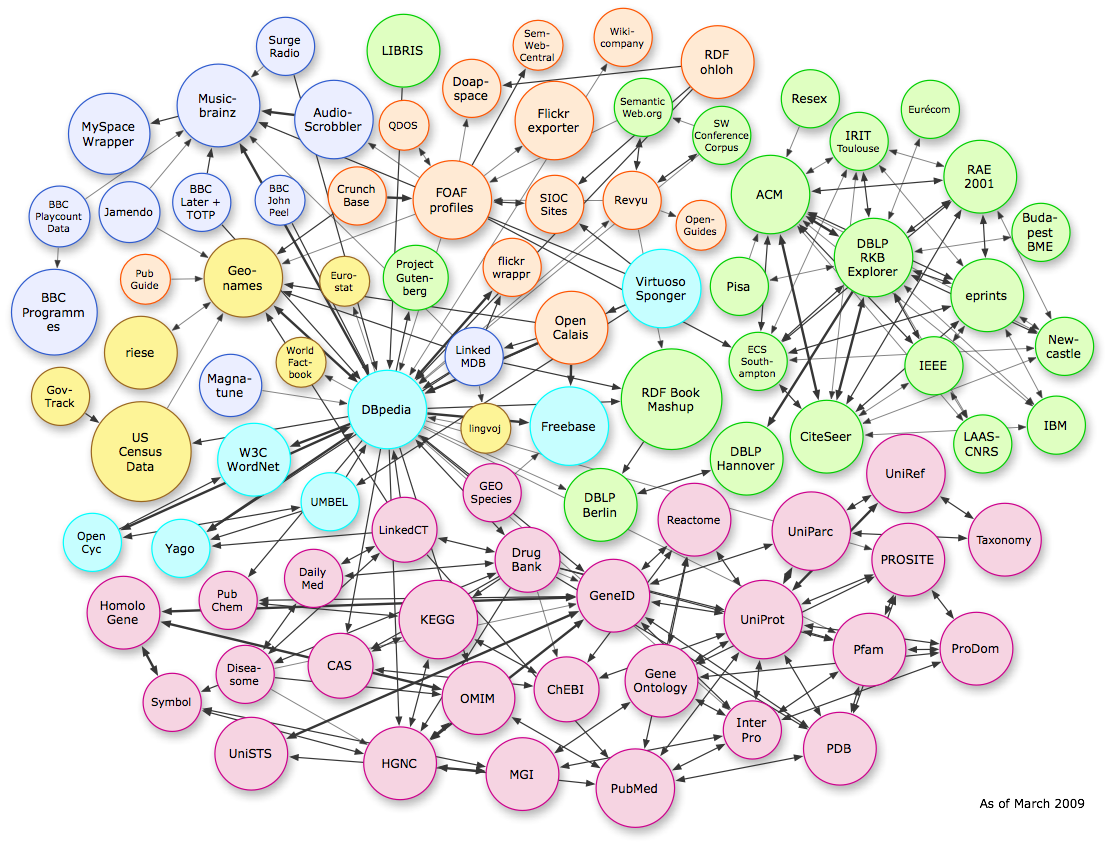
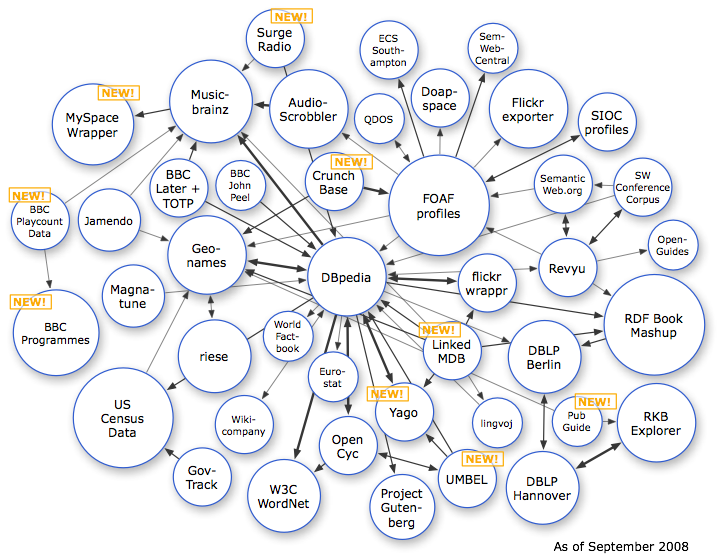
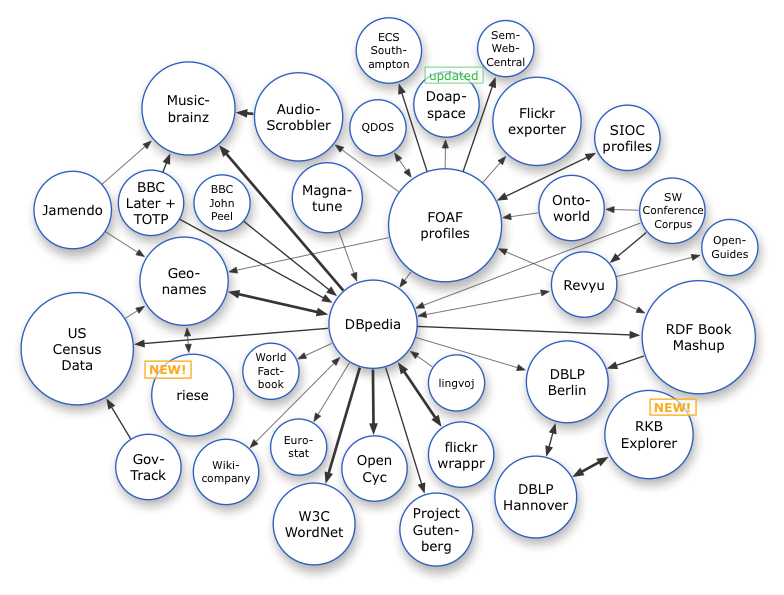
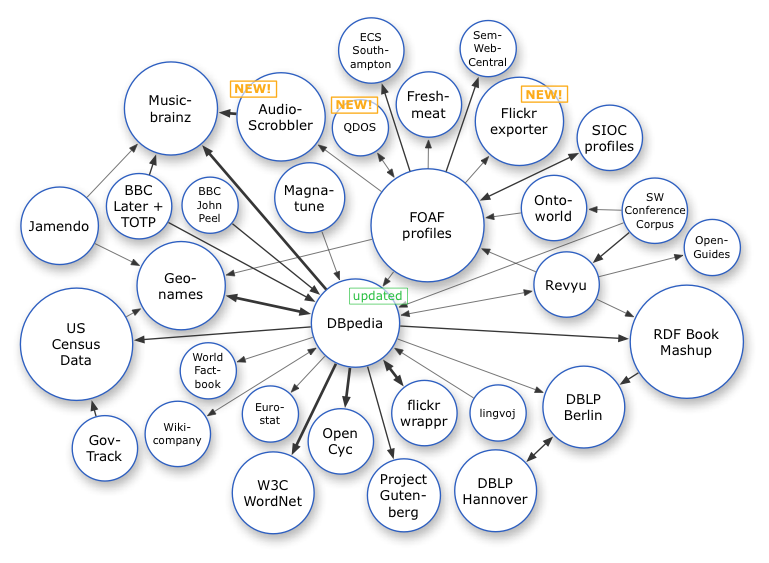
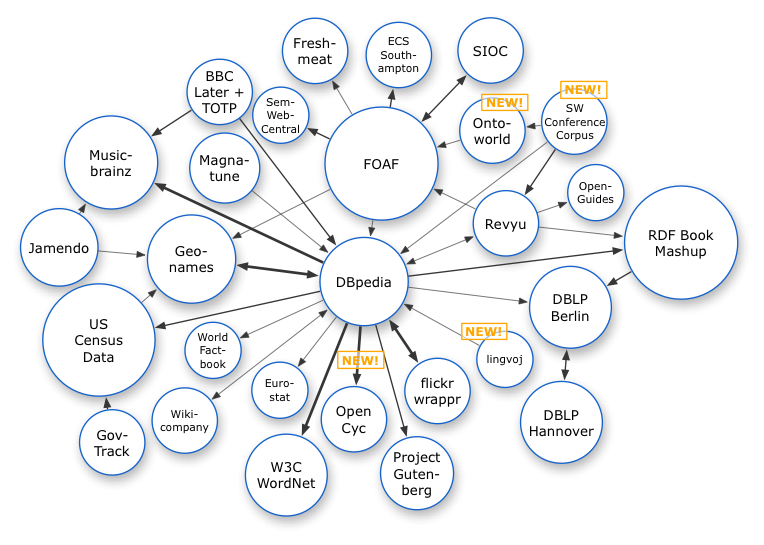
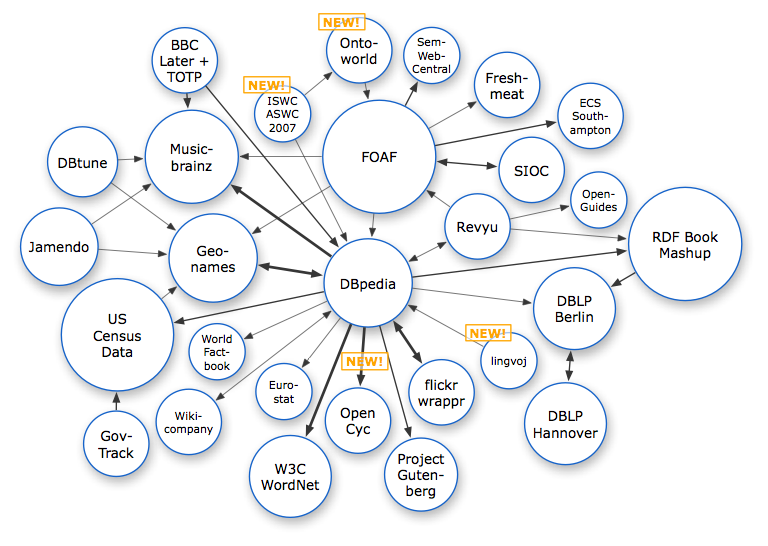
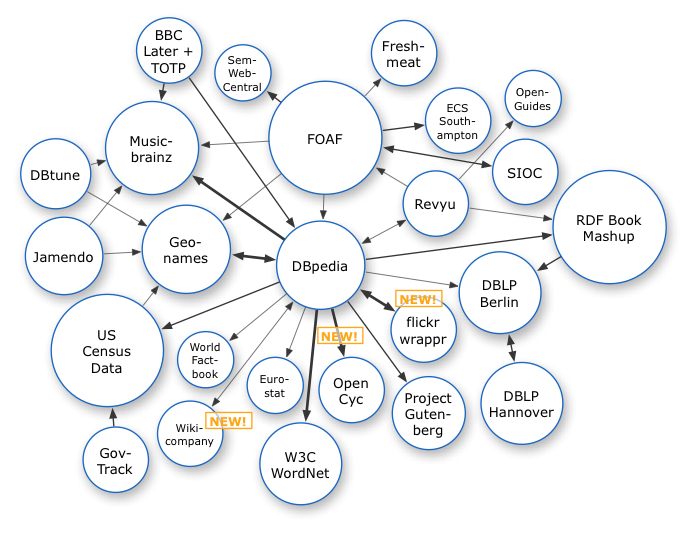
About the diagram
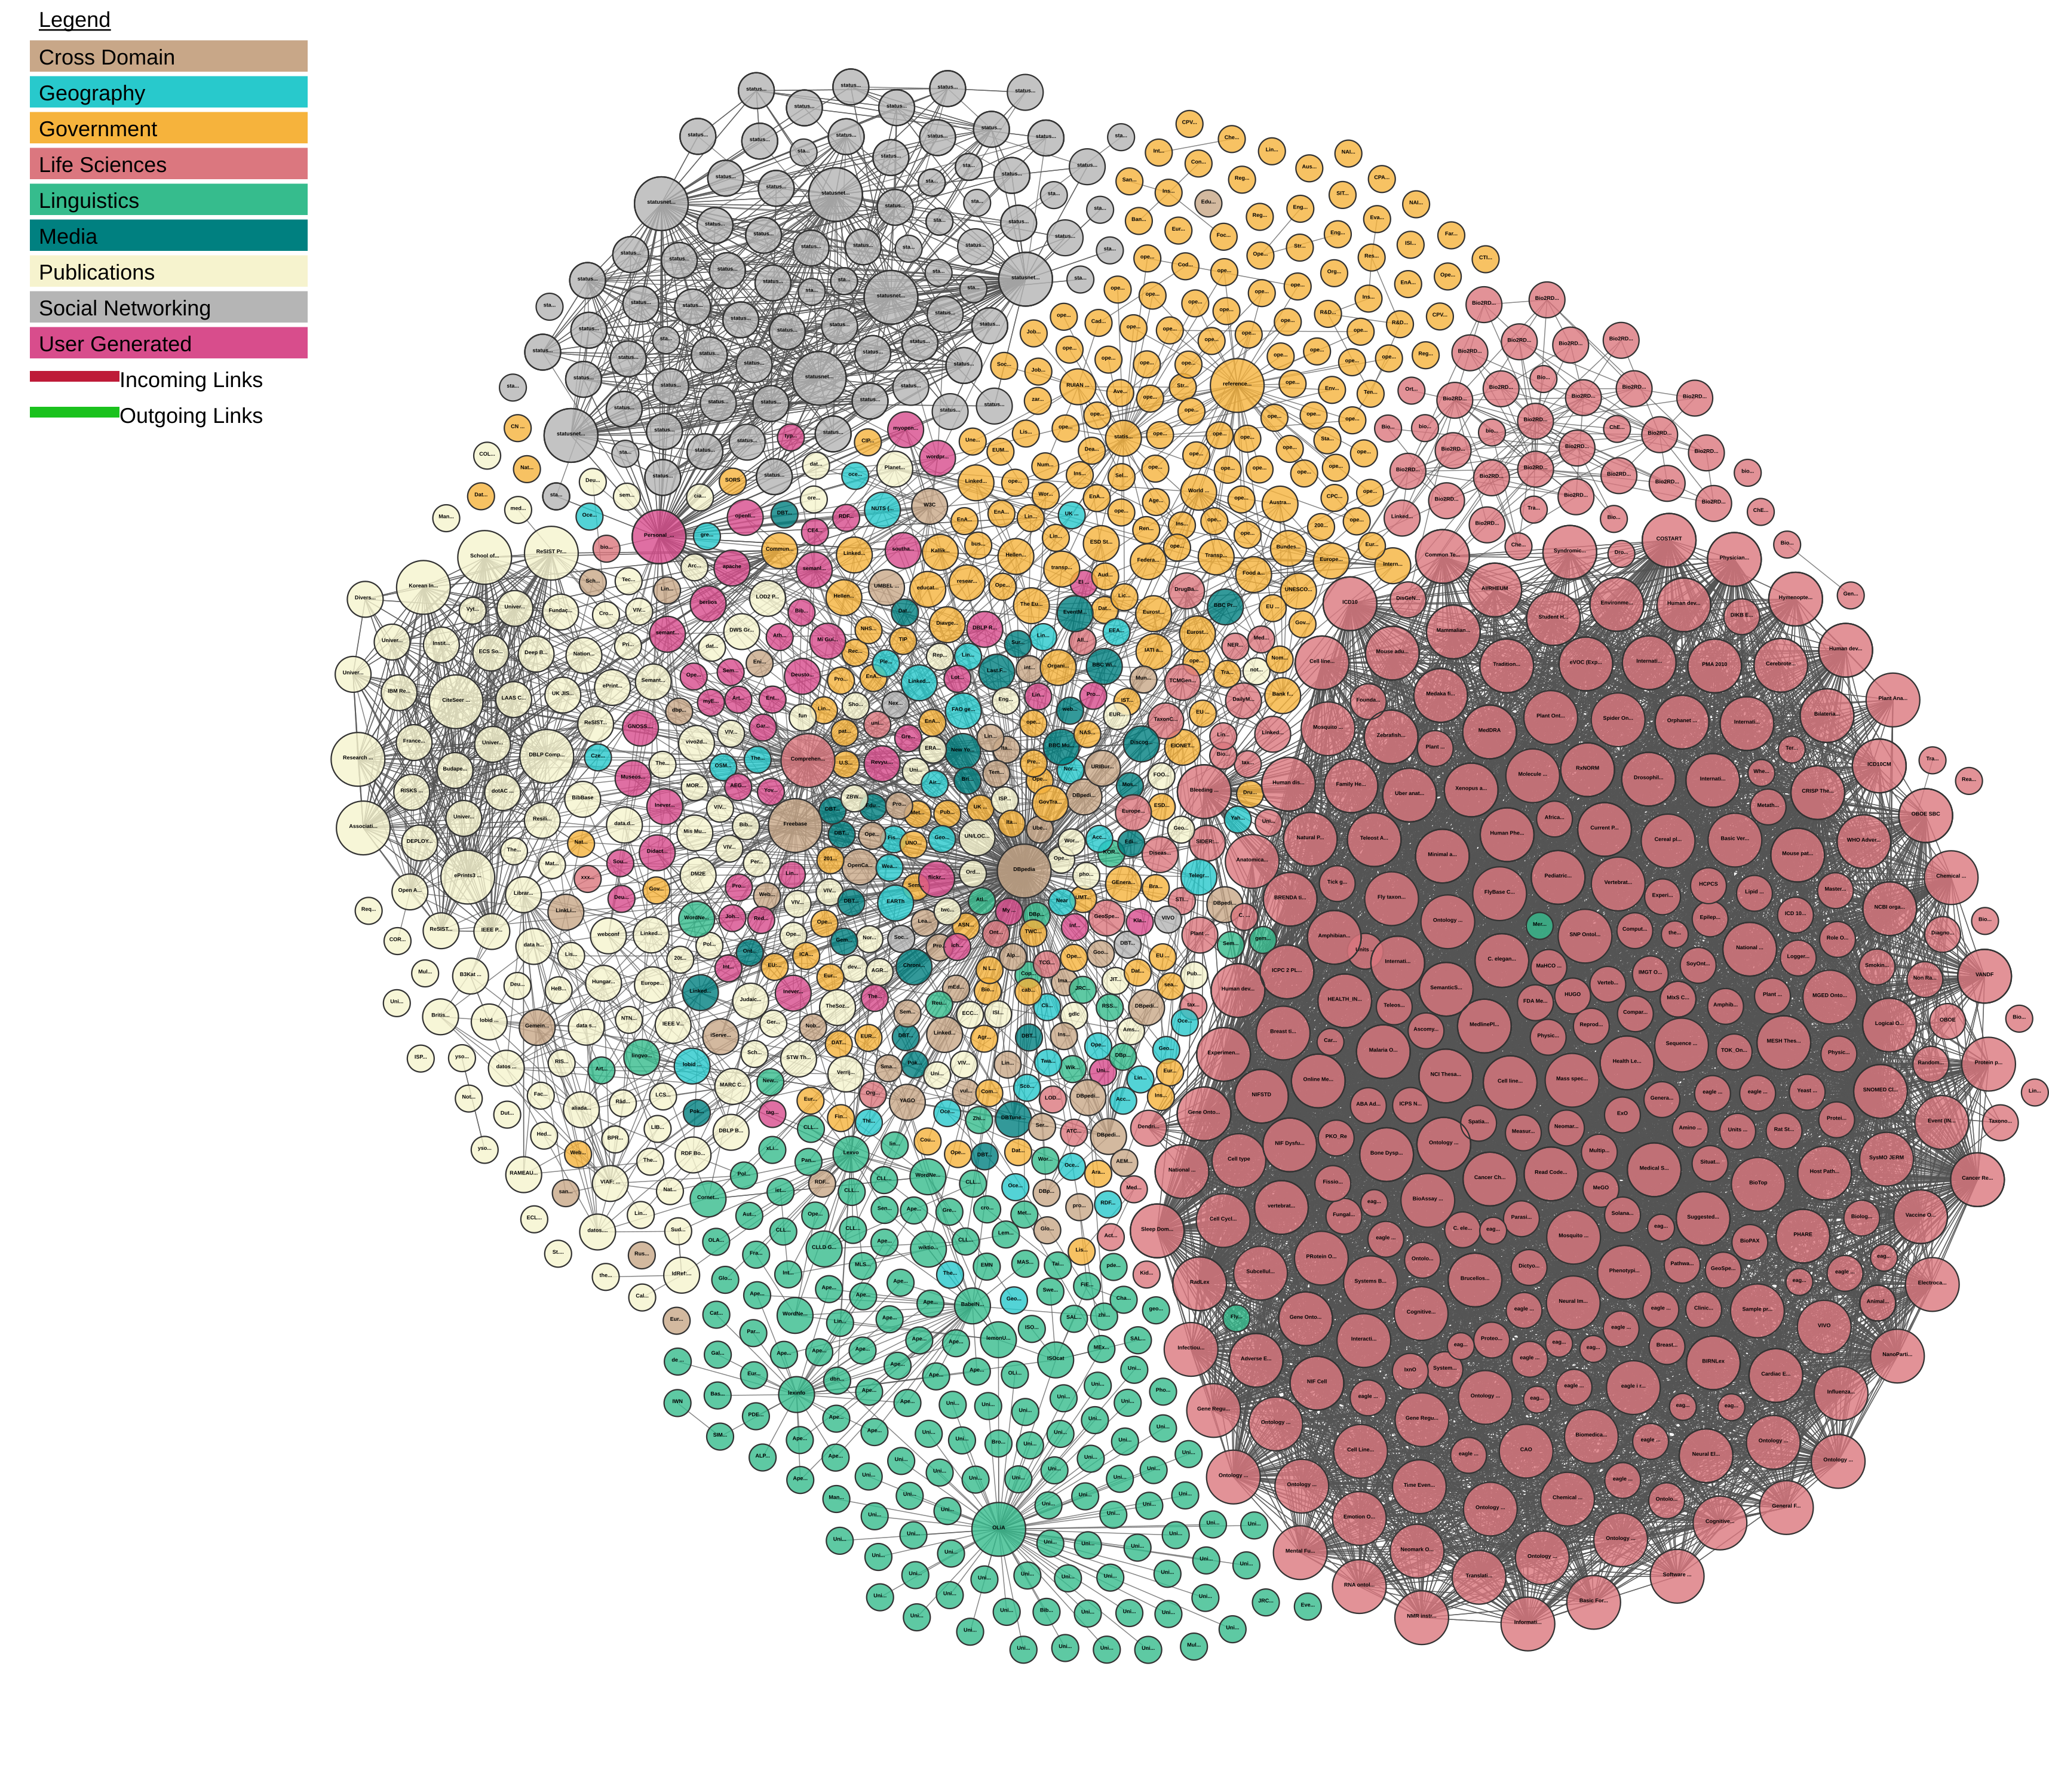
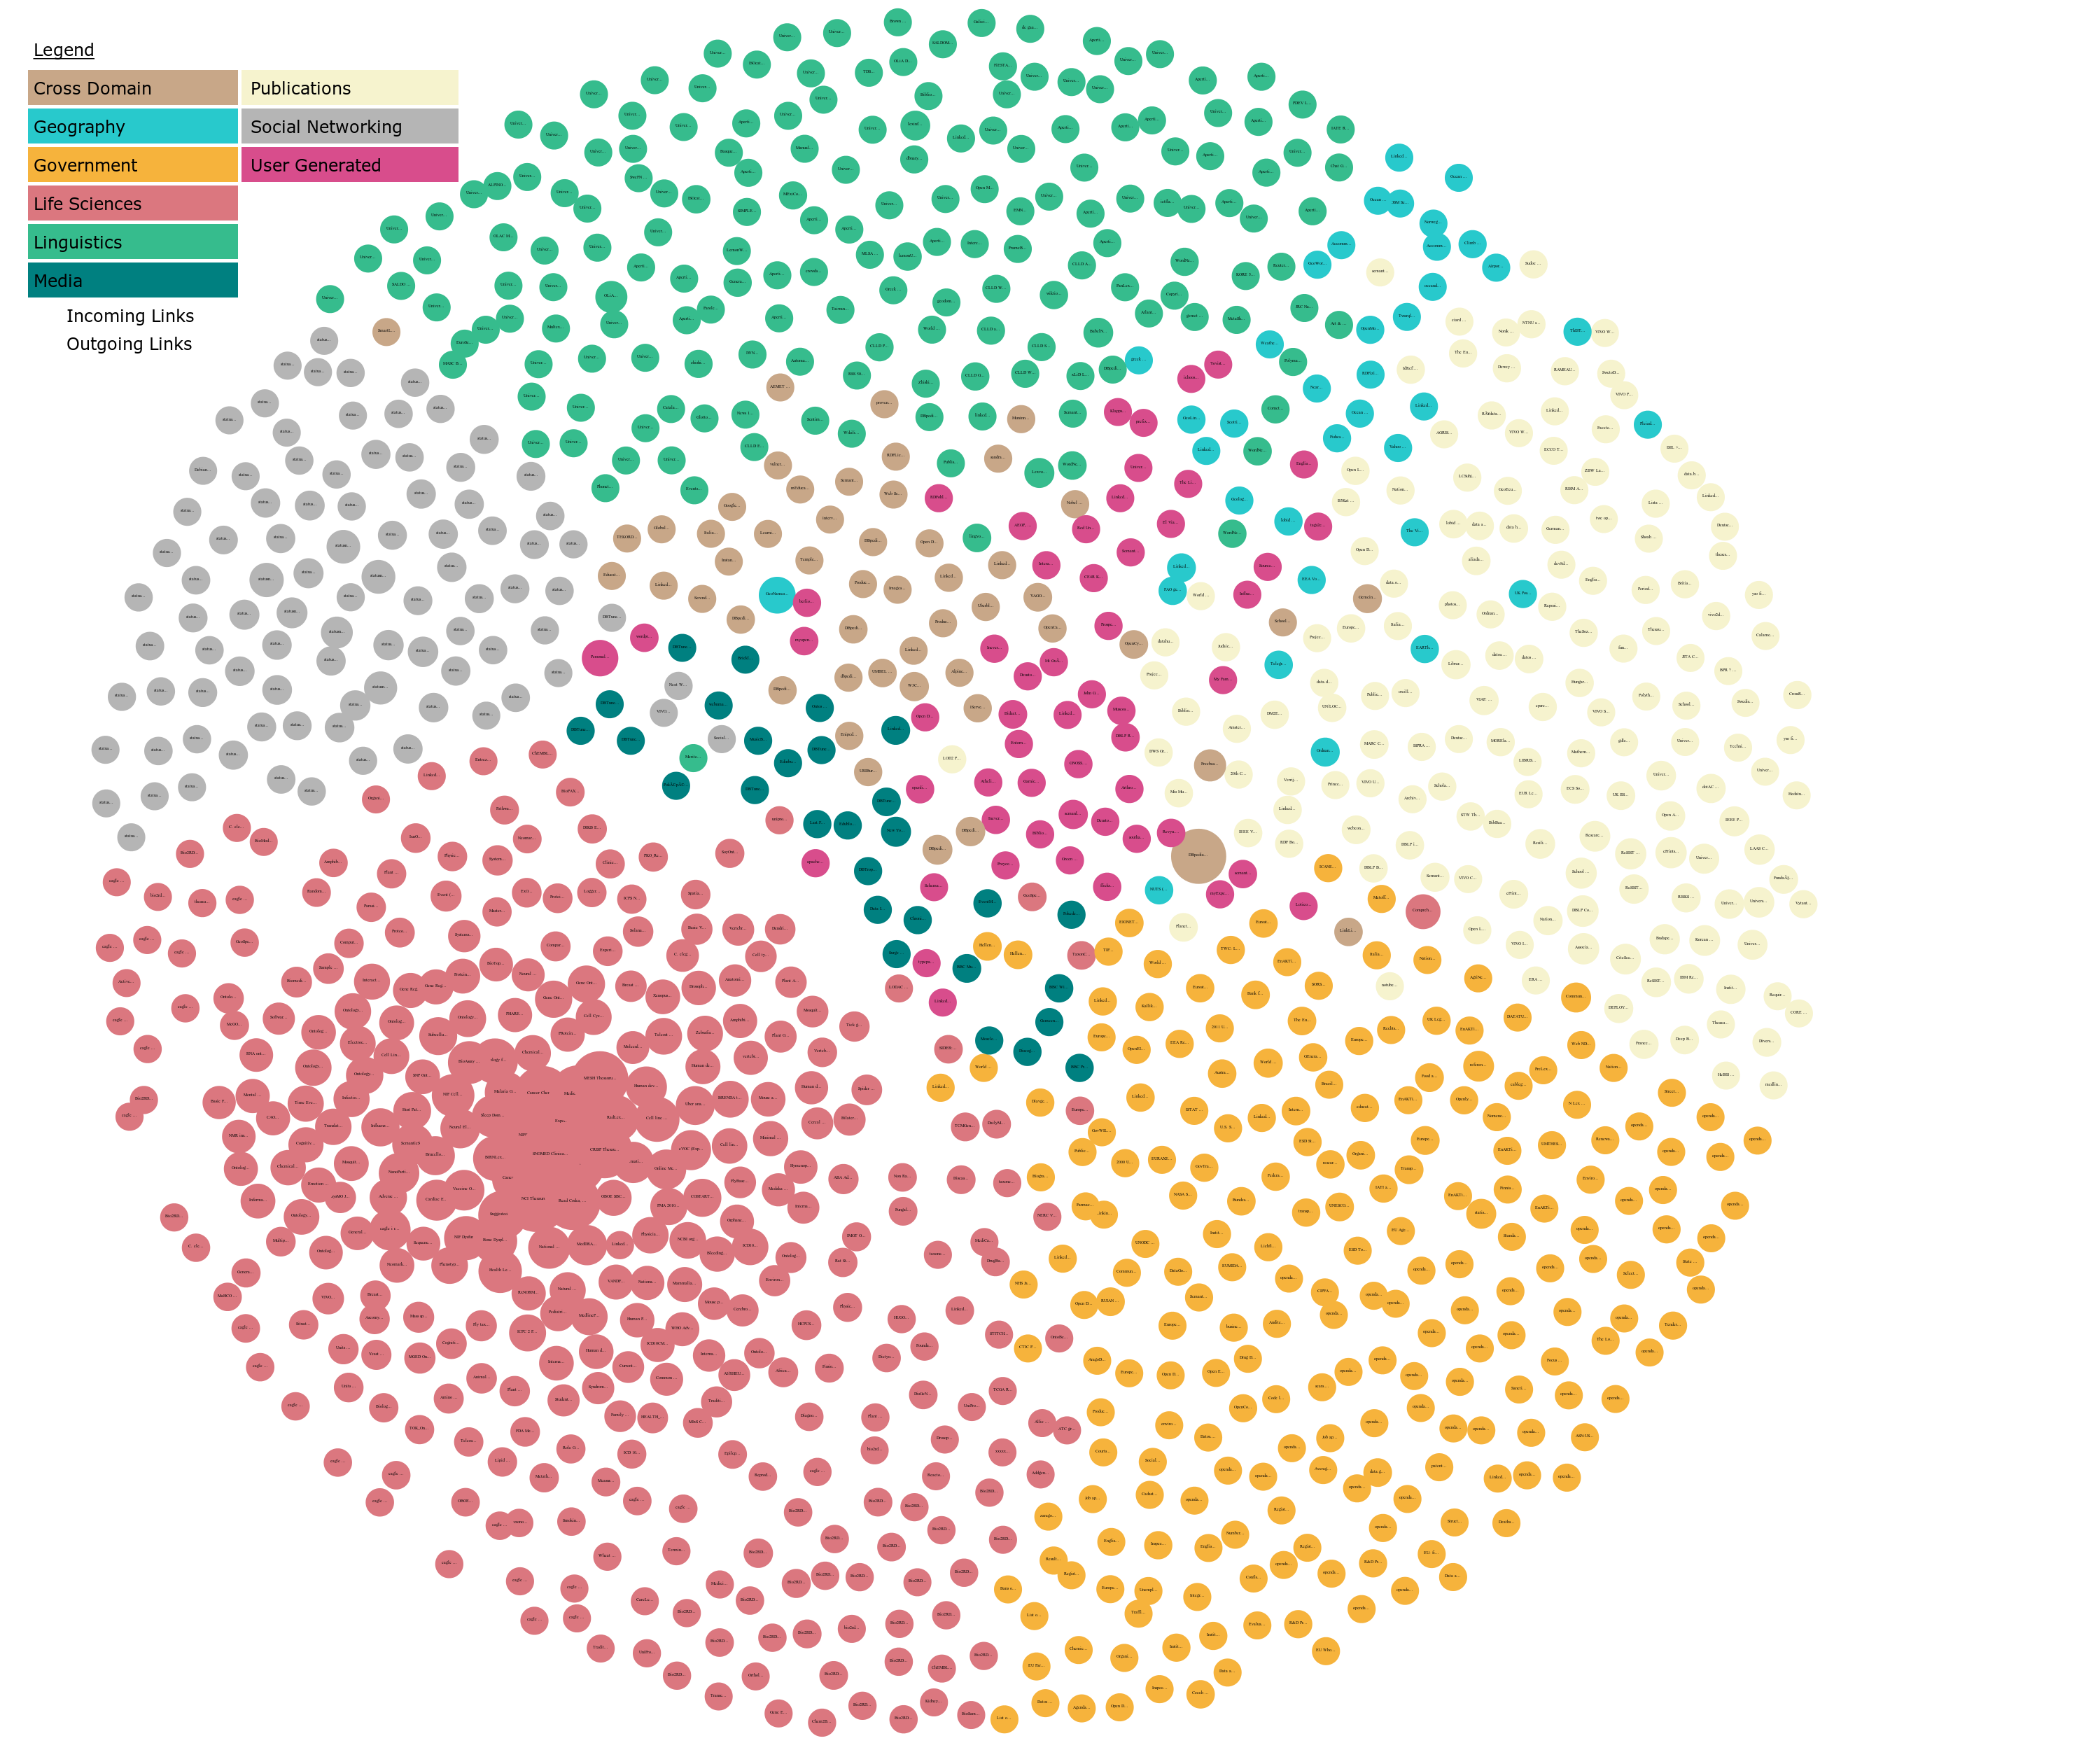
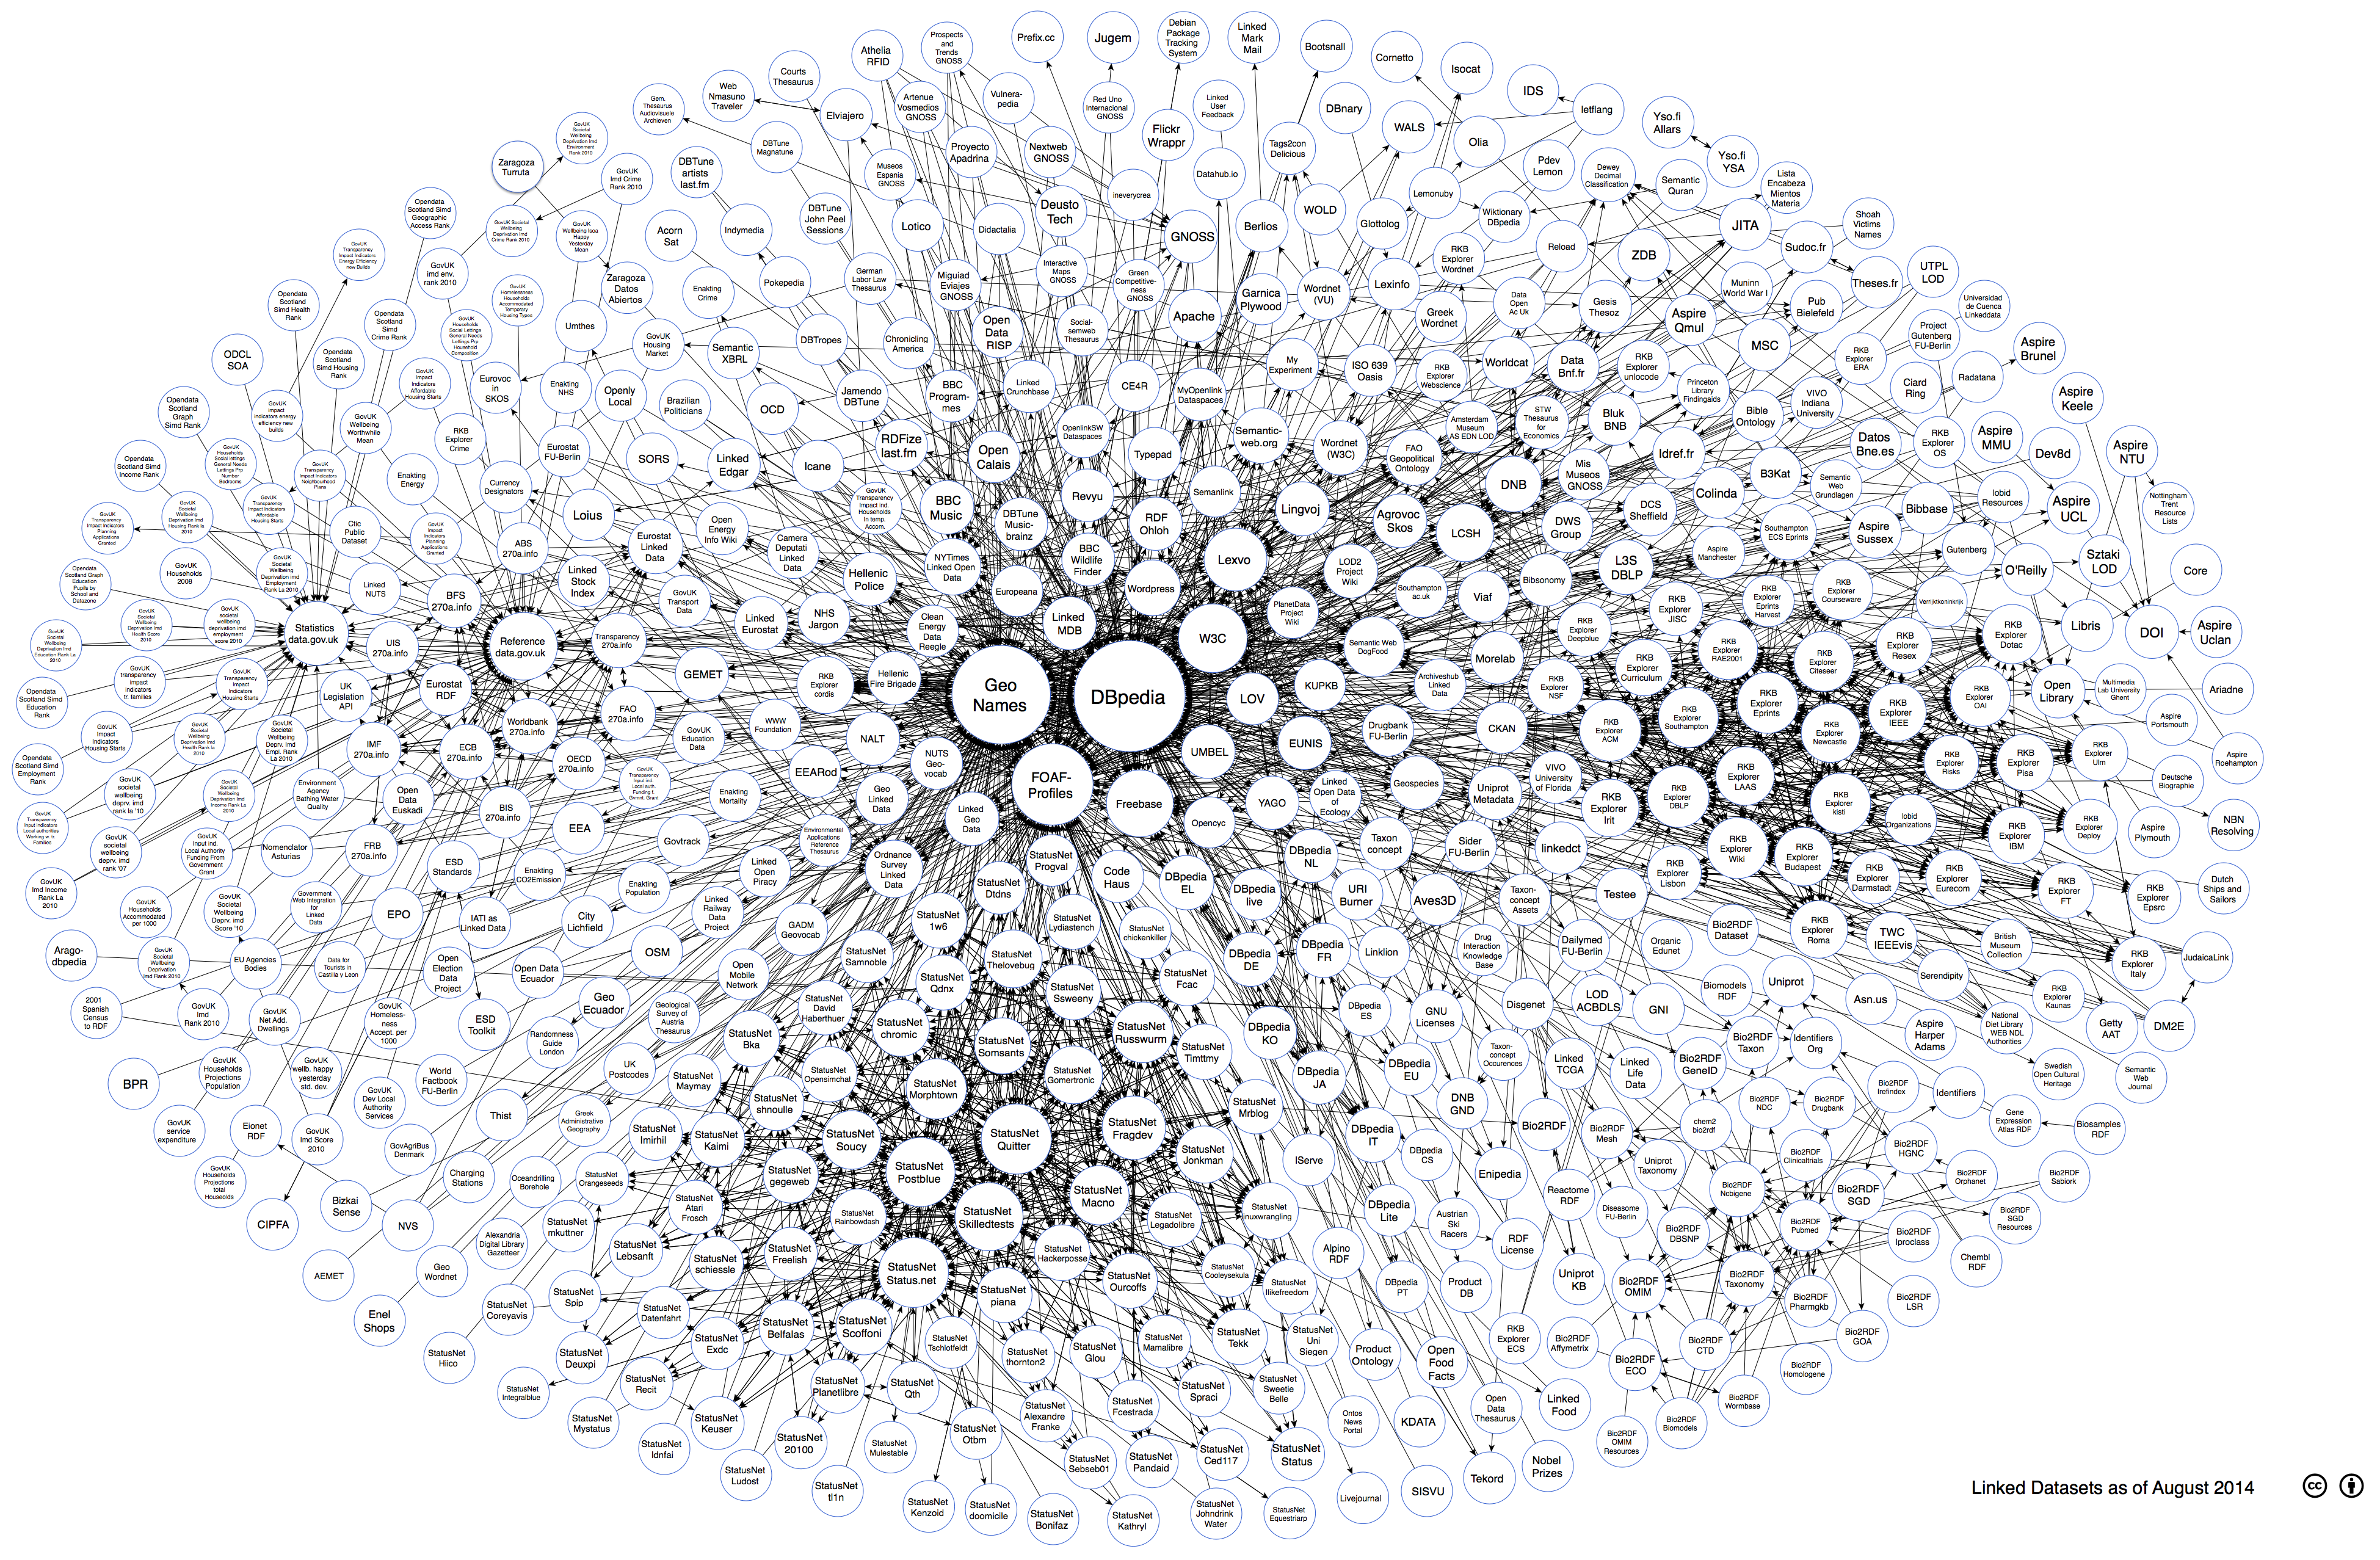
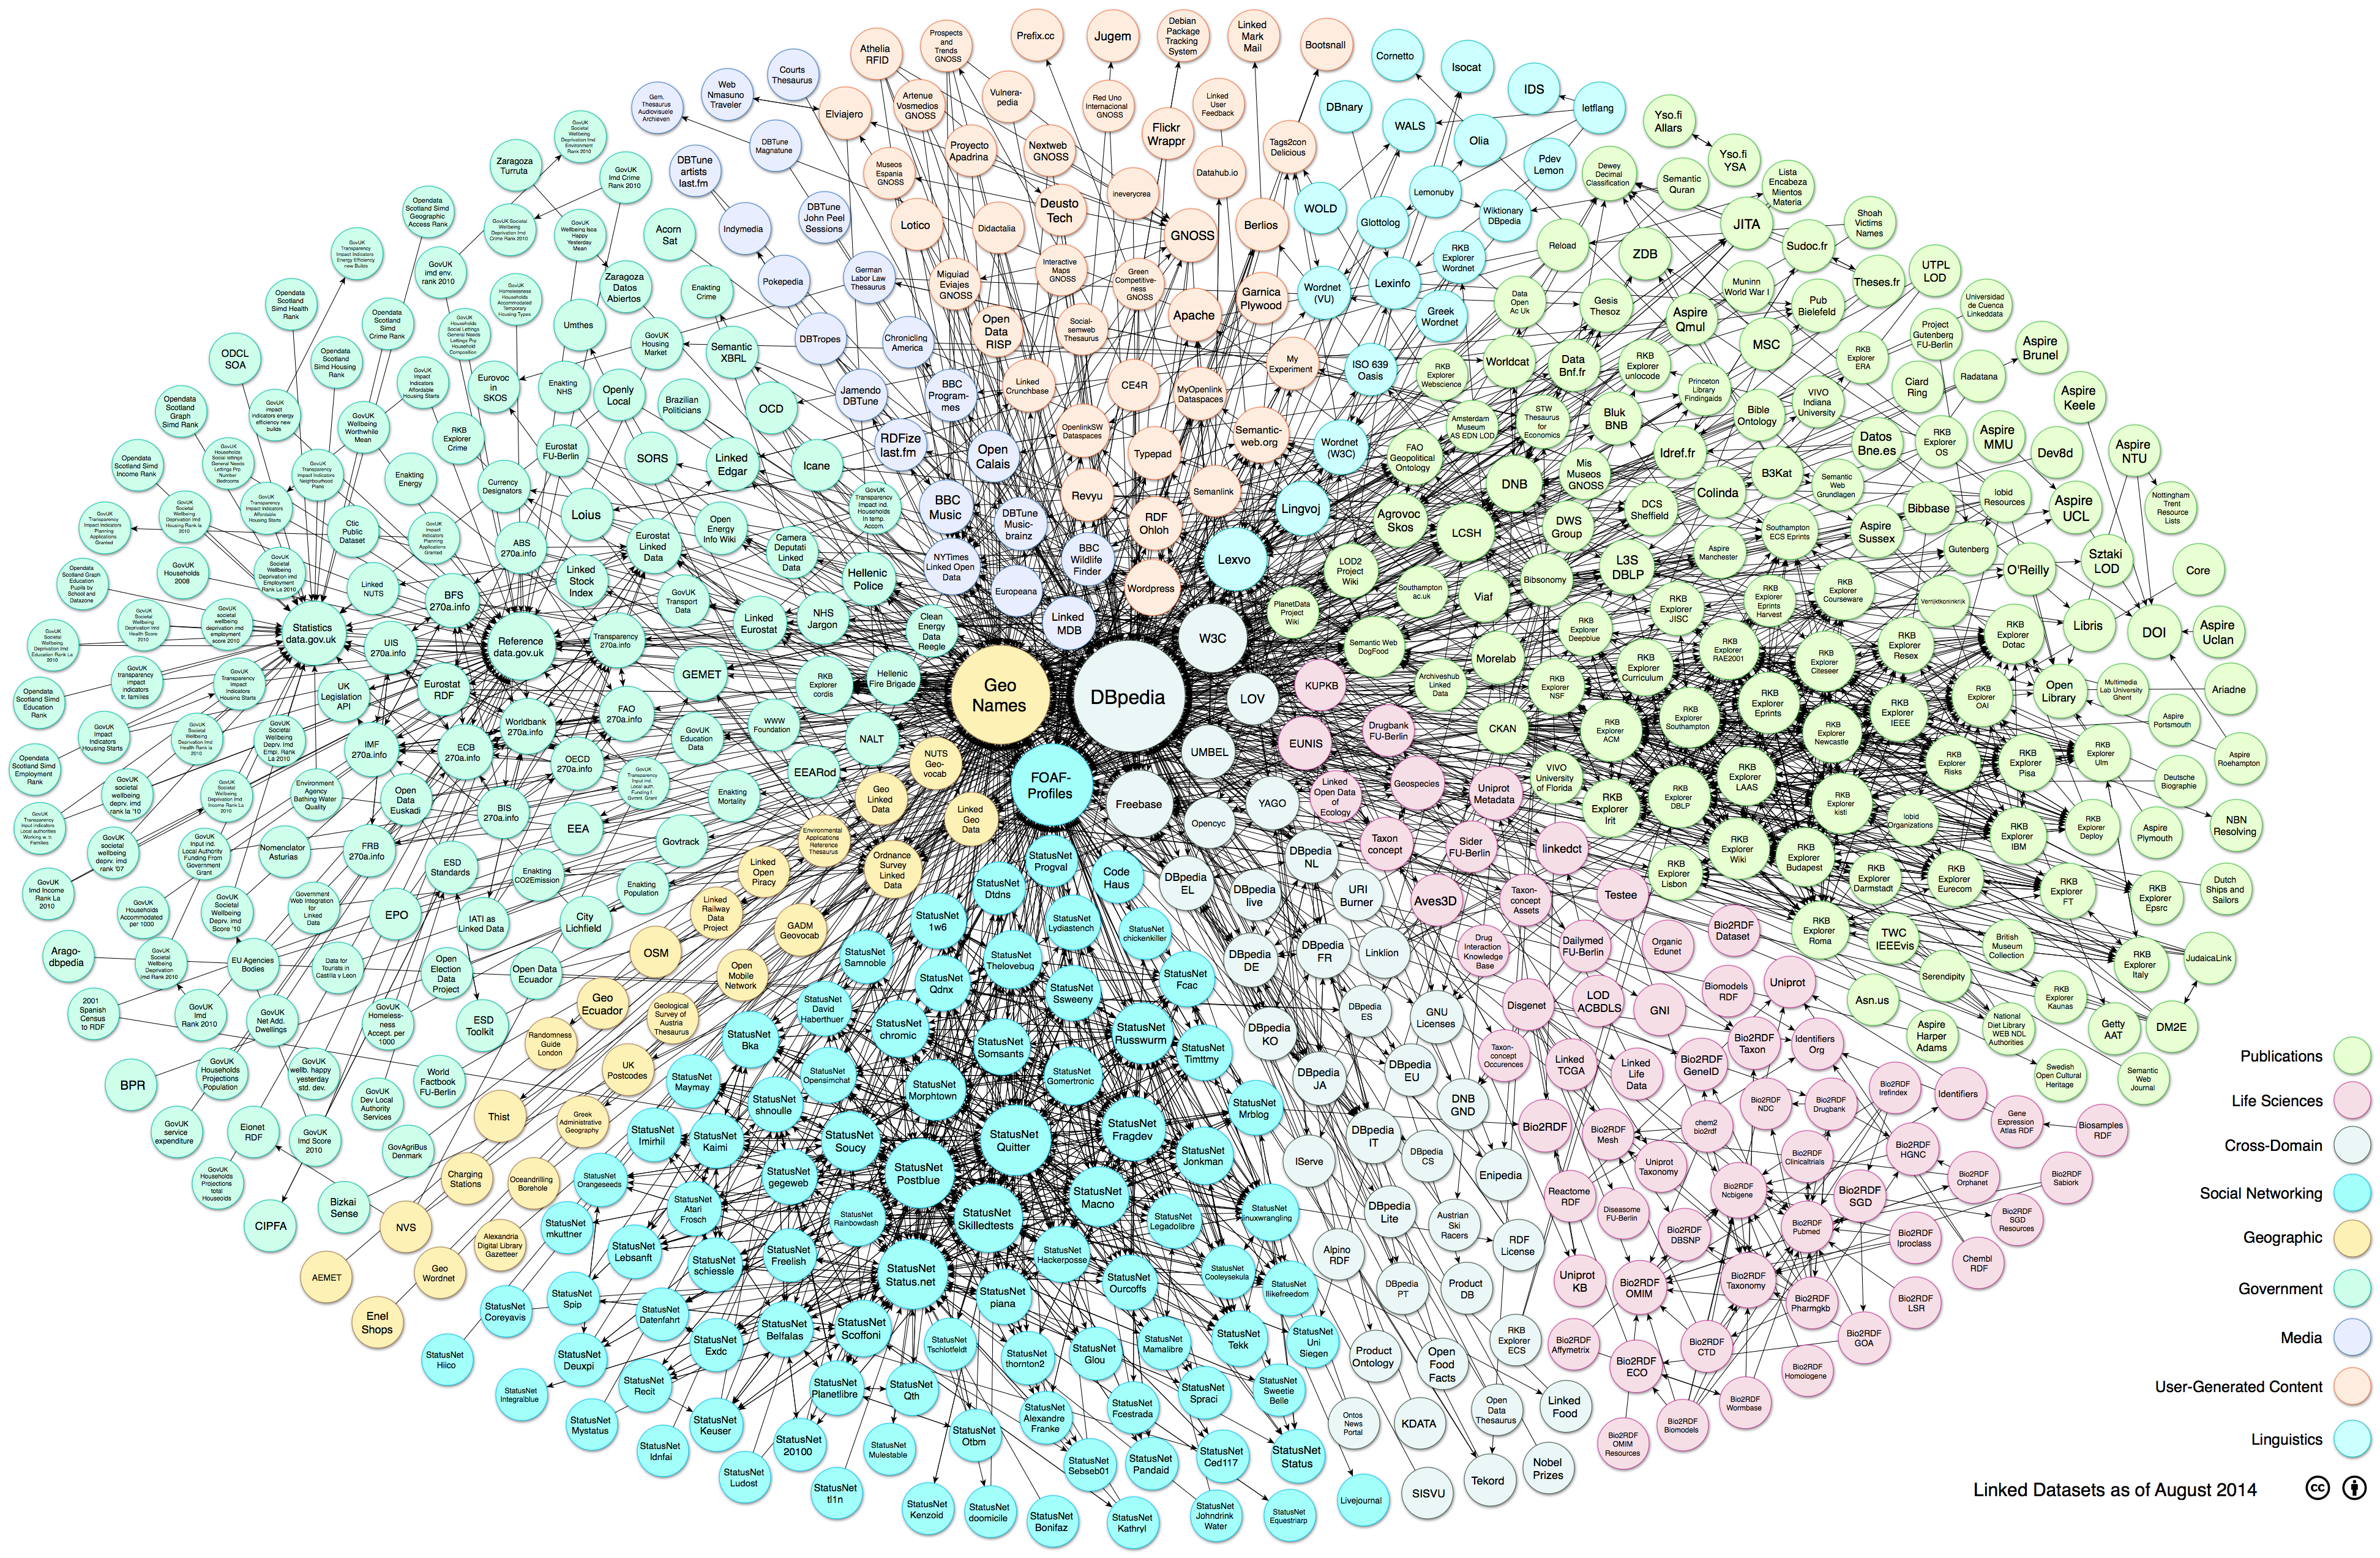
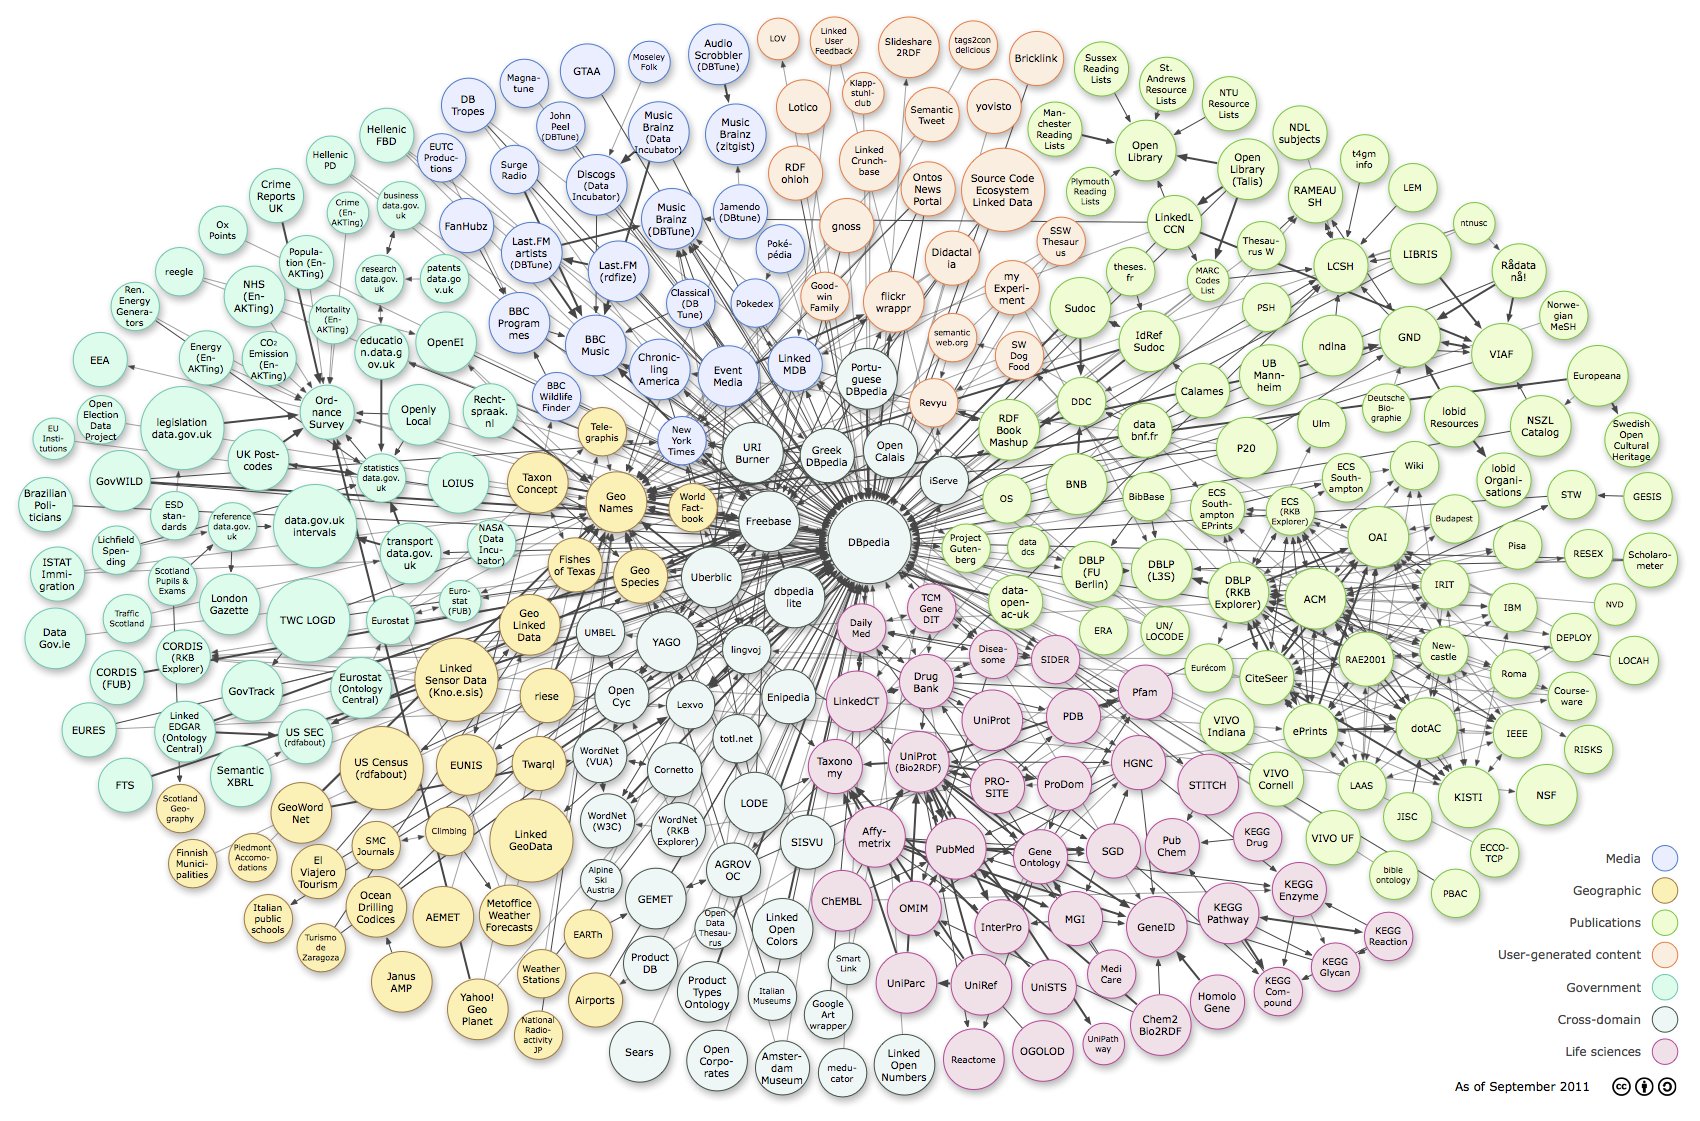
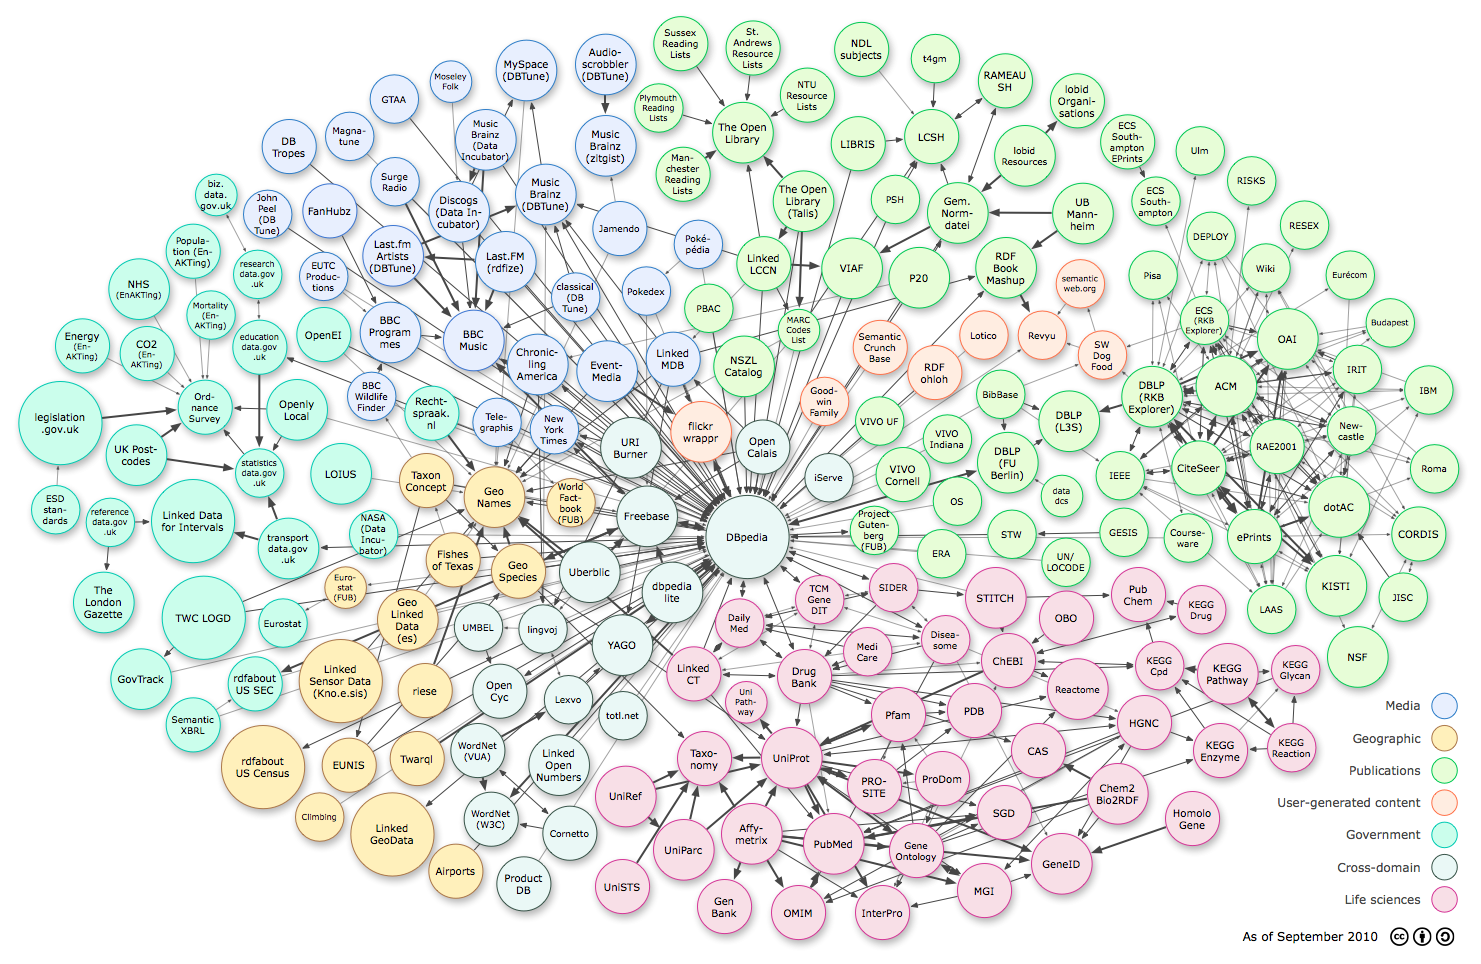
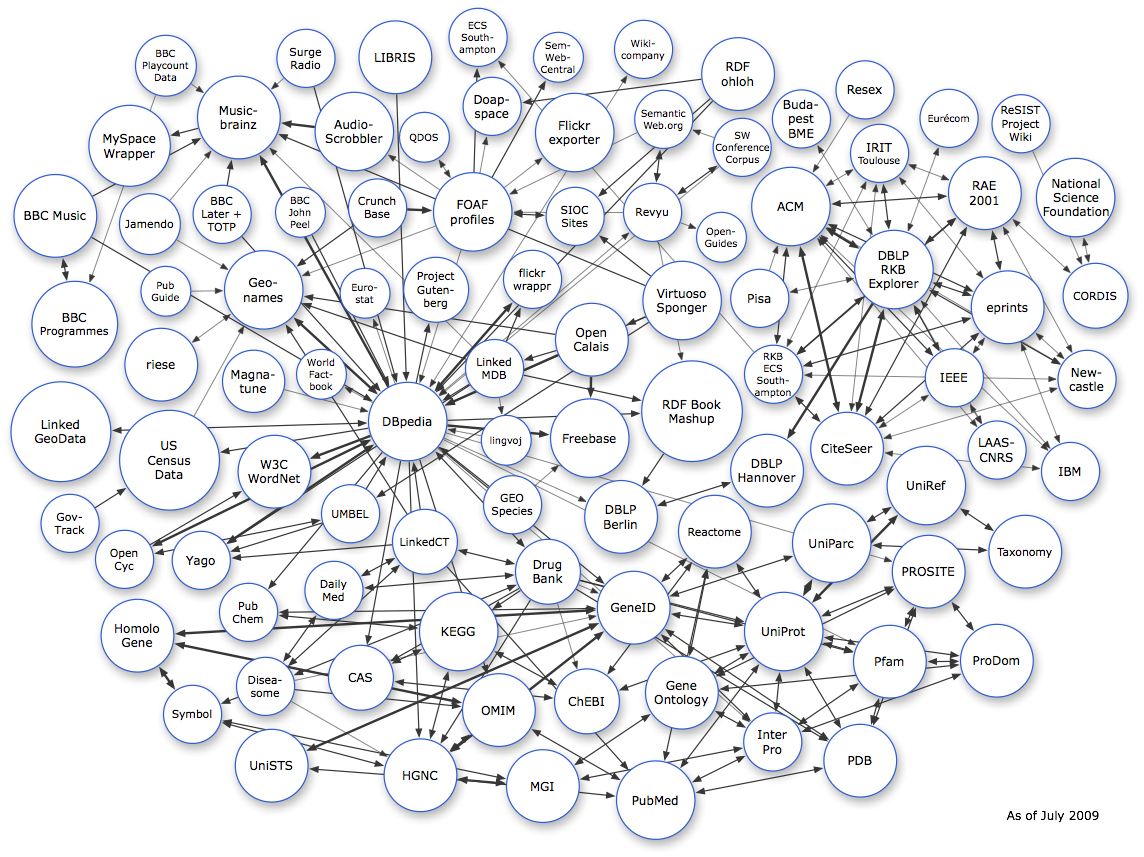
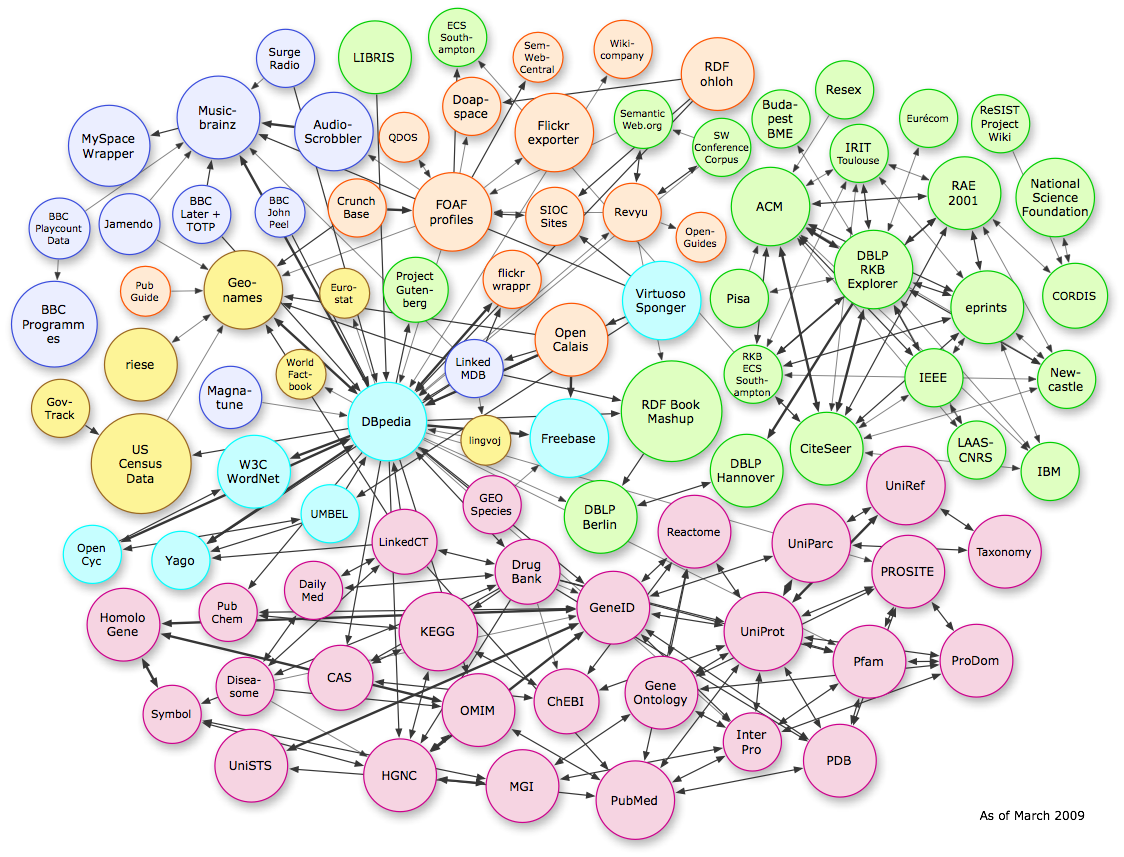
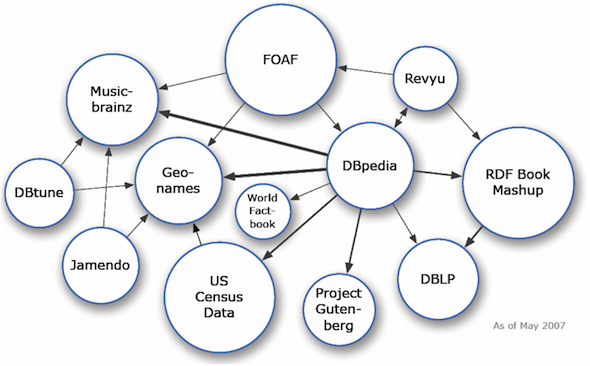
This web page is the home of the LOD cloud diagram. This image shows datasets that have been published in the Linked Data format.
The dataset currently contains 1301 datasets with 16283 links (as of May 2020)
You may reuse the diagram under the Creative Commons Attribution License. The diagrams on this website contain the attribution statement within the image, and if they are used without modification this attribution statement is sufficient. If you modify any images, for example by cropping out the attribution statement, please include a statement with the image stating that it was derived from lod-cloud.net.
Maintainers
The diagram is maintained by John P. McCrae for the Insight Centre for Data Analytics. The following people have previously maintained the diagram or have also helped in current development of the diagram:
Contributing to the Diagram
First, make sure that you publish data according to the Linked Data principles. We interpret this as:
- There must be resolvable http:// (or https://) URIs.
- They must resolve, with or without content negotiation, to RDF data in one of the popular RDF formats (RDFa, RDF/XML, Turtle, N-Triples).
- The dataset must contain at least 1000 triples. (Hence, your FOAF file most likely does not qualify.)
- The dataset must be connected via RDF links to a dataset that is already in the diagram. This means, either your dataset must use URIs from the other dataset, or vice versa. We arbitrarily require at least 50 links.
- Access of the entire dataset must be possible via RDF crawling, via an RDF dump, or via a SPARQL endpoint.
You may add a dataset by submitting it at this form here The process for adding datasets is still under development, please contact John P. McCrae for any issues.
Data and code
The raw data is available here. The diagrams are generated by LOD Cloud Draw.
History
WhiteColoredGraph file Dataset list Datasets 2021-05-05pngsvgjson13012020-05-20 png svg json 1,255 2019-03-29 png svg 1,239 2019-01-08 png svg 1,234 2018-11-26 png svg 1,231 2018-10-31 png svg 1,229 2018-08-28 png svg 1,224 2018-07-30 png svg 1,220 2018-06-28 png svg 1,205 2018-05-30 png svg json 1,186 2018-04-30 png svg json 1,184 2017-08-22 png svg json tsv 1,163 2017-02-20 png svg 1,139 2017-01-26 png svg 1,146 2014-08-30 png pdf svg png pdf svg 570 2011-09-19 png pdf svg png pdf svg 295 2010-09-22 png pdf svg png pdf svg 203 2009-07-14 png pdf svg 95 2009-03-27 png pdf svg png pdf svg 93 2009-03-05 png pdf svg png pdf svg 89 2008-09-18 png pdf svg 45 2008-03-31 png pdf svg 34 2008-02-28 png pdf svg 32 2007-11-10 png pdf svg 28 2007-11-07 png 28 2007-10-08 png 25 2007-05-01 png 12
Privacy
Please review our privacy policy here.Recommend
About Joyk
Aggregate valuable and interesting links.
Joyk means Joy of geeK