

Using pgbench With CockroachDB Serverless
source link: https://dzone.com/articles/using-pgbench-with-cockroachdb-serverless
Go to the source link to view the article. You can view the picture content, updated content and better typesetting reading experience. If the link is broken, please click the button below to view the snapshot at that time.
Previous Articles
Motivation
I've worked at Cockroach Labs for almost two years. In the last two years, I've come across many products in the PostgreSQL ecosystem. Surprisingly, pgbench was one of those utilities I've heard about but never really tried on my own. As coincidence may have it, in the last few weeks, I had two customers with specific requirements that fit well with what pgbench can provide. I decided to spend a couple of days and evaluate this tool with CockroachDB.
From the pgbench documentation:
pgbench is a simple program for running benchmark tests on PostgreSQL. It runs the same sequence of SQL commands over and over, possibly in multiple concurrent database sessions, and then calculates the average transaction rate (transactions per second). By default, pgbench tests a scenario that is loosely based on TPC-B, involving five SELECT, UPDATE, and INSERT commands per transaction. However, it is easy to test other cases by writing your own transaction script files.
High-Level Steps
- Provision a CockroachDB cluster
- Install pgbench
- Set environment variables
- Initialize the benchmark
- Run the workload
- Run with extended protocol
- Run with prepared protocol
- Run an arbitrary workload
- Clean up
Step-by-Step Instructions
Deploy a CockroachDB Cluster
For the sake of brevity, I will defer to our docs for deployment instructions. Choose your own poison. This tutorial will cover CockroachDB Serverless, which requires no credit card to spin up and a free forever tier up to certain storage and compute limits.
Install pgbench
pgbench comes bundled with postgresql binary. If you have it installed, you already have access to pgbench. You may confirm you have it installed by running
pgbench --version
pgbench (PostgreSQL) 13.4Otherwise, use your OS's package manager to install
brew to install postgresql
I've run into an issue with pgbench function parsing on older versions, specifically on Ubuntu. It is preferred to run the latest version, in which case you may have to update the repos to include the latest version and pass it to the installer. i.e. postgresql-13.
Set Environment Variables for Convenience and Readability
You can find the details of your serverless cluster in the "Connect" modal under connection parameters.
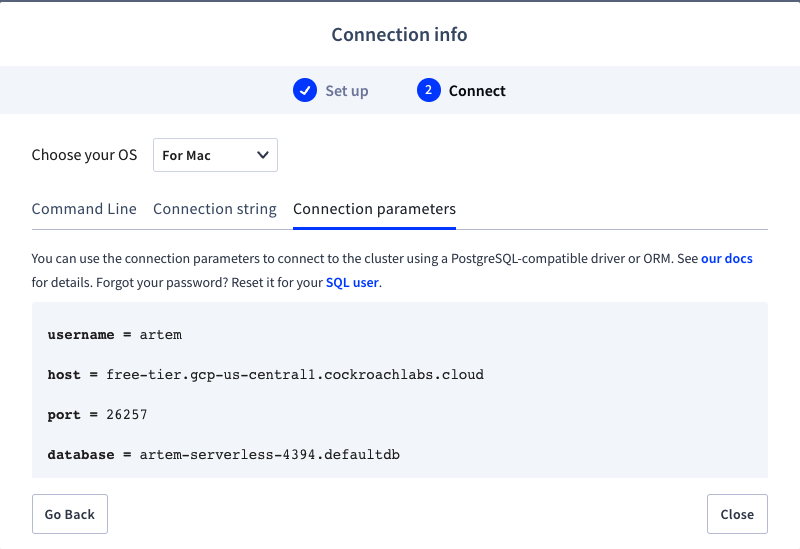
export DB_HOST='free-tier.gcp-us-central1.cockroachlabs.cloud'

export DB_INSTANCE=artem-serverless-4394
Export Password to Reduce Typing
If you're using a secure cluster, which we highly recommend, pgbench will prompt for a password, it is more convenient to save the password in an environment variable than typing it out each time, not to mention more secure as well!
See my blog on step by step instructions to save the the password in a .pgpass file.
export PGPASSFILE='/Users/artem/.pgpass'Initialize the Benchmark
pgbench \

 --initialize \

 --host=${DB_HOST} \

 --username=artem \

 --port=26257 \

 --no-vacuum \

 --scale=10 \

${DB_INSTANCE}.defaultdb
dropping old tables...
creating tables...
NOTICE: storage parameter "fillfactor" is ignored
NOTICE: storage parameter "fillfactor" is ignored
NOTICE: storage parameter "fillfactor" is ignored
generating data (client-side)...
1000000 of 1000000 tuples (100%) done (elapsed 12.09 s, remaining 0.00 s)
creating primary keys...
NOTICE: primary key changes are finalized asynchronously; further schema changes on this table may be restricted until the job completes
NOTICE: primary key changes are finalized asynchronously; further schema changes on this table may be restricted until the job completes
NOTICE: primary key changes are finalized asynchronously; further schema changes on this table may be restricted until the job completes
done in 101.28 s (drop tables 0.05 s, create tables 0.20 s, client-side generate 50.62 s, primary keys 50.42 s).Since we're running a default benchmark, we can pass an initialize flag to create the necessary tables and load sample data.
  schema_name |    table_name    | type  | owner | estimated_row_count | locality

--------------+------------------+-------+-------+---------------------+-----------

  public      | pgbench_accounts | table | artem |             1000000 | NULL

  public      | pgbench_branches | table | artem |                  10 | NULL

  public      | pgbench_history  | table | artem |                   0 | NULL

  public      | pgbench_tellers  | table | artem |                 100 | NULL
Another two flags I'll touch on here are --no-vacuum and --scale. Looking at the documentation, scale controls the volume we want to test at. In CockroachDB, we also need to run --no-vacuum option as CockroachDB does not have a vacuum concept. You will also receive an error if you attempt to omit the flag.
pgbench: fatal: query failed: ERROR:  at or near "vacuum": syntax error

DETAIL:  source SQL:

vacuum analyze pgbench_branches

^

pgbench: query was: vacuum analyze pgbench_branches
Run the Workload
pgbench \

 --host=${DB_HOST} \

 --no-vacuum \

 --client=8 \

 --jobs=8 \

 --username=artem \

 --port=26257 \

 ${DB_INSTANCE}.defaultdb \

 -T 60 \

 -P 5
progress: 5.0 s, 24.6 tps, lat 289.436 ms stddev 40.693
progress: 10.0 s, 28.6 tps, lat 282.661 ms stddev 22.865
progress: 15.0 s, 27.8 tps, lat 286.570 ms stddev 32.272
progress: 20.0 s, 28.0 tps, lat 287.160 ms stddev 30.306
progress: 25.0 s, 27.8 tps, lat 284.586 ms stddev 27.746
progress: 30.0 s, 28.2 tps, lat 287.077 ms stddev 27.707
progress: 35.0 s, 28.2 tps, lat 285.067 ms stddev 24.002
progress: 40.0 s, 27.6 tps, lat 286.504 ms stddev 29.161
progress: 45.0 s, 27.4 tps, lat 292.301 ms stddev 35.307
progress: 50.0 s, 27.8 tps, lat 288.569 ms stddev 34.413
progress: 55.0 s, 27.6 tps, lat 289.242 ms stddev 30.722
progress: 60.0 s, 27.8 tps, lat 287.496 ms stddev 31.708
transaction type: <builtin: TPC-B (sort of)>
scaling factor: 10
query mode: simple
number of clients: 8
number of threads: 8
duration: 60 s
number of transactions actually processed: 1665
latency average = 287.160 ms
latency stddev = 30.842 ms
tps = 27.632032 (including connections establishing)
tps = 27.804162 (excluding connections establishing)schema_name | table_name | type | owner | estimated_row_count | locality
--------------+------------------+-------+-------+---------------------+-----------
public | pgbench_accounts | table | artem | 1000000 | NULL
public | pgbench_branches | table | artem | 10 | NULL
public | pgbench_history | table | artem | 1665 | NULL
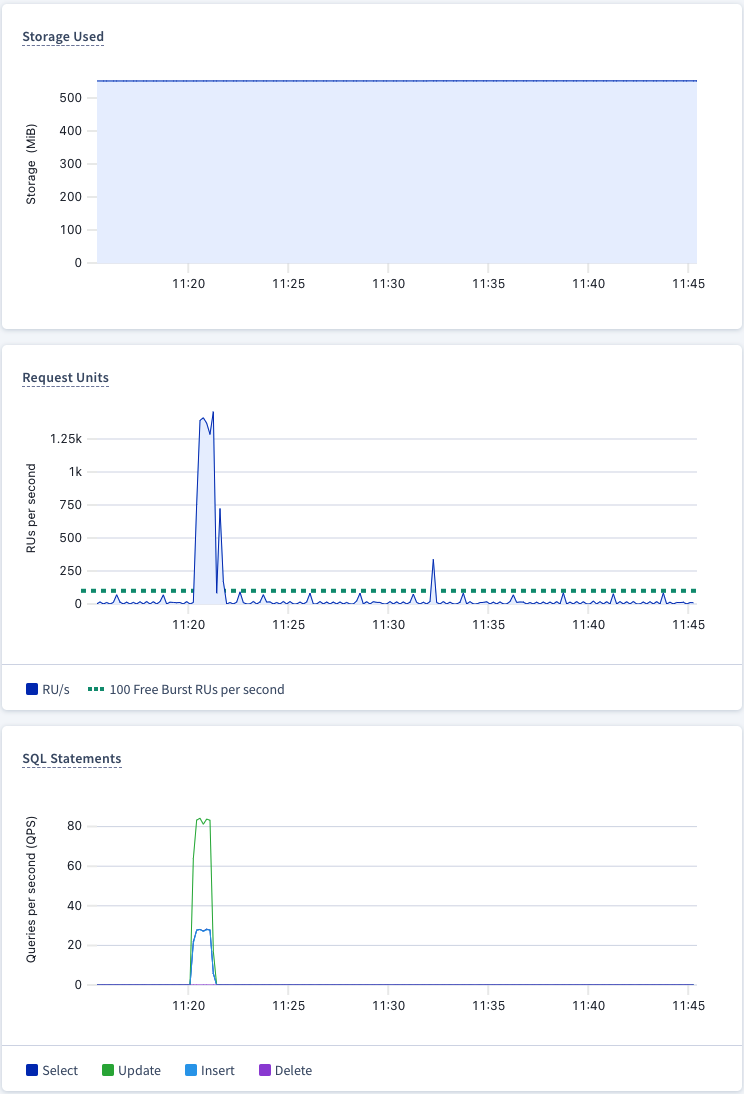
public | pgbench_tellers | table | artem | 100 | NULLNeedless, to say, running a benchmark for 60 seconds is not an accurate representation of a benchmark. It may take a few tries to get a sweet spot for the number of clients and jobs. It depends on the client machine specification this utility is executed from. One way to think about it, client is the number of sessions connecting to the cluster. CockroachDB Serverless does not have access to the SQL graphs in this version but if you're running this tutorial on a stand alone CockroachDB cluster, you can navigate to the SQL metrics dashboard and observe the SQL Sessions graph, it will directly correlate to the number of clients you've selected in pgbench. The jobs flag controls the number of threads you want to execute per client. A good number to choose depends on how many cores your host machine has, one thread per core.
You may also notice the latency in the result above. It's a bit high and one way to reduce that latency is to colocate your pgbench client machine with the region where the cluster is located. Since my cluster is in us-central in GCP, it may be worth running my benchmark in the same region.
Run With Extended Protocol
By default, pgbench benchmark executs using simple protocol. We can switch to two other querymodes: extended and prepared which may or may not provide additional performance benefits. For more information, see pgbench docs on querymodes.
Before we execute with extended protocol, it is worth initializing the tables to make the tests more accurate.
pgbench \

 --initialize \

 --host=${DB_HOST} \

 --username=artem \

 --port=26257 \

 --no-vacuum \

 --scale=10 \

${DB_INSTANCE}.defaultdb
pgbench \

 --host=${DB_HOST} \

 --no-vacuum \

 --client=8 \

 --jobs=8 \

 --username=artem \

 --port=26257 \

 ${DB_INSTANCE}.defaultdb \

 -T 60 \

 -P 5 \

 --protocol=extended
progress: 5.0 s, 24.6 tps, lat 288.716 ms stddev 34.478
progress: 10.0 s, 28.2 tps, lat 285.039 ms stddev 33.766
progress: 15.0 s, 28.0 tps, lat 289.444 ms stddev 29.746
progress: 20.0 s, 27.4 tps, lat 288.197 ms stddev 25.896
progress: 25.0 s, 28.0 tps, lat 286.010 ms stddev 25.573
progress: 30.0 s, 27.8 tps, lat 289.492 ms stddev 36.746
progress: 35.0 s, 27.4 tps, lat 292.490 ms stddev 32.463
progress: 40.0 s, 27.4 tps, lat 291.215 ms stddev 37.287
progress: 45.0 s, 27.6 tps, lat 286.721 ms stddev 27.330
progress: 50.0 s, 28.2 tps, lat 287.256 ms stddev 23.929
progress: 55.0 s, 27.6 tps, lat 286.969 ms stddev 28.236
progress: 60.0 s, 27.2 tps, lat 294.947 ms stddev 43.752
transaction type: <builtin: TPC-B (sort of)>
scaling factor: 10
query mode: extended
number of clients: 8
number of threads: 8
duration: 60 s
number of transactions actually processed: 1655
latency average = 288.882 ms
latency stddev = 32.160 ms
tps = 27.457954 (including connections establishing)
tps = 27.627291 (excluding connections establishing)Performance didn't improve but this is also a very small scale test. Numbers may be different at larger scale and more productionalized set up.
Run With Prepared Protocol
pgbench \

 --host=${DB_HOST} \

 --no-vacuum \

 --client=8 \

 --jobs=8 \

 --username=artem \

 --port=26257 \

 ${DB_INSTANCE}.defaultdb \

 -T 60 \

 -P 5 \

 --protocol=prepared
progress: 5.0 s, 23.4 tps, lat 308.464 ms stddev 87.006
progress: 10.0 s, 27.8 tps, lat 285.453 ms stddev 25.515
progress: 15.0 s, 28.2 tps, lat 284.509 ms stddev 23.172
progress: 20.0 s, 28.0 tps, lat 285.247 ms stddev 23.939
progress: 25.0 s, 27.8 tps, lat 289.368 ms stddev 35.437
progress: 30.0 s, 27.4 tps, lat 290.181 ms stddev 35.834
progress: 35.0 s, 27.6 tps, lat 288.790 ms stddev 32.648
progress: 40.0 s, 28.0 tps, lat 287.212 ms stddev 26.694
progress: 45.0 s, 28.0 tps, lat 285.789 ms stddev 26.644
progress: 50.0 s, 27.8 tps, lat 289.744 ms stddev 31.301
progress: 55.0 s, 27.4 tps, lat 288.354 ms stddev 31.461
progress: 60.0 s, 28.2 tps, lat 285.427 ms stddev 26.248
transaction type: <builtin: TPC-B (sort of)>
scaling factor: 10
query mode: prepared
number of clients: 8
number of threads: 8
duration: 60 s
number of transactions actually processed: 1656
latency average = 288.762 ms
latency stddev = 36.936 ms
tps = 27.478921 (including connections establishing)
tps = 27.649978 (excluding connections establishing)This is by no means an end to end review of pgbench. It will take time to tune the workload to your desired latencies and throughput. At the least, you have the foundation to start benchmarking CockroachDB with common PostgreSQL toolset.
Run an Arbitrary Workload With Variable Substitution
pgbench also allows to simulate custom workloads. In those cases, initialization step may be optional. All is needed is to provide a set of scripts with custom workloads. Furthermore, pgbench supports variable substitution which will make those tests even more realistic. Below is a sample script I will intuitively call `query.sql`. I have a random() function that will generate an integer between 1 and 1 million. This directly correlates to the scale factor I've chosen originally. It not as important as the fact you can mix and match multiple functions and variables in your custom workloads.
\set aid random(1, 1000000)
\set delta random(0, 100)
\set tid random(0, 100)
\set bid random(0, 10)

BEGIN;
UPDATE pgbench_accounts SET abalance = abalance + :delta WHERE aid = :aid;
SELECT abalance FROM pgbench_accounts WHERE aid = :aid;
UPDATE pgbench_tellers SET tbalance = tbalance + :delta WHERE tid = :tid;
UPDATE pgbench_branches SET bbalance = bbalance + :delta WHERE bid = :bid;
INSERT INTO pgbench_history (tid, bid, aid, delta, mtime) VALUES (:tid, :bid, :aid, :delta, CURRENT_TIMESTAMP);
END;
To understand the set of queries above, I point you to the pgbench docs, specifically titled What is the “Transaction" Actually Performed in pgbench?"
pgbench \

 --host=${DB_HOST} \

 --no-vacuum \

 --file=query.sql@1 \

 --client=8 \

 --jobs=8 \

 --username=artem \

 --port=26257 \

 ${DB_INSTANCE}.defaultdb \

 -T 60 \

 -P 5
progress: 5.0 s, 23.6 tps, lat 298.796 ms stddev 32.267

progress: 10.0 s, 27.4 tps, lat 294.317 ms stddev 33.200

progress: 15.0 s, 27.0 tps, lat 295.169 ms stddev 32.472

progress: 20.0 s, 27.2 tps, lat 295.235 ms stddev 31.972

progress: 25.0 s, 27.4 tps, lat 294.091 ms stddev 31.760

progress: 30.0 s, 26.6 tps, lat 294.676 ms stddev 29.408

progress: 35.0 s, 27.2 tps, lat 298.375 ms stddev 35.835

progress: 40.0 s, 27.0 tps, lat 293.577 ms stddev 36.537

progress: 45.0 s, 27.4 tps, lat 292.442 ms stddev 30.987

progress: 50.0 s, 27.6 tps, lat 294.131 ms stddev 28.203

progress: 55.0 s, 27.0 tps, lat 295.015 ms stddev 47.683

progress: 60.0 s, 27.4 tps, lat 290.537 ms stddev 28.012

transaction type: query.sql

scaling factor: 1

query mode: simple

number of clients: 8

number of threads: 8

duration: 60 s

number of transactions actually processed: 1622

latency average = 294.690 ms

latency stddev = 33.783 ms

tps = 26.912622 (including connections establishing)

tps = 27.096764 (excluding connections establishing)
A few thoughts, firstly, all transactions, be it read or write in CockroachDB are executed in serializable isolation mode. It means, each query has exclusive access to the cluster preventing any data inconsistencies. In CockroachDB, we don't need to pass `BEGIN;` and `END;` but given the business transaction depicted in the query.sql file above is a single business transaction, we wrap it in an explicit transaction. More research on my part is required to figure out how to pass the entire business transaction as an implicit transaction. In CockroachDB, server will attempt to execute every request as an implicit transaction and thereby yield better performance. It may as well be as easy as removing both `BEGIN;` and `END;` but until I get conclusive results, I am not comfortable claiming that.
Also, you may have noticed that when I passed the script file to the client, I appended an @ sign.
--file=query.sql@1 \
This syntax is meant to add weights to queries assuming there are multiple scripts and assigning weights to each query will determine how many times each script file will be used in the entire workload.
Finally, it is not uncommon to see weirdness getting accustomed to a new tool. I found pgbench's debug option extremely helpful. You toggle debug with -d flag.
pgbench \

 --host=${DB_HOST} \

 --no-vacuum \

 --file=query.sql@1 \

 --client=1 \

 --jobs=1 \

 --username=artem \

 --port=26257 \

 ${DB_INSTANCE}.defaultdb \

 -T 2 \

 -P 1 \

-d
pgbench: pghost: free-tier.gcp-us-central1.cockroachlabs.cloud pgport: 26257 nclients: 1 duration: 2 dbName: artem-serverless-4394.defaultdb

pgbench: client 0 executing script "query.sql"

pgbench: client 0 executing \set aid

pgbench: client 0 executing \set delta

pgbench: client 0 executing \set tid

pgbench: client 0 executing \set bid

pgbench: client 0 sending BEGIN;

pgbench: client 0 receiving

pgbench: client 0 receiving

pgbench: client 0 sending UPDATE pgbench_accounts SET abalance = abalance + 12 WHERE aid = 350857;

pgbench: client 0 receiving

pgbench: client 0 receiving

pgbench: client 0 sending SELECT abalance FROM pgbench_accounts WHERE aid = 350857;

pgbench: client 0 receiving

pgbench: client 0 receiving

pgbench: client 0 sending UPDATE pgbench_tellers SET tbalance = tbalance + 12 WHERE tid = 48;

pgbench: client 0 receiving

pgbench: client 0 receiving

pgbench: client 0 sending UPDATE pgbench_branches SET bbalance = bbalance + 12 WHERE bid = 5;

pgbench: client 0 receiving

pgbench: client 0 receiving

pgbench: client 0 sending INSERT INTO pgbench_history (tid, bid, aid, delta, mtime) VALUES (48, 5, 350857, 12, CURRENT_TIMESTAMP);

pgbench: client 0 receiving

pgbench: client 0 receiving

pgbench: client 0 sending END;

pgbench: client 0 receiving

pgbench: client 0 receiving

pgbench: client 0 executing script "query.sql"

pgbench: client 0 executing \set aid

pgbench: client 0 executing \set delta

pgbench: client 0 executing \set tid

pgbench: client 0 executing \set bid

pgbench: client 0 sending BEGIN;

pgbench: client 0 receiving

pgbench: client 0 receiving

pgbench: client 0 sending UPDATE pgbench_accounts SET abalance = abalance + 23 WHERE aid = 699021;

pgbench: client 0 receiving

pgbench: client 0 receiving

pgbench: client 0 sending SELECT abalance FROM pgbench_accounts WHERE aid = 699021;

pgbench: client 0 receiving

pgbench: client 0 receiving

pgbench: client 0 sending UPDATE pgbench_tellers SET tbalance = tbalance + 23 WHERE tid = 7;

pgbench: client 0 receiving

pgbench: client 0 receiving

pgbench: client 0 sending UPDATE pgbench_branches SET bbalance = bbalance + 23 WHERE bid = 10;

pgbench: client 0 receiving

pgbench: client 0 receiving

pgbench: client 0 sending INSERT INTO pgbench_history (tid, bid, aid, delta, mtime) VALUES (7, 10, 699021, 23, CURRENT_TIMESTAMP);

pgbench: client 0 receiving

pgbench: client 0 receiving

pgbench: client 0 sending END;

pgbench: client 0 receiving

pgbench: client 0 receiving

pgbench: client 0 executing script "query.sql"

pgbench: client 0 executing \set aid

pgbench: client 0 executing \set delta

pgbench: client 0 executing \set tid

pgbench: client 0 executing \set bid

pgbench: client 0 sending BEGIN;

pgbench: client 0 receiving

pgbench: client 0 receiving

pgbench: client 0 sending UPDATE pgbench_accounts SET abalance = abalance + 32 WHERE aid = 867937;

pgbench: client 0 receiving

pgbench: client 0 receiving

pgbench: client 0 sending SELECT abalance FROM pgbench_accounts WHERE aid = 867937;

pgbench: client 0 receiving

progress: 1.0 s, 2.0 tps, lat 277.060 ms stddev 1.774

pgbench: client 0 receiving

pgbench: client 0 sending UPDATE pgbench_tellers SET tbalance = tbalance + 32 WHERE tid = 71;

pgbench: client 0 receiving

pgbench: client 0 receiving

pgbench: client 0 sending UPDATE pgbench_branches SET bbalance = bbalance + 32 WHERE bid = 7;

pgbench: client 0 receiving

pgbench: client 0 receiving

pgbench: client 0 sending INSERT INTO pgbench_history (tid, bid, aid, delta, mtime) VALUES (71, 7, 867937, 32, CURRENT_TIMESTAMP);

pgbench: client 0 receiving

pgbench: client 0 receiving

pgbench: client 0 sending END;

pgbench: client 0 receiving

pgbench: client 0 receiving

pgbench: client 0 executing script "query.sql"

pgbench: client 0 executing \set aid

pgbench: client 0 executing \set delta

pgbench: client 0 executing \set tid

pgbench: client 0 executing \set bid

pgbench: client 0 sending BEGIN;

pgbench: client 0 receiving

pgbench: client 0 receiving

pgbench: client 0 sending UPDATE pgbench_accounts SET abalance = abalance + 94 WHERE aid = 25359;

pgbench: client 0 receiving

pgbench: client 0 receiving

pgbench: client 0 sending SELECT abalance FROM pgbench_accounts WHERE aid = 25359;

pgbench: client 0 receiving

pgbench: client 0 receiving

pgbench: client 0 sending UPDATE pgbench_tellers SET tbalance = tbalance + 94 WHERE tid = 41;

pgbench: client 0 receiving

pgbench: client 0 receiving

pgbench: client 0 sending UPDATE pgbench_branches SET bbalance = bbalance + 94 WHERE bid = 6;

pgbench: client 0 receiving

pgbench: client 0 receiving

pgbench: client 0 sending INSERT INTO pgbench_history (tid, bid, aid, delta, mtime) VALUES (41, 6, 25359, 94, CURRENT_TIMESTAMP);

pgbench: client 0 receiving

pgbench: client 0 receiving

pgbench: client 0 sending END;

pgbench: client 0 receiving

pgbench: client 0 receiving

pgbench: client 0 executing script "query.sql"

pgbench: client 0 executing \set aid

pgbench: client 0 executing \set delta

pgbench: client 0 executing \set tid

pgbench: client 0 executing \set bid

pgbench: client 0 sending BEGIN;

pgbench: client 0 receiving

pgbench: client 0 receiving

pgbench: client 0 sending UPDATE pgbench_accounts SET abalance = abalance + 41 WHERE aid = 245579;

pgbench: client 0 receiving

pgbench: client 0 receiving

pgbench: client 0 sending SELECT abalance FROM pgbench_accounts WHERE aid = 245579;

pgbench: client 0 receiving

pgbench: client 0 receiving

pgbench: client 0 sending UPDATE pgbench_tellers SET tbalance = tbalance + 41 WHERE tid = 68;

pgbench: client 0 receiving

pgbench: client 0 receiving

pgbench: client 0 sending UPDATE pgbench_branches SET bbalance = bbalance + 41 WHERE bid = 8;

pgbench: client 0 receiving

pgbench: client 0 receiving

pgbench: client 0 sending INSERT INTO pgbench_history (tid, bid, aid, delta, mtime) VALUES (68, 8, 245579, 41, CURRENT_TIMESTAMP);

pgbench: client 0 receiving

pgbench: client 0 receiving

pgbench: client 0 sending END;

pgbench: client 0 receiving

pgbench: client 0 receiving

pgbench: client 0 executing script "query.sql"

pgbench: client 0 executing \set aid

pgbench: client 0 executing \set delta

pgbench: client 0 executing \set tid

pgbench: client 0 executing \set bid

pgbench: client 0 sending BEGIN;

pgbench: client 0 receiving

pgbench: client 0 receiving

pgbench: client 0 sending UPDATE pgbench_accounts SET abalance = abalance + 90 WHERE aid = 954903;

pgbench: client 0 receiving

pgbench: client 0 receiving

pgbench: client 0 sending SELECT abalance FROM pgbench_accounts WHERE aid = 954903;

pgbench: client 0 receiving

pgbench: client 0 receiving

pgbench: client 0 sending UPDATE pgbench_tellers SET tbalance = tbalance + 90 WHERE tid = 19;

pgbench: client 0 receiving

pgbench: client 0 receiving

pgbench: client 0 sending UPDATE pgbench_branches SET bbalance = bbalance + 90 WHERE bid = 4;

pgbench: client 0 receiving

pgbench: client 0 receiving

pgbench: client 0 sending INSERT INTO pgbench_history (tid, bid, aid, delta, mtime) VALUES (19, 4, 954903, 90, CURRENT_TIMESTAMP);

pgbench: client 0 receiving

pgbench: client 0 receiving

pgbench: client 0 sending END;

pgbench: client 0 receiving

progress: 2.0 s, 3.0 tps, lat 278.933 ms stddev 3.689

pgbench: client 0 receiving

transaction type: query.sql

scaling factor: 1

query mode: simple

number of clients: 1

number of threads: 1

duration: 2 s

number of transactions actually processed: 6

latency average = 277.876 ms

latency stddev = 3.005 ms

tps = 2.997308 (including connections establishing)

tps = 3.597584 (excluding connections establishing)
Given the output, it is likely best to output the debug trace to a file, I limited the run to 2 seconds. We can observe the variables passed as well as the order of execution.
Clean Up
Since we're using a free forever version of CockroachDB, aside from dropping the tables, there's not much clean up to do.
DROP TABLE pgbench_accounts, pgbench_branches, pgbench_history, pgbench_tellers;Happy benchmarking!
Recommend
About Joyk
Aggregate valuable and interesting links.
Joyk means Joy of geeK