

Managing your VPS memory usage
source link: https://help.dreamhost.com/hc/en-us/articles/214879348-Managing-your-VPS-memory-usage
Go to the source link to view the article. You can view the picture content, updated content and better typesetting reading experience. If the link is broken, please click the button below to view the snapshot at that time.

Overview
Every DreamHost virtual private server (VPS) uses roughly 100 MB of memory as a baseline without any user processes running. That's because there are a number of system processes that have to run in order for your VPS to work (sshd, proftpd, and so on). It's important that you keep this in mind when allocating memory for your VPS since that initial 100 MB of memory is largely unusable for your site processes.
After that initial 100 MB, most of the memory that is used by your VPS consists of Apache and PHP processes (or in the case of a Rails applications, Passenger and Rails processes).
Example of how processes use memory
Whenever someone views your website, the PHP file for the page they view is parsed and executed by a PHP CGI process. At the same time, an Apache process will need to run, in order to serve the resulting HTML output from the script to the browser.
The number of these processes that run is proportional to the amount of traffic you have. For example, if you have a large influx of traffic, additional PHP and Apache processes will spawn to facilitate that traffic. In fact, Apache and PHP will continue to spawn processes as requested until your VPS is completely out of memory.
You will need to be careful how you set things up to prevent such problems. This often leads to problems where websites on a VPS will stop working due to memory saturation during peak hours and will then start working normally again once the traffic dies down to more manageable levels.
Checking your memory usage
You can view a graph of your private server’s memory usage in your panel.
- Go to the VPS page.
- To the right of your VPS, click the RAM graph icon under the Usage column.
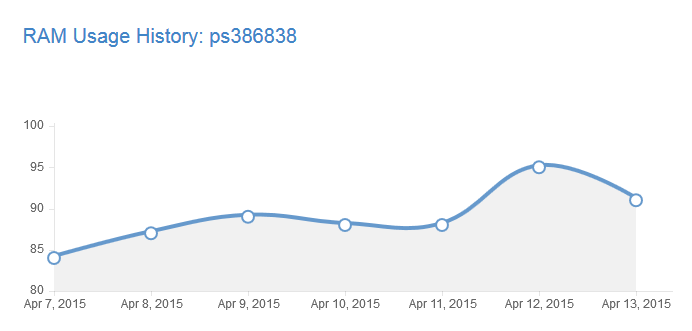
The memory usage graph on your web panel is helpful for seeing usage trends, but isn't really helpful for getting a good picture of what's actually going on in real time since these graphs are generally updated once a day around midnight PDT/PST and are an average of the day's use.
The top, free, and ps aux commands
To obtain more information on exactly what's going on, you'll need to SSH into your VPS.
Open two connections in separate windows so you can easily review the results.
Once you're in, the primary tools you'll use are top -c, free -m, and ps aux.
Using the top command
The top command displays the current active processes, the % of the CPU they're using, how much memory, which user is running it, and so on. Once top is running, you can press Shift + m to sort processes by memory usage rather than by CPU usage.
While examining your top output, it's important to know what information you need to look at. The memory allocation you set in your panel relates to physical memory being used (as opposed to virtual memory). That memory corresponds to the RES column in top output. Below is what top output sorted by memory (Shift + m) might look like (the actual processes will likely be different on your VPS):
PID   USER     PR NI   VIRT  RES SHR   S  %CPU  %MEM    TIME+   COMMAND
14871 exampleu  20   0  250m  14m 8340  S  5     1.3   0:04.12  php74.cgi
23591 exampleu  20   0  250m  12m 8256  S  6     1.3   0:00.36  php74.cgi
23618 exampleu  20   0  250m  13m 8256  S  4     1.3   0:00.19  php74.cgi
23684 exampleu  20   0  250m  12m 8256  S  7     1.3   0:00.10  php74.cgi
23652 exampleu  20   0  250m  13m 8256  S  6     1.3   0:00.18  php74.cgi
23654 exampleu  20   0  250m  15m 8252  S  6     1.3   0:00.17  php74.cgi
In the above example, you'll see a series of php74.cgi processes running which means the site spawning these processes is running under PHP 7.4. In the RES column, you can see how much memory each is using. In this case, they're all using between 12–15 MB of memory. On a busy VPS, you'll likely have quite a few Apache processes running. Those average around 9-11 MB of memory each. Apache and PHP processes multiply as your sites start serving more requests, so you can see that memory usage can quite easily skyrocket if you begin to receive a lot of traffic.
Using the free command
In your other window, you can run free -m. This command displays the current memory usage on your VPS and should look something like this:
                    total        used        free     shared    buffers     cached
 Mem:               4049        3941        107            0        123       1639
 -/+ buffers/cache:             2178       1870
 Swap:              6165          42       6122
The -m option tells the command to display the memory usage in megabytes.
total — In the above example, the total available memory is roughly 4GB. You can see this value as 4049MB under the total column.
used — Under the used column in the second row it shows 2178 MB. This means 2.1GB is used.
free — Under the free column in the second row it shows 1870MB. This means 1.8GB is free.
The total you see should correspond to the amount of memory you allocated to your VPS in your panel.
For more details about what memory usage looks like, visit the following:
Using the ps aux command
The ps command supplies you with similar information as top, but simply takes a snapshot of the active processes and their usage and displays it on your screen. This is useful if you only want to see a particular process(es). For instance, if you only want to see running Apache processes, run the following command:
[server]$ ps aux | grep apache
That will "pipe" (or pass) the output from ps to the grep command which will filter that output on a per line basis looking for the string apache in it. Any line with that output is displayed.
Another useful variation is:
[server]$ ps aux | grep php
This allows you to observe all the PHP processes that are running.
See also
Recommend
About Joyk
Aggregate valuable and interesting links.
Joyk means Joy of geeK