

How we use ElasticSearch, Kibana and Filebeat to handle our logs
source link: https://flareapp.io/blog/30-how-we-use-elasticsearch-kibana-and-filebeat-to-handle-our-logs
Go to the source link to view the article. You can view the picture content, updated content and better typesetting reading experience. If the link is broken, please click the button below to view the snapshot at that time.

How we use ElasticSearch, Kibana and Filebeat to handle our logs
Monday 9th of August 2021Flare runs on a few different servers and each one of them has its own purpose. We've got web servers that serve the Flare app and other public pages like this blog. Reporting servers will take dozens of error reports per second from our clients and store them for later processing. Finally, there are worker servers which will process these reports and run background tasks like sending notifications and so on.
Each one of these servers runs a Laravel installation that produce interesting metrics and logs. This is quite helpful when something goes wrong. The only problem is that, whenever something goes wrong, we need to manually log in to each server via SSH to check the logs.
In this blog post, we'll explain how we combine these logs in a single stream.
Using ElasticSerach for logging
There are a couple of services out there to which you can send all the logging output. They provide a UI for everything you send to them. We decided to not use these services because we already are using an ElasticSearch cluster to handle searching errors. It's rather straightforward use it too search our logging output too.
ElasticSearch provides an excellent web client called Kibana. This isn't only used to manage the ElasticSearch cluster and its contents. It can also show you logs that are sent to ElasticSearch as part of the ELK stack. It even has a real-time stream of logs.
Improving performance using Filebeat
When something is logged in our Flare API, we could immediately send that log message to ElasticSearch using the API. However, this synchronous API call would make the Flare API really slow. Every time something gets logged within Flare, we would need to send a separate request to our ElasticSearch cluster, which could happend hundreds of times per second.
Instead, we chose to use Filebeat. It's a tool by ElasticSearch that runs on your servers and periodically sends log files to ElasticSearch. This happens in a separate process so it doesn't impact the Flare Laravel application. Using Filebeat, logs are getting send in bulk, and we don't have to sacrifice any resources in the Flare app, neat!
Integration in Laravel
Let's take a look at how this works. By default, the Laravel logging format looks like this:
[2021-07-15 11:40:43] local.ERROR: something went wrong
Filebeat (and ElasticSearch's ingress) need a more structured logging format like this:
{
    "@timestamp" : "2021-07-15T11:40:43.000000+00:00",
    "log" : {
        "level" : "ERROR",
        "logger" : "local"
    },
    "message" : "something went wrong"
}
As Laravel uses the monolog package for logging, we only need to create a new formatter for Filebeat that will output logs like the JSON format shown above:
class ElasticSearchFormatter extends NormalizerFormatter
{
    public function format(array $record): string
    {
        $message = [
            '@timestamp' => $this->normalize($record['datetime']),
            'log' => [
                'level' => $record['level_name'],
                'logger' => $record['channel'],
            ],
        ];

        if (isset($record['message'])) {
            $message['message'] = $record['message'];
        }

        return $this->toJson($message) . "\n";
    }
}
Now within the logging.php config file, we change the daily logger as such:
'daily' => [
    'driver' => 'daily',
    'formatter' => App\Support\ElasticSearch\ElasticSearchFormatter::class,
    'path' => storage_path('logs/laravel.log'),
    'level' => env('LOG_LEVEL', 'debug'),
    'days' => 7,
],
We use the daily logger in Flare to ensure our server's hard drives are not getting overloaded with log files. This daily logger will only keep logs for the last seven days stored on the server.
Next, we need to install Filebeat on all of our servers and configure it to send the context from the daily log files to the ElasticSearch cluster. The filebeat.yml config file to do so looks like this:
filebeat:
  inputs:
  - enabled: true
    json.add_error_key: true
    json.expand_keys: true
    json.keys_under_root: true
    json.overwrite_keys: true
    paths:
    - {PATH_TO_FLARE}/storage/logs/laravel-*.log
    type: log

output:
  elasticsearch:
    hosts:
    - {ELASTIC_SEARCH_IP}:{ELASTIC_SEARCH_PORT}

logging:
  files:
    rotateeverybytes: 10485760
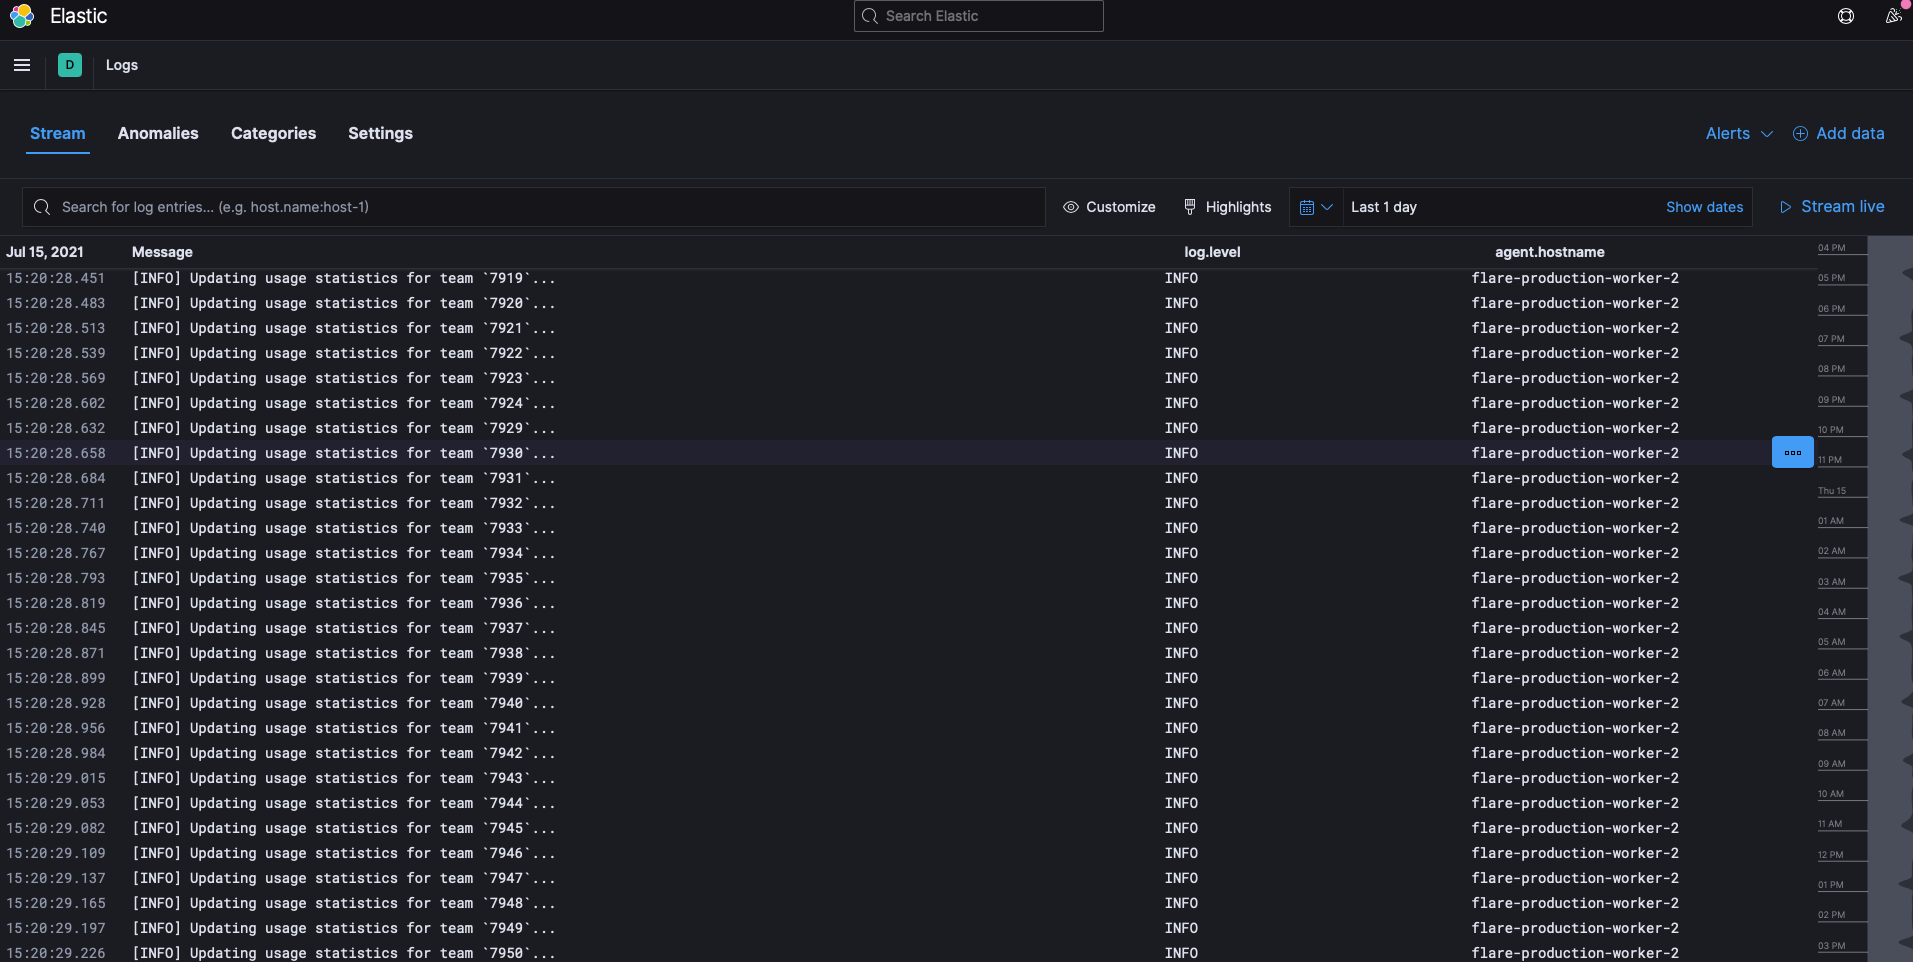
Finally, the last thing left to do is configuring Kibana to read the Filebeat logs. This can be configured from the Kibana UI by going to the settings panel in Oberserveability -> Logs. Check that the log indices contain the filebeat-* wildcard. The indices that match this wildcard will be parsed for logs by Kibana.
In the log columns configuration we also added the log.level and agent.hostname columns. This way we can see how severe a log entry was and what server it originated from.
Recommend
About Joyk
Aggregate valuable and interesting links.
Joyk means Joy of geeK