

Node.js Garbage Collection: Heap Statistics Magic Dashboard
source link: https://blog.appsignal.com/2021/01/19/nodejs-garbage-collection-heap-statistics-magic-dashboard-metrics.html
Go to the source link to view the article. You can view the picture content, updated content and better typesetting reading experience. If the link is broken, please click the button below to view the snapshot at that time.
We just released a Magic Dashboard for Garbage Collection stats for our Node.js integration. If you are leaking memory, this dashboard will help you discover and fix this problem. No setting up is required, this dashboard will magically automatically appear among the rest of your dashboards. ✨
Garbage Collection
Garbage collection (GC) can have a big impact on the performance of your apps. GC is a process that the Node.js runtime regularly runs to clean up any objects that were created and are not used anymore.
If you create a lot of objects in your code (or a dependency does) this can slow down your app. It’s therefore a good idea to keep an eye on this. We shipped GC magic dashboard to make this easy for you!
Once you upgrade your node package to 1.2.0 and deploy your app a new
Node.js Heap Statistics dashboard will appear. Let’s look at what data is on the dashboard!
Heap Statistics
Node.js reserves memory to store your objects in. This is called the “heap”. The top graph in the dashboard displays the total size of your heap, and how much of it is used.
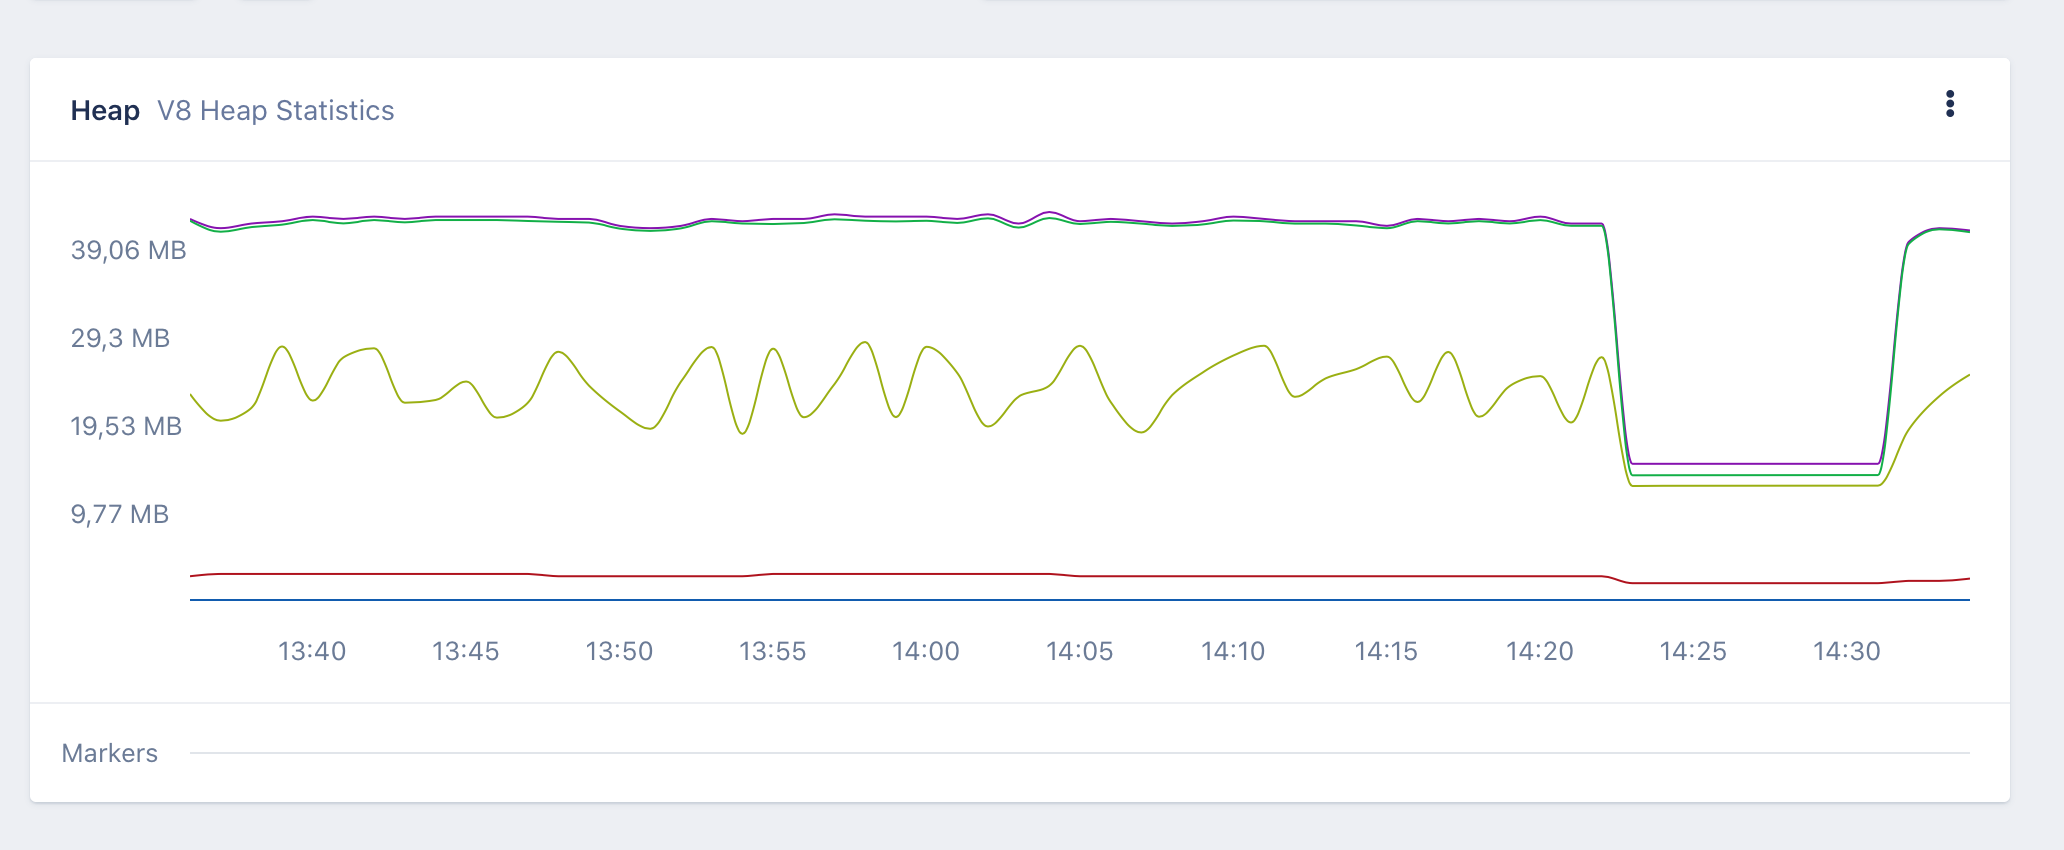
If you see a lot of variation here that’s an indication something might be off. In this screenshot we put some load on this test app, and then stopped requesting pages for a bit. You can clearly see that the Node.js runtime reacted to this by making the heap smaller.
If you see this graph steadily increasing there might be a memory leak in your code, or in a dependency.
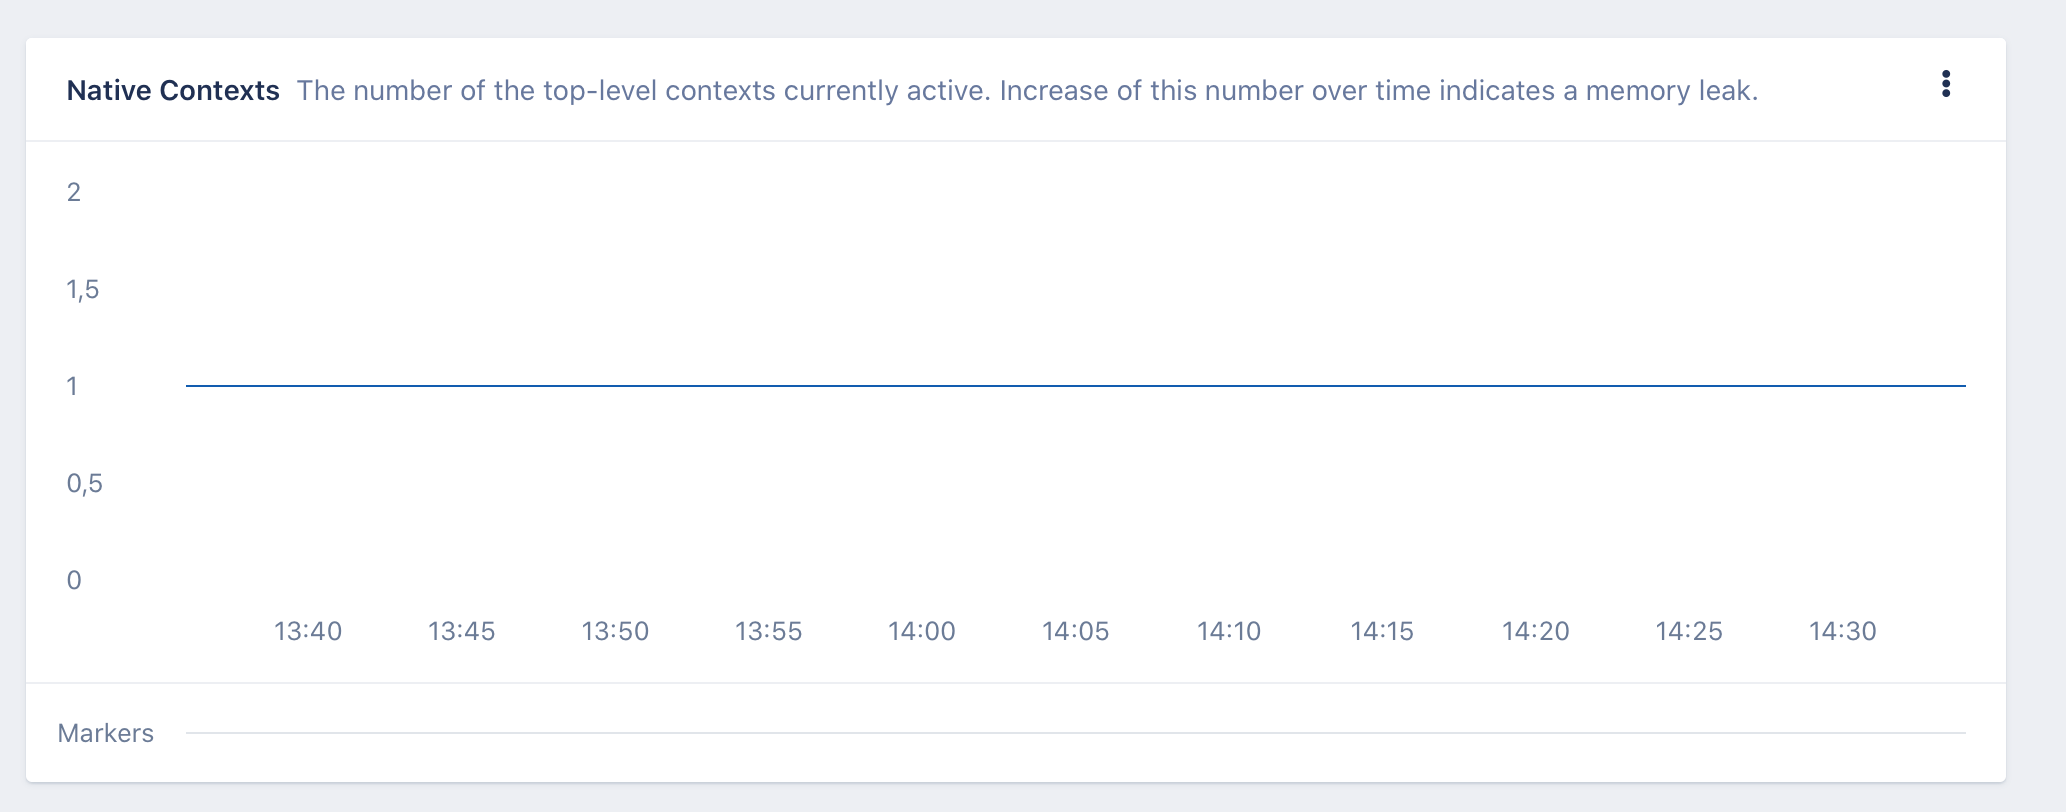
Contexts
The second graph on this dashboards show the number of currently active top-level contexts. This number should regularly stay stable, otherwise this would indicate a potential memory leak.
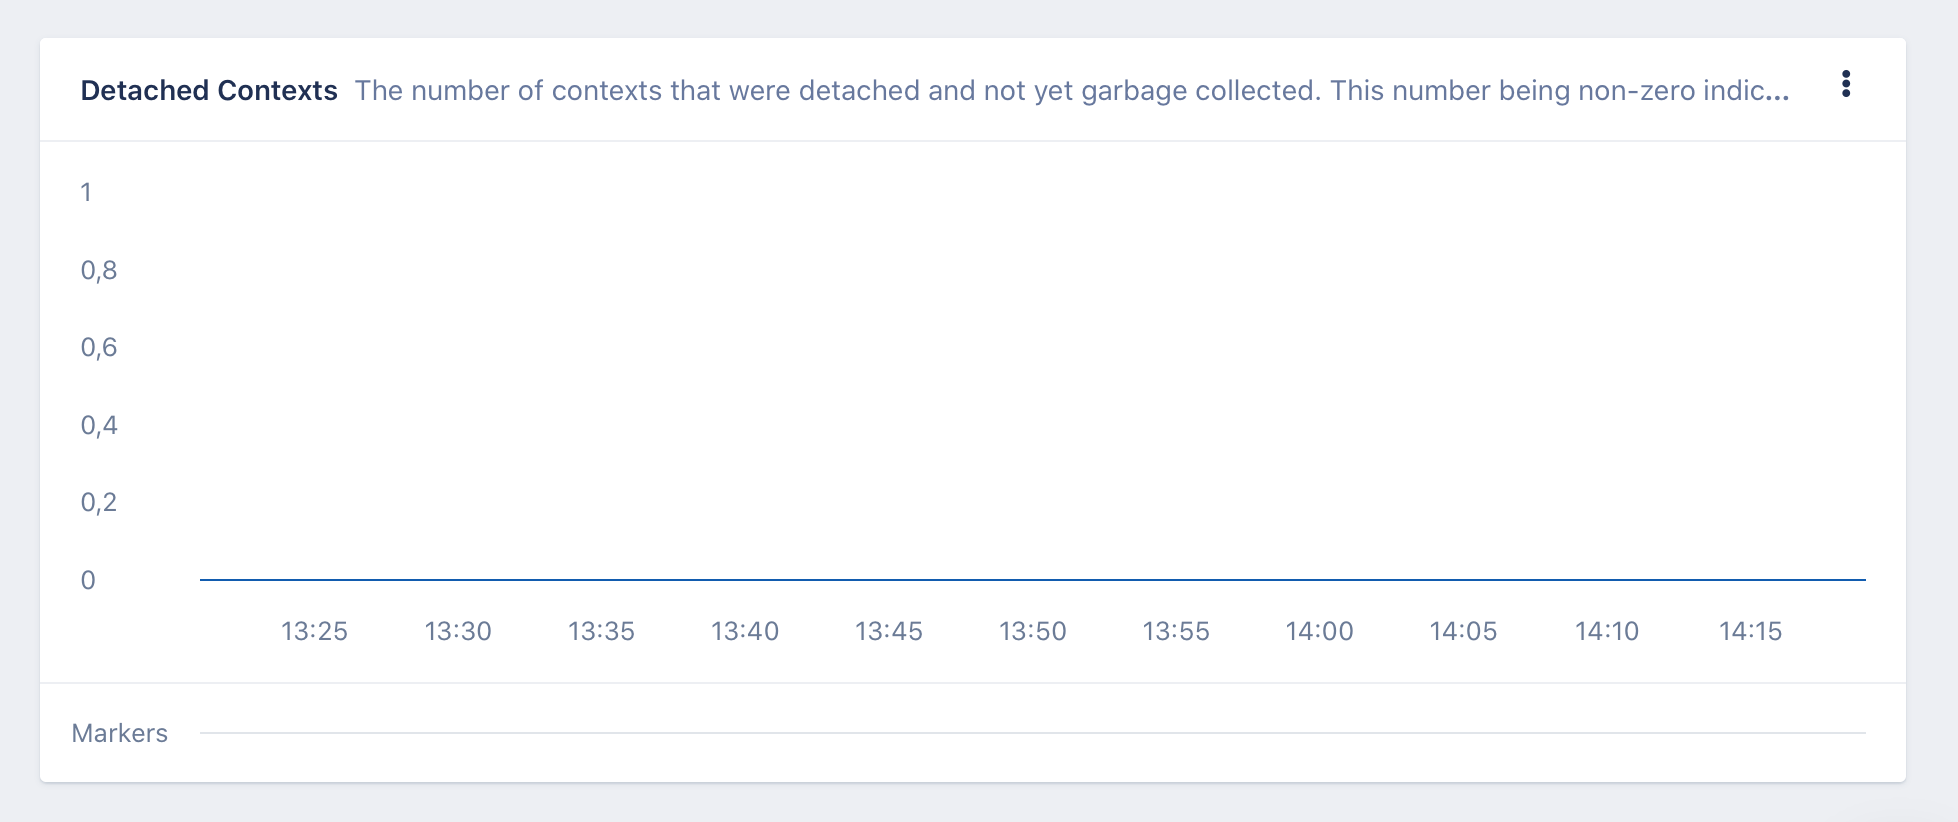
The third graph shows the number of contexts that were detached and not yet garbage collected. If this number is not zero you might have a memory leak to deal with.
More Magic ✨
To learn more about garbage collection be sure to out our detailed blog post on this subject.
We also have Magic Dashboards for Next.js and PostgreSQL. If you like the way we make monitoring easier, we won’t stop you from trying us out. It’s a five minute install on localhost and you can try us out for free (no credit card required).
Recommend
About Joyk
Aggregate valuable and interesting links.
Joyk means Joy of geeK