

一次系统调用时间过长追踪完整教程案例
source link: https://club.perfma.com/article/2117230
Go to the source link to view the article. You can view the picture content, updated content and better typesetting reading experience. If the link is broken, please click the button below to view the snapshot at that time.

Ftrace简介
Ftrace是Linux进行代码级实践分析最有效的工具之一,比如我们进行一个系统调用,出来的时间过长,我们想知道时间花哪里去了,利用Ftrace就可以追踪到一级级的时间分布。
Ftrace案例
写一个proc模块,包含一个proc的读和写的入口。test_proc_show()故意调用了一个kill_time()的函数,而kill_time()的函数,又调用了mdelay(2)和kill_moretime()的函数,该函数体内调用mdelay(2)。
kill_time()的函数和kill_moretime()函数前面都加了noinline以避免被编译器inline优化掉。
#include <linux/module.h>

#include <linux/kernel.h>

#include <linux/init.h>

#include <linux/version.h>

#include <linux/proc_fs.h>

#include <linux/seq_file.h>

#include <linux/delay.h>

#include <linux/uaccess.h>


static unsigned int variable;

static struct proc_dir_entry *test_dir, *test_entry;


static noinline void kill_moretime(void)

{

mdelay(2);

}


static noinline void kill_time(void)

{

mdelay(2);

kill_moretime();

}


static int test_proc_show(struct seq_file *seq, void *v)

{

unsigned int *ptr_var = seq->private;

kill_time();

seq_printf(seq, "%u\n", *ptr_var);

return 0;

}


static ssize_t test_proc_write(struct file *file, const char __user *buffer,

size_t count, loff_t *ppos)

{

struct seq_file *seq = file->private_data;

unsigned int *ptr_var = seq->private;

int err;

char *kbuffer;


        if (!buffer || count > PAGE_SIZE - 1)

                return -EINVAL;


kbuffer = (char *)__get_free_page(GFP_KERNEL);

if (!kbuffer)

return -ENOMEM;


err = -EFAULT;

if (copy_from_user(kbuffer, buffer, count))

goto out;

kbuffer[count] = '\0';


*ptr_var = simple_strtoul(kbuffer, NULL, 10);

return count;


out:

free_page((unsigned long)buffer);

return err;

}


static int test_proc_open(struct inode *inode, struct file *file)

{

return single_open(file, test_proc_show, PDE_DATA(inode));

}


static const struct file_operations test_proc_fops =

{

.owner = THIS_MODULE,

.open = test_proc_open,

.read = seq_read,

.write = test_proc_write,

.llseek = seq_lseek,

.release = single_release,

};


static __init int test_proc_init(void)

{

test_dir = proc_mkdir("test_dir", NULL);

if (test_dir) {

test_entry = proc_create_data("test_rw",0666, test_dir, &test_proc_fops, &variable);

if (test_entry)

return 0;

}


return -ENOMEM;

}

module_init(test_proc_init);


static __exit void test_proc_cleanup(void)

{

remove_proc_entry("test_rw", test_dir);

remove_proc_entry("test_dir", NULL);

}

module_exit(test_proc_cleanup);


MODULE_AUTHOR("Barry Song <[email protected]>");

MODULE_DESCRIPTION("proc exmaple");

MODULE_LICENSE("GPL v2");

模块对应的Makefile如下:

KVERS = $(shell uname -r)


# Kernel modules

obj-m += proc.o


# Specify flags for the module compilation.

#EXTRA_CFLAGS=-g -O0


build: kernel_modules


kernel_modules:

make -C /lib/modules/$(KVERS)/build M=$(CURDIR) modules


clean:

make -C /lib/modules/$(KVERS)/build M=$(CURDIR) clean
编译并且加载:
$ make

baohua@baohua-perf:~/develop/training/debug/ftrace/proc$

$ sudo insmod proc.ko

[sudo] password for baohua:
之后/proc目录下/proc/test_dir/test_rw文件可被读写。
下面我们用Ftrace来跟踪test_proc_show()这个函数。
我们把启动ftrace的所有命令写到一个脚本function.sh里面:
#!/bin/bash


debugfs=/sys/kernel/debug

echo nop > $debugfs/tracing/current_tracer

echo 0 > $debugfs/tracing/tracing_on

echo $$ > $debugfs/tracing/set_ftrace_pid

echo function_graph > $debugfs/tracing/current_tracer

#replace test_proc_show by your function name

echo test_proc_show > $debugfs/tracing/set_graph_function

echo 1 > $debugfs/tracing/tracing_on

exec "$@"
然后用这个脚本去启动cat /proc/test_dir/test_rw,这样ftrace下面test_proc_show()函数就被trace了。
# ./function.sh cat /proc/test_dir/test_rw

0
读取trace的结果:
# cat /sys/kernel/debug/tracing/trace > 1
接着用vim打开这个文件1,发现这个文件有600多行:

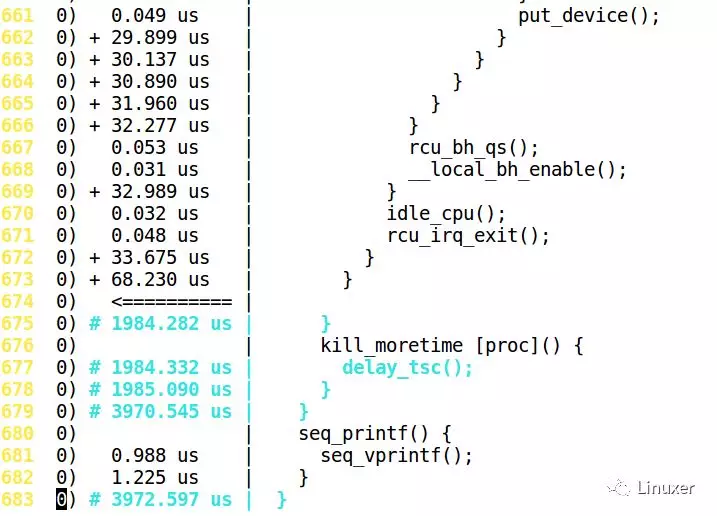
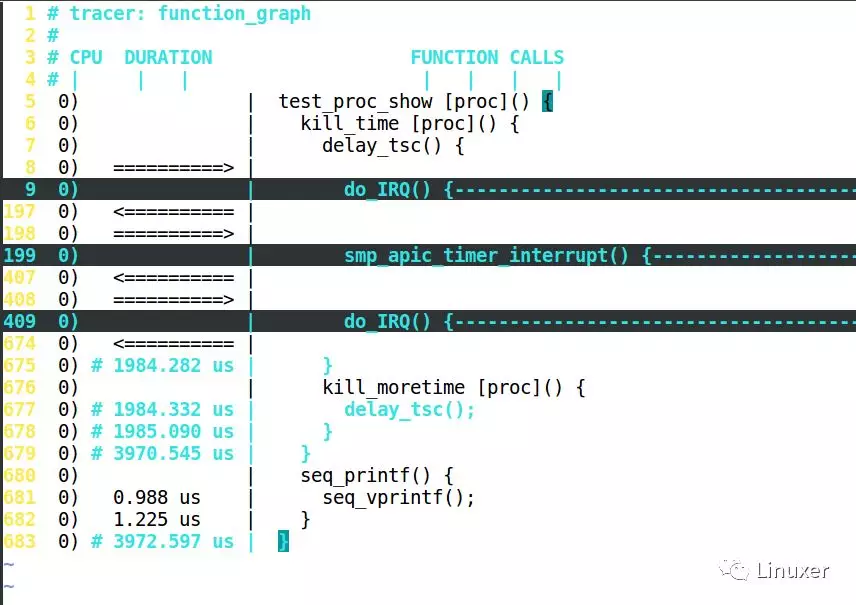
Ftrace结果怎么读?
Ftrace结果怎么读?答案非常简单:如果是叶子函数,就直接在这个函数的前面显示它占用的时间,如果是非叶子,要等到 }的时候,再显示时间,如下图:

延迟比较大的部分,会有+、#等特殊标号:
 '$' - greater than 1 second
 '@' - greater than 100 milisecond
 '*' - greater than 10 milisecond
 '#' - greater than 1000 microsecond
 '!' - greater than 100 microsecond
 '+' - greater than 10 microsecond
 ' ' - less than or equal to 10 microsecond.
vim对Ftrace进行折叠
上面那个Ftrace文件太大了,大到看不清。我们可以用vim来折叠之,不过需要一个vim的特别配置,我把它存放在了我的~目录,名字叫.fungraph-vim:
" Enable folding for ftrace function_graph traces.

"

" To use, :source this file while viewing a function_graph trace, or use vim's

" -S option to load from the command-line together with a trace.  You can then

" use the usual vim fold commands, such as "za", to open and close nested

" functions.  While closed, a fold will show the total time taken for a call,

" as would normally appear on the line with the closing brace.  Folded

" functions will not include finish_task_switch(), so folding should remain

" relatively sane even through a context switch.

"

" Note that this will almost certainly only work well with a

" single-CPU trace (e.g. trace-cmd report --cpu 1).


function! FunctionGraphFoldExpr(lnum)

  let line = getline(a:lnum)

  if line[-1:] == '{'

    if line =~ 'finish_task_switch() {$'

      return '>1'

    endif

    return 'a1'

  elseif line[-1:] == '}'

    return 's1'

  else

    return '='

  endif

endfunction


function! FunctionGraphFoldText()

  let s = split(getline(v:foldstart), '|', 1)

  if getline(v:foldend+1) =~ 'finish_task_switch() {$'

    let s[2] = ' task switch  '

  else

    let e = split(getline(v:foldend), '|', 1)

    let s[2] = e[2]

  endif

  return join(s, '|')

endfunction


setlocal foldexpr=FunctionGraphFoldExpr(v:lnum)

setlocal foldtext=FunctionGraphFoldText()

setlocal foldcolumn=12

setlocal foldmethod=expr
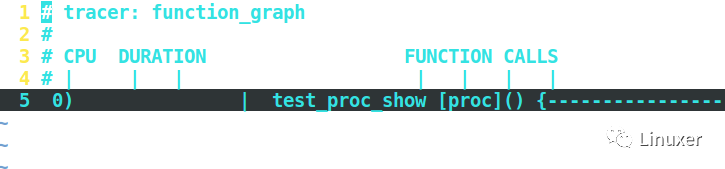
之后我们配置vim为这个模板来打开前面那个600多行的文件1:
vim -S ~/.fungraph-vim 1
这样我们看到的样子是:
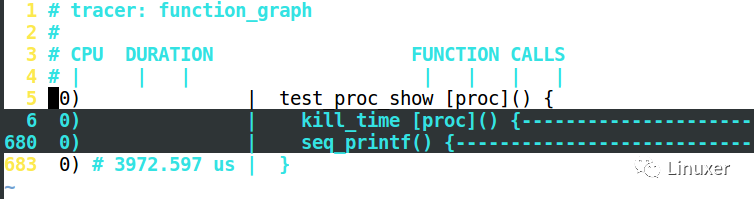
我们可以把光标移动到第5行,键盘敲打za,则展开为:
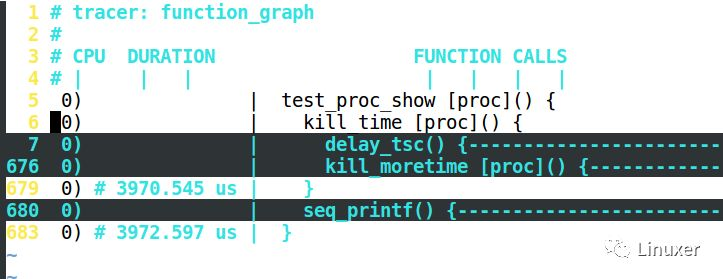
继续展开第6行的kill_time(),按za:
我们可以用z、a两个按键,搜索或者展开Ftrace的结果。
最后,perf-tools对Ftrace的功能进行了很好的封装和集成,建议大家用perf-tools来使用Ftrace,则效果更佳更简单。
本文作者:宋宝华,来自公众号:Linux阅码场
Recommend
About Joyk
Aggregate valuable and interesting links.
Joyk means Joy of geeK