

“Ask Data” – natural language queries in Tableau
source link: https://datavis.blog/2019/02/25/tableau-ask-data/
Go to the source link to view the article. You can view the picture content, updated content and better typesetting reading experience. If the link is broken, please click the button below to view the snapshot at that time.

“Ask Data” – natural language queries in Tableau

Ask Data is a new feature in Tableau 2019.1 that allows you to ask questions of your data in natural language and, in return, be shown a visual, such as a bar graph or treemap, that answers your question.
In this post, I’ll walk through the new functionality and call out some specific features which caught my attention.
Ask Data is not (yet?) available on desktop, so you’ll need access to Tableau Server or Tableau Online to try it out.
First, navigate to the data sources on your server and you will notice a new menu item – Ask Data – to the left of “Connections” and “Connected Workbooks”. With Ask Data selected, you will see an input box on the right side of the screen, inviting you to “Ask about fields in this data source”:
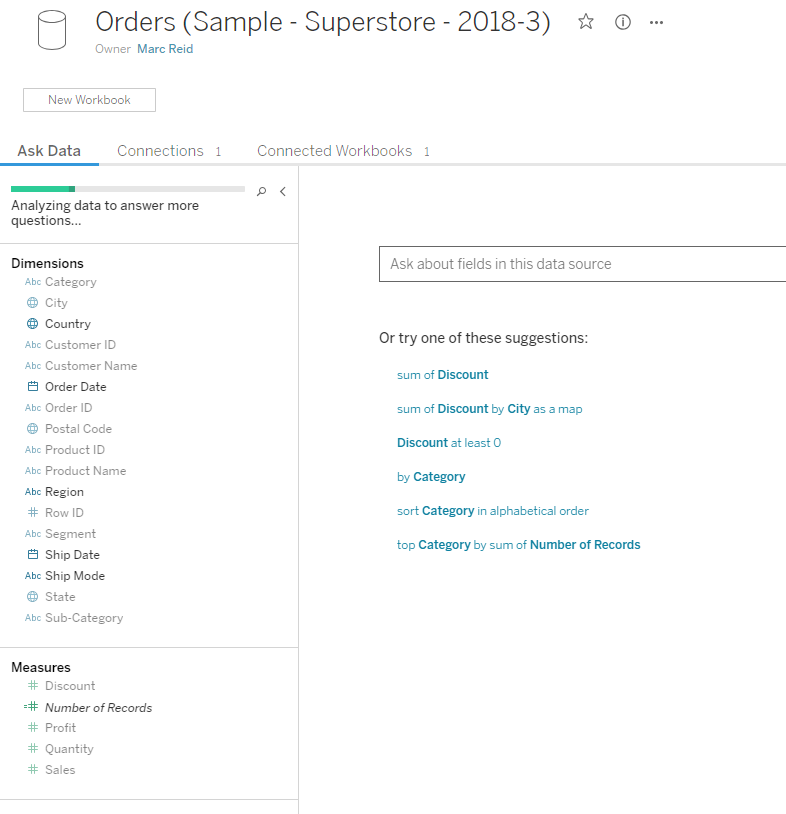
When accessing a data source for the first time, Tableau analyses it to be able to answer more questions, as can be seen by the green progress bar in the top left. This took about 15 seconds or so for the Superstore Sales Excel sheet I connected to.
Once this is complete, you can hover over the “i” icon to show a summary of the number of fields enriched, indexed and skipped:

An excellent feature of Ask Data (which isn’t at all related to the natural language functionality) is that when you hover over a field in the left pane, you are shown a summary of the field and some of its metadata, such as:
- Most common values
- Role of the field (e.g. Nominal Dimension, Continuous Dimension, Ordinal Dimension, Continuous Measure, Ordinal Measure)
- Type (e.g. Column Field, Calculated Field, Bin Field, Group Field)
- Remote Column name – the underlying source field that this column is populated from (which is useful if you have renamed the field in Tableau and need to know the name of the underlying field in the original data source)
- A preview of the calculation for calculated fields
Some examples are shown below where I have hovered over different fields:


A similar, though more powerful, feature also exists in Tableau prep for data profiling and this class of features is really helpful when working with a new dataset in terms of understanding the shape of the data, its range of values etc.
I really hope this feature makes it to Tableau Desktop. If you agree, please up-vote this idea on the Tableau Forums created by Sarah Bartlett: https://community.tableau.com/ideas/9692
Ok, let’s ask some questions!
The first question I ask is:
what are my sales by category and sub category?

Underneath where I type the question, Tableau inserts its interpretation in what I’ll call a cleaned up query format. It’s not happy that I left out the hyphen between ‘sub’ and ‘category’, so that’s not been picked up. When I press return a visual is produced showing the Sum of Sales by Category, and my natural language question text is replaced by Tableau’s version:

When I start typing in the question field again to add Sub-Category, a suggestion pops out below the question line:

The suggestion looks correct, so I click on it and Tableau add’s it to the end of my query (again, replacing my natural language text) and updates the charts, as shown below:

Pretty impressive so far. Without any dragging of pills to shelves or, more importantly, not even needing to know what those concepts mean, I have obtained answers to some initial questions about my data.
Changing the Chart Type
By clicking the chart type drop-down on the right, I can manually change the chart type to a treemap. Tableau also automatically updates the query string to add “as a treemap” at the end:

A nice feature of Ask Data is that if you have different names for how certain dimensions are referred to, you can create synonyms, which will help the natural language questions be interpreted correctly. Simply right-click on a dimension or measure and select Edit synonyms:

You can then enter a comma separated list of synonyms for that field. For example, here I’m adding Business Line as a synonym for the Segment field:

When I then type a new query using this synonym, Tableau automatically replaces it with the correct field in the query under my text:

Pressing return renders the correct view – using Segment:

Asking about dates
Ok, let’s make things a bit more difficult and restrict my query to ‘last year’:
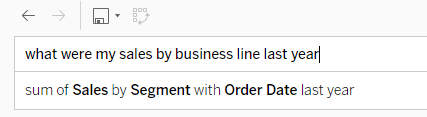
Tableau has no issues understanding this and produces a visual that includes a filter for last year:

Clicking on a field name in the query line brings up a dialog box allowing you to switch the field or change the Aggregation or Group by setting:

I scrolled down in the list of fields and changed Segment to Average Profit:

Tableau then changes the chart to a scatter plot as we now have two measures in the question:

Getting Geographic
I’m interested to see the relationship of sales to profit by state so I simply add “by State” at the end of the query and Tableau then updates the visual to a map:

The Experience
The query iteration process feels very smooth and I can see tremendous value in Ask Data being used by people who are not familiar with building views in Desktop or Web Edit but who need to self-serve their queries. The great thing is that, for those who are learning how to build views in Tableau, you can save the view that Tableau auto-creates in Ask Data and a) be able to see it’s construction, and b) go on to make further refinements and enhancements.
To save the view that Tableau creates, simply select the Save icon and provide a name and folder location on your server:

The new view then opens in Server Web Edit for the user to learn how it is constructed and go on to ask more questions using the traditional drag and drop method:

I’m really impressed with Ask Data and, as it gets used more and more, no doubt the natural language interpretation will continue to improve. This can really bring the power of Tableau to a whole new user base with different skill sets and needs.
Recommend
About Joyk
Aggregate valuable and interesting links.
Joyk means Joy of geeK