

Creating a ‘toggle help screen’ for your dashboard
source link: https://datavis.blog/2019/03/10/show-hide-containers/
Go to the source link to view the article. You can view the picture content, updated content and better typesetting reading experience. If the link is broken, please click the button below to view the snapshot at that time.

Creating a ‘toggle help screen’ for your dashboard
The Tableau Desktop 2019.2 beta, released a few days ago, has a great new feature that allows you to show and hide (floating) dashboard containers. This is a powerful feature that can be used to create new user interface experiences in Tableau, such as being able to show and hide all your filters.
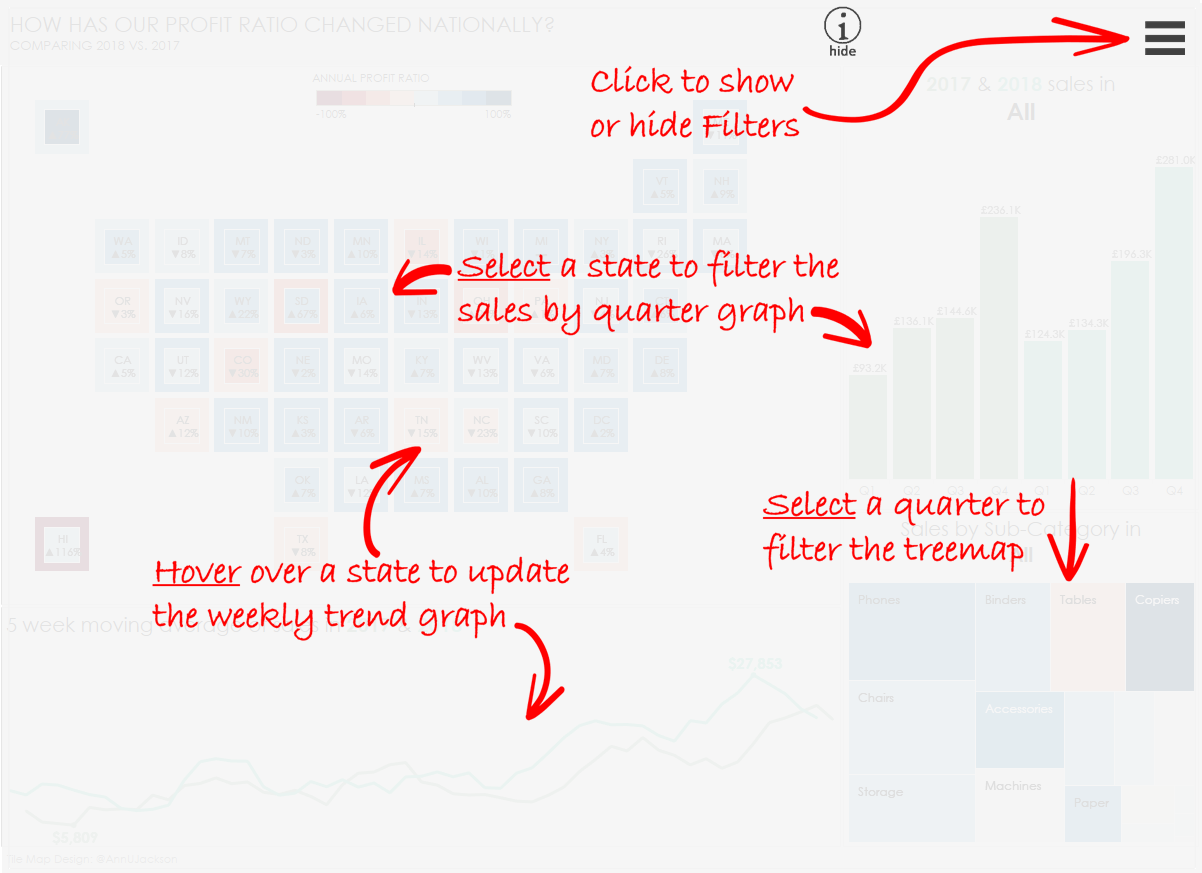
Another example – that this blog will walk through – is creating a help ‘overlay’ screen to sit on top of your dashboard that can be toggled on or off.
Final Goal
The Process
Start as normal and create your dashboard. Once complete, export an image of the dashboard from desktop:

Create Overlay in PowerPoint
Paste this image into PowerPoint and then add the annotation and arrows etc. that you need for your help overlay screen (I used arrow images from http://www.freepik.com):

Side note – you may recognise the tile map in this dashboard, which was originally created by Ann Jackson and used in a recent #WorkoutWednesday challenge.
To make it easier to focus on the annotations in the previous step, I made the dashboard image 80% transparent in PowerPoint:

When you have all help screen ready, delete the background image so you are left with the arrows and annotation only. Then add a border rectangle that has the same dimensions as your dashboard – this will make sure the overlay fills the entire dashboard space, which is important for a later step.
Select all the elements of the help screen and the border and export with the “Save as Picture…” option in PowerPoint:

Add Overlay to Tableau
Back in Tableau, add a floating container (horizontal or vertical) to your dashboard, then drop in your help overlay image. Now resize your container and position it so it overlays your dashboard exactly. It is easier to do this step using the position x and y inputs on the layout tab on the dashboard:

With the overlay in place, I wanted to grey out the dashboard behind it to some degree, so that the help annotations would be easier to read, but also to give a clear indication to the user that the dashboard was in a different (help) ‘mode’. To do this, select the container and add a light grey background with about 90% transparency:

Add a Toggle Button
Once the help screen is formatted as you wish, the next step is to make the container toggle-able (if that’s a word!) by adding a toggle button. Click the menu on the container and select Add toggle button:

This will add a default button, with an ‘eye’ icon, to the dashboard. This is an independent element on the dashboard that can be positioned and resized as desired.
With the toggle button added and the light grey background, the dashboard now looks like this:

Add Custom Button Images
The final step is to replace the default ‘eye’ image with two images of my own – one to be shown when the overlay is hidden and one to be shown when the overly is visible. These are the images I used (created in PowerPoint):

These can be added to the button using the Edit Button… menu option:

Tableau 2019.2 is set to be another big release with so many new features. For more details, take a look at Michael Sandberg’s detailed blog post here:
https://datavizblog.com/2019/03/07/tableau-releases-2019-2-beta/
If you’d like to join the 2019.2 beta program, head over to this page.
Thanks for reading!
Recommend
About Joyk
Aggregate valuable and interesting links.
Joyk means Joy of geeK