

Visualizing Ahoy analytics in Rails
source link: https://www.honeybadger.io/blog/ahoy-rails-analytics/
Go to the source link to view the article. You can view the picture content, updated content and better typesetting reading experience. If the link is broken, please click the button below to view the snapshot at that time.

Visualizing Ahoy analytics in Rails
Honeybadger co-founder Joshua Wood explains how to graph Ahoy page views in Rails with Chartkick, with a preview of our upcoming observability tool—Insights!
At Honeybadger, we use Ahoy for first-party analytics in Rails. Ahoy is excellent for developers because it lives in your Rails application alongside your other data and code. Want to answer a specific question about your product or website visitors? It's just one ActiveRecord query away:
Ahoy::Event.where_event("$view", page: "/").count
Ahoy also works with Chartkick and Groupdate to visualize your data. For example, after installing the two libraries, you can add a chart of all page views to any Rails view:
<%=
  line_chart Ahoy::Event.
    where_event("$view", page: "/").
    group_by_hour(:time).
    count
%>
The above code produces a chart like this:
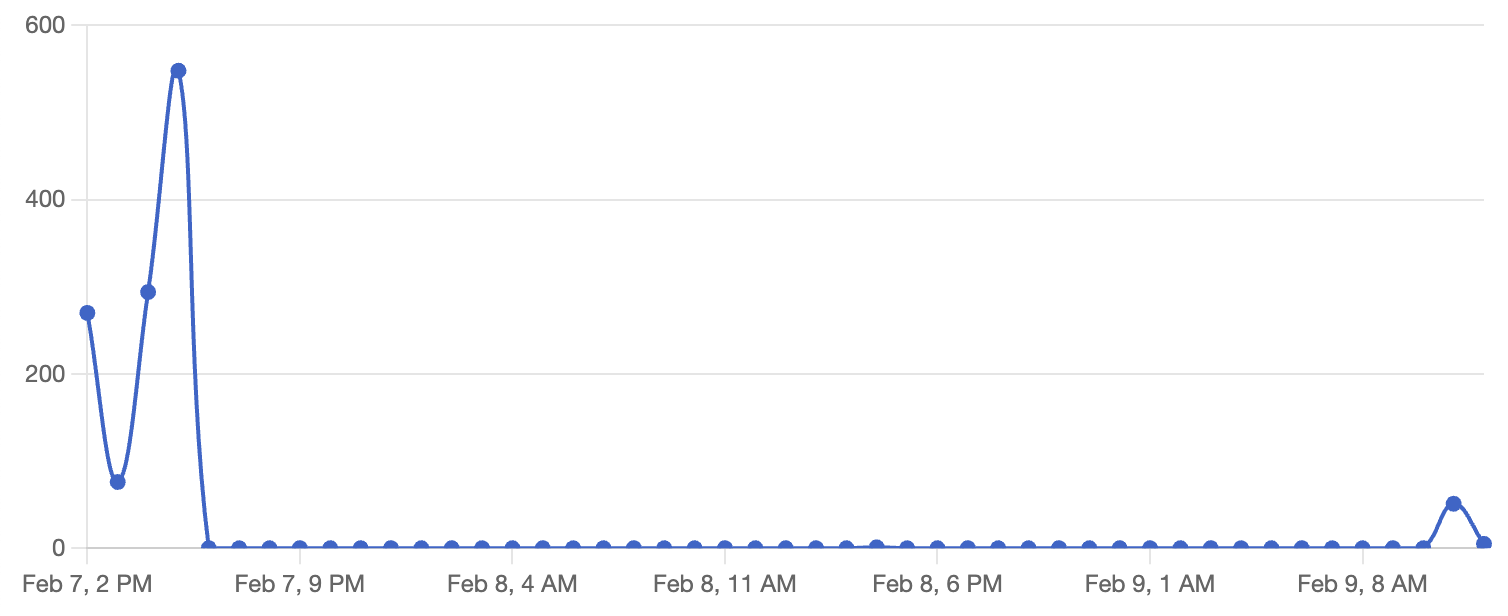
Charting Ahoy data with Chartkick
Ahoy and Chartkick are great for tracking analytics and building dashboards, but the downside is that you must deploy your app to make changes. If you find yourself regularly deploying to update your dashboards, you could try using Blazer, which lets you explore your data and create charts and dashboards with SQL.
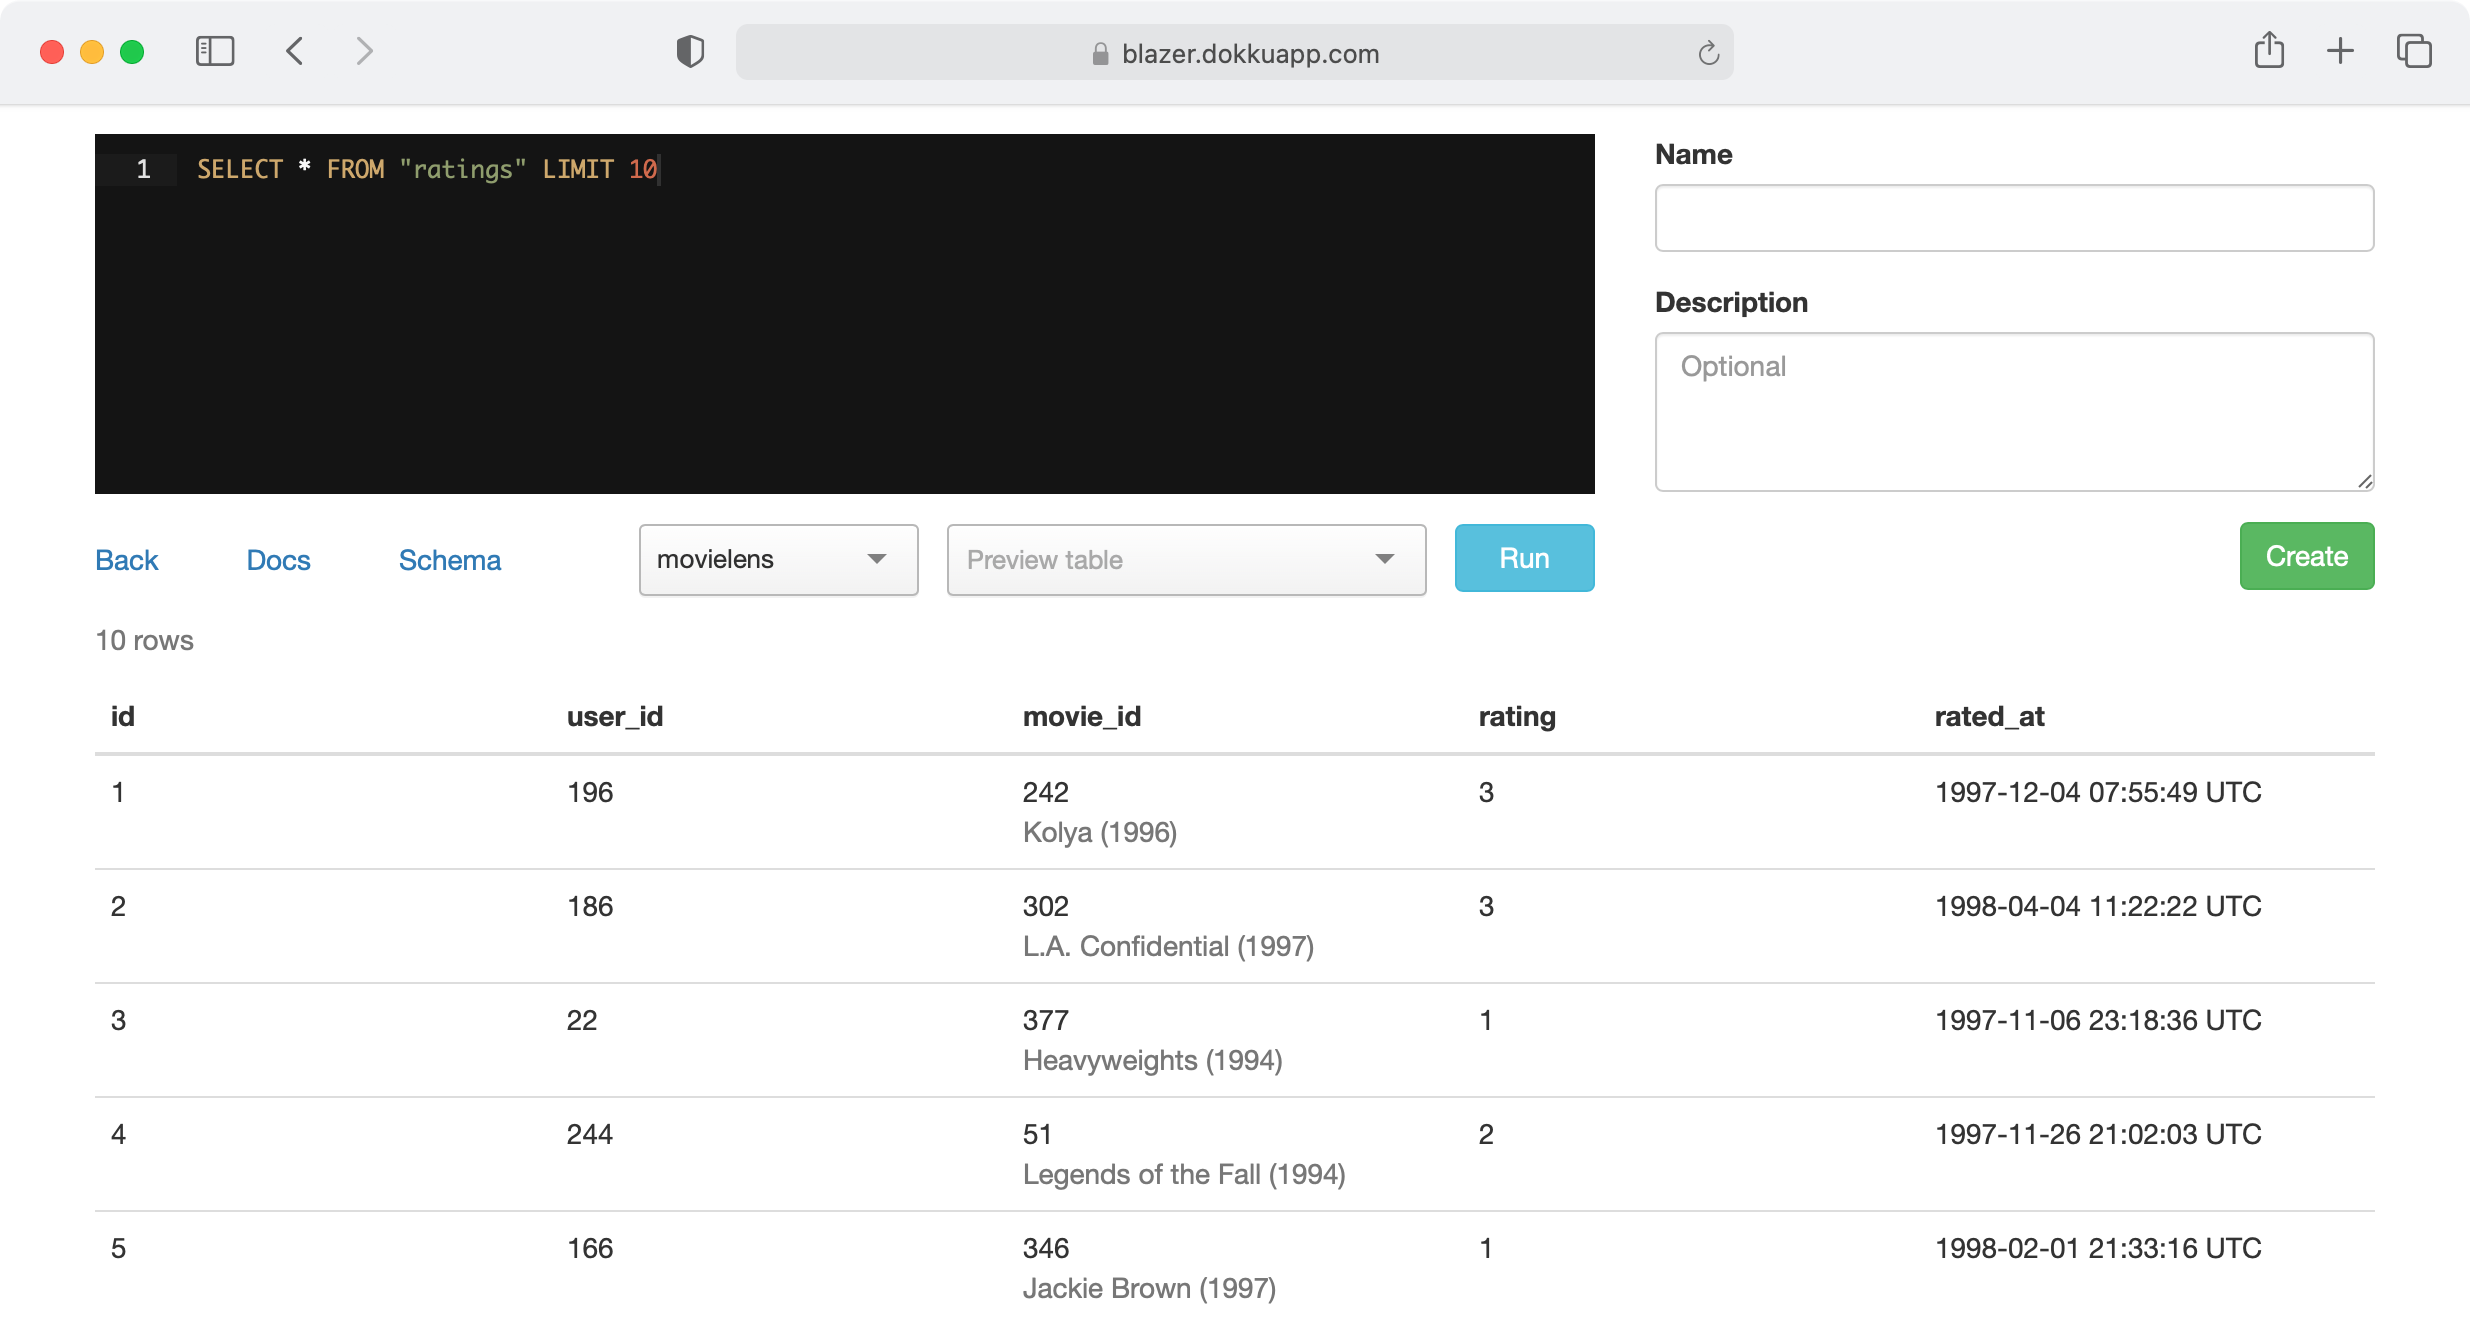
Screenshot from Blazer README
That said, SQL can be complex to work with. At Honeybadger, we've used the Ahoy+Chartkick+Blazer stack for years and recently augmented Ahoy's data store to send events to Honeybadger Insights so that we can explore our web analytics and create dashboards alongside our other observability data.
Integrating Ahoy with Honeybadger Insights
Honeybadger Insights is a new logging/observability tool that we're launching soon at Honeybadger. You can use our query language—BadgerQL—to dive into your Honeybadger data (errors, uptime events, etc.) and create charts and dashboards from BadgerQL queries. You can also ship us your application logs and custom events to have all of your data in one place.
Here's how to integrate Ahoy with Honeybadger Insights and create a similar chart to Chartkick using BadgerQL.
In Rails, if you aren't using the honeybadger gem yet, you'll need to install it. Follow the Rails integration instructions (usually takes just a few minutes).
If you're already use the honeybadger gem, I recommend upgrading to the latest version. First, make sure the honeybadger gem is pinned to version ~> 5.5 in your Gemfile:
# Gemfile
gem "honeybadger", "~> 5.5"
Then upgrade to the latest version:
bundle update honeybadger
Next, open config/initializers/ahoy.rb in a text editor, and modify the default Ahoy::Store to look like this:
class Ahoy::Store < Ahoy::DatabaseStore
  def track_visit(data)
    Honeybadger.event("ahoy_visit", data)
    super(data)
  end

  def track_event(data)
    Honeybadger.event("ahoy_event", data)
    super(data)
  end

  def geocode(data)
    Honeybadger.event("ahoy_geocode", data)
    super(data)
  end

  def authenticate(data)
    Honeybadger.event("ahoy_authenticate", data)
    super(data)
  end
end
That's it. To test in your development environment, you can run rails server with the HONEYBADGER_REPORT_DATA=true environment variable to temporarily turn off Honeybadger's development mode.
HONEYBADGER_REPORT_DATA=true rails server
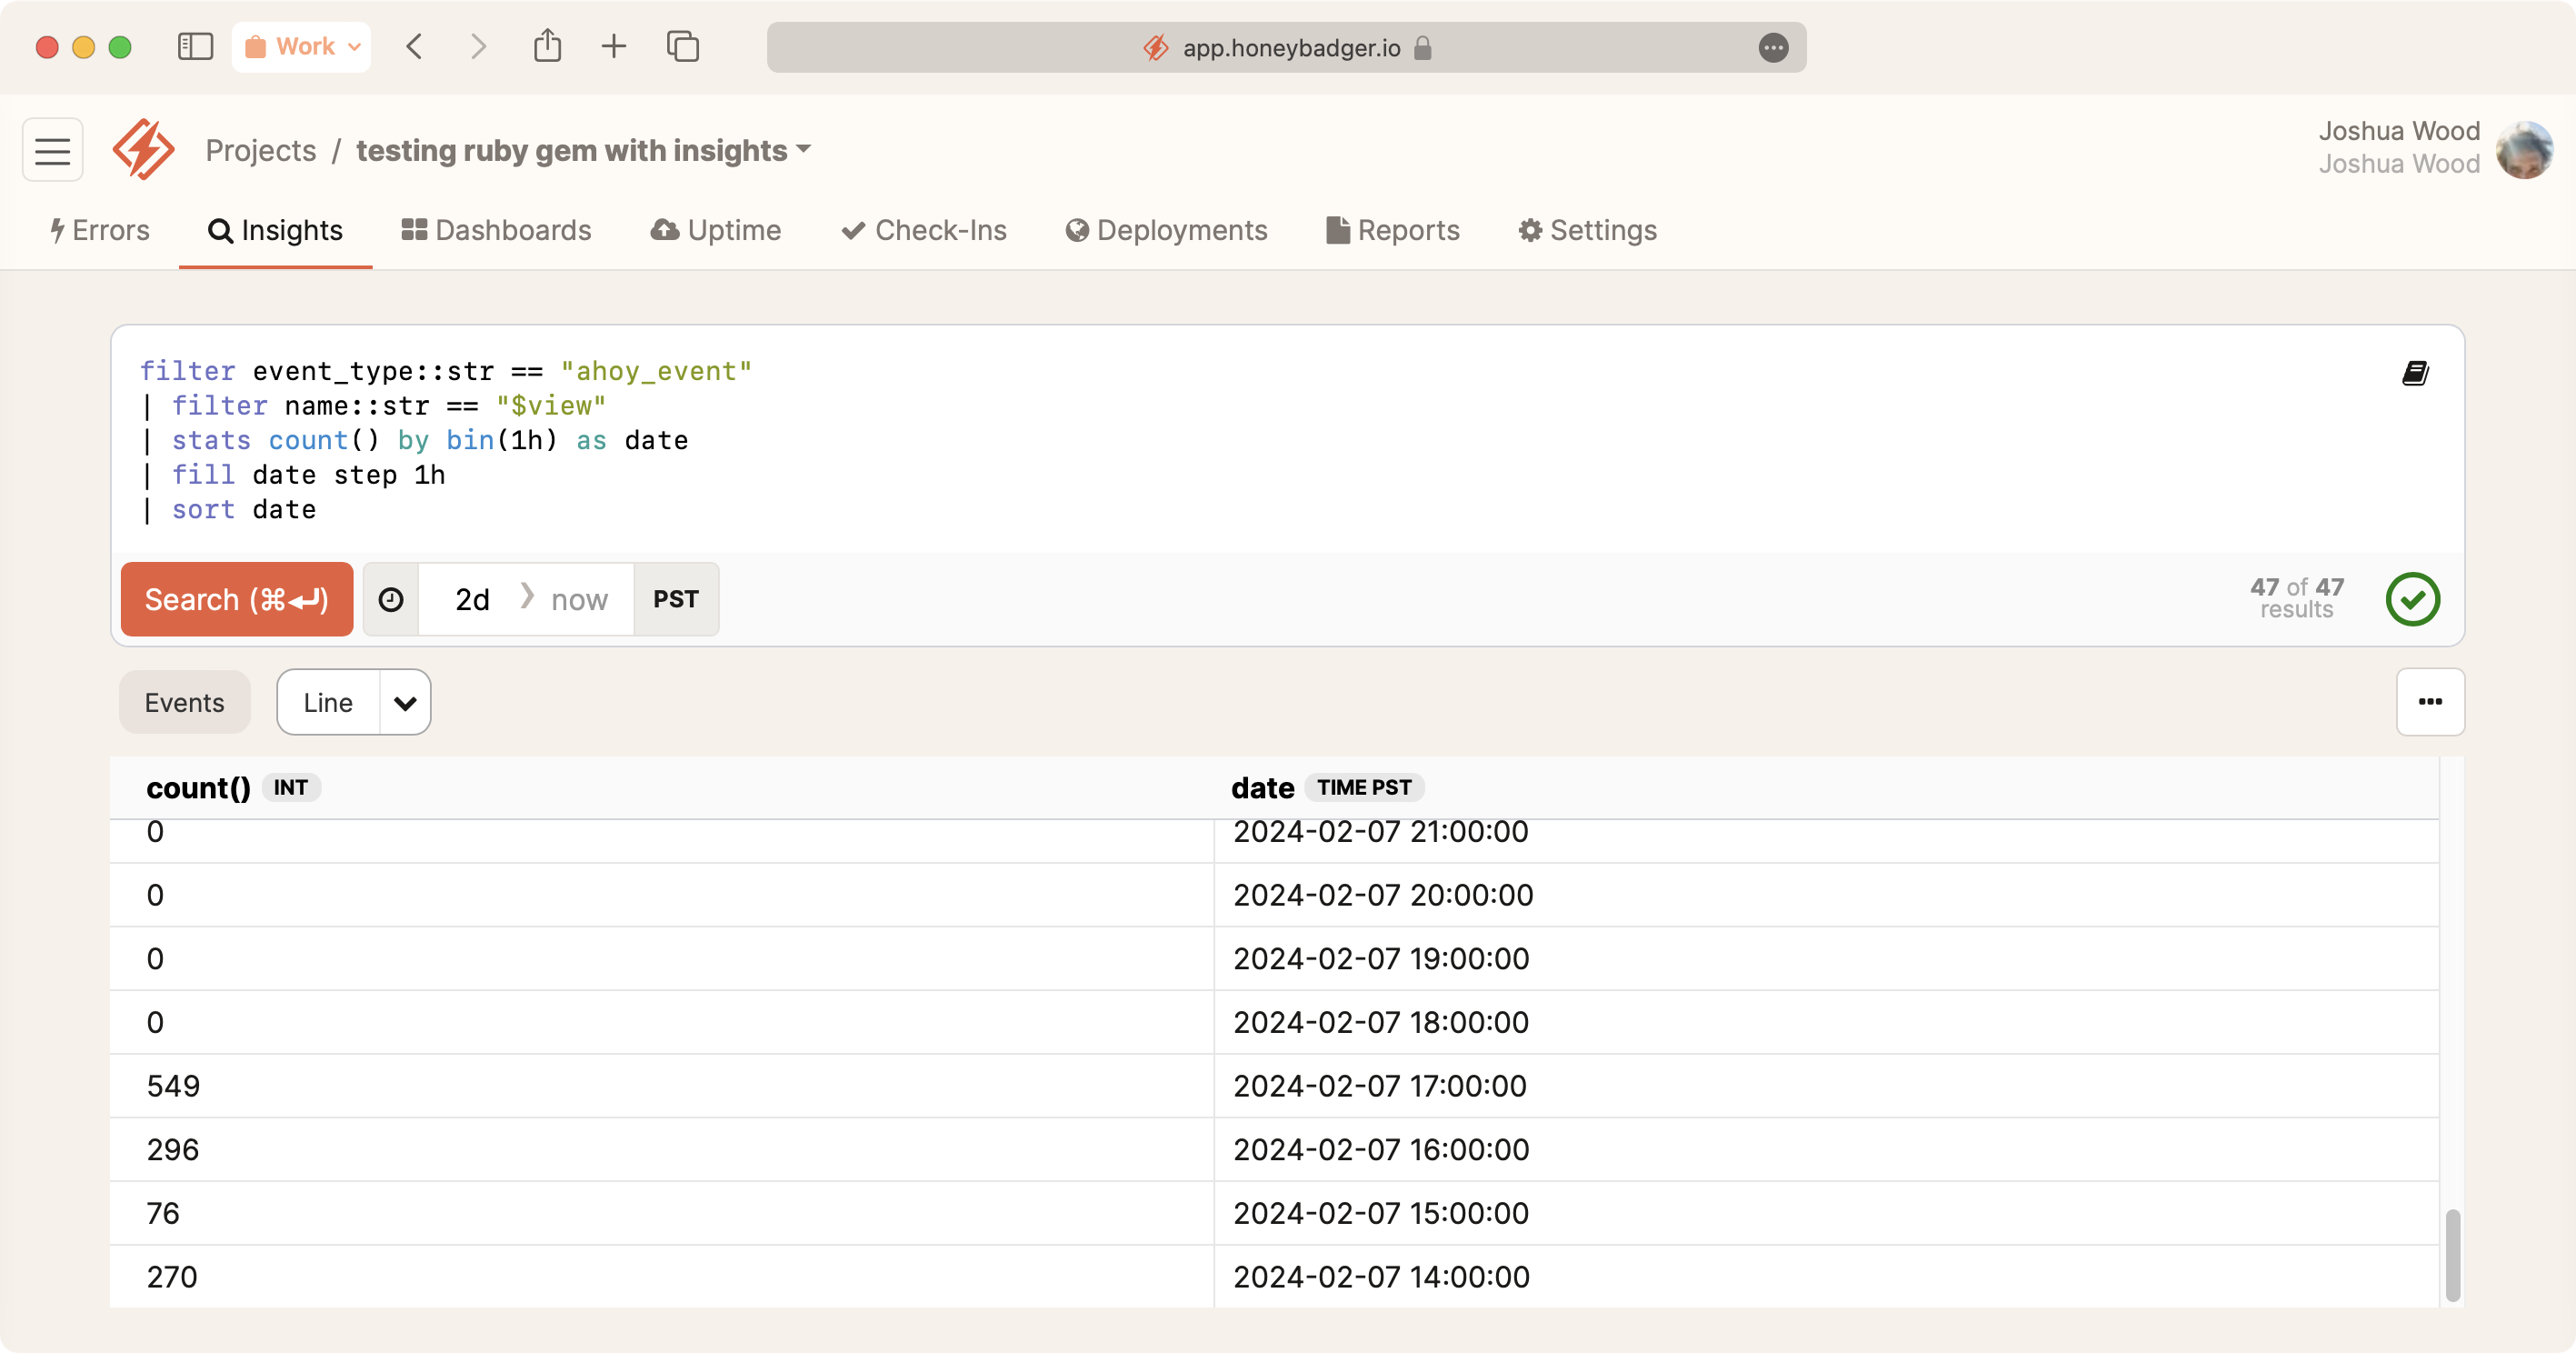
As Ahoy collects events, you should see them on the Insights tab in your Honeybadger project:
 now" indicates a search for the past two days up to the current time in PST (Pacific Standard Time). Below the search bar, the results display an "Events" view selected from a dropdown that also includes a "Line" view. Each entry corresponds to a timestamped event, labeled with "@ts" for the time in PST and "@preview" which contains JSON formatted data. The JSON data includes an "event_type": "ahoy_event" and an "event_id", with each event having a unique ID. All events are tagged with the name "$view", suggesting they are page or view-related events within the application, possibly tracking user interactions. The events are listed in reverse chronological order, the most recent being at "2024-02-09 12:02:11.000" and the oldest visible at "2024-02-09 11:53:53.000". The green checkmark indicates 100 of 100 results displayed successfully." />
Ahoy events in Honeybadger Insights
To create a chart similar to the Chartkick example above, drop the following BadgerQL into the query box and hit Search.
filter event_type::str == "ahoy_event"
| filter name::str == "$view"
| stats count() by bin(1h) as date
| fill date step 1h
| sort date
For a walkthrough of the BadgerQL in this query, check out my screencast on YouTube
Finally, toggle the Line button to visualize the data as a line chart:
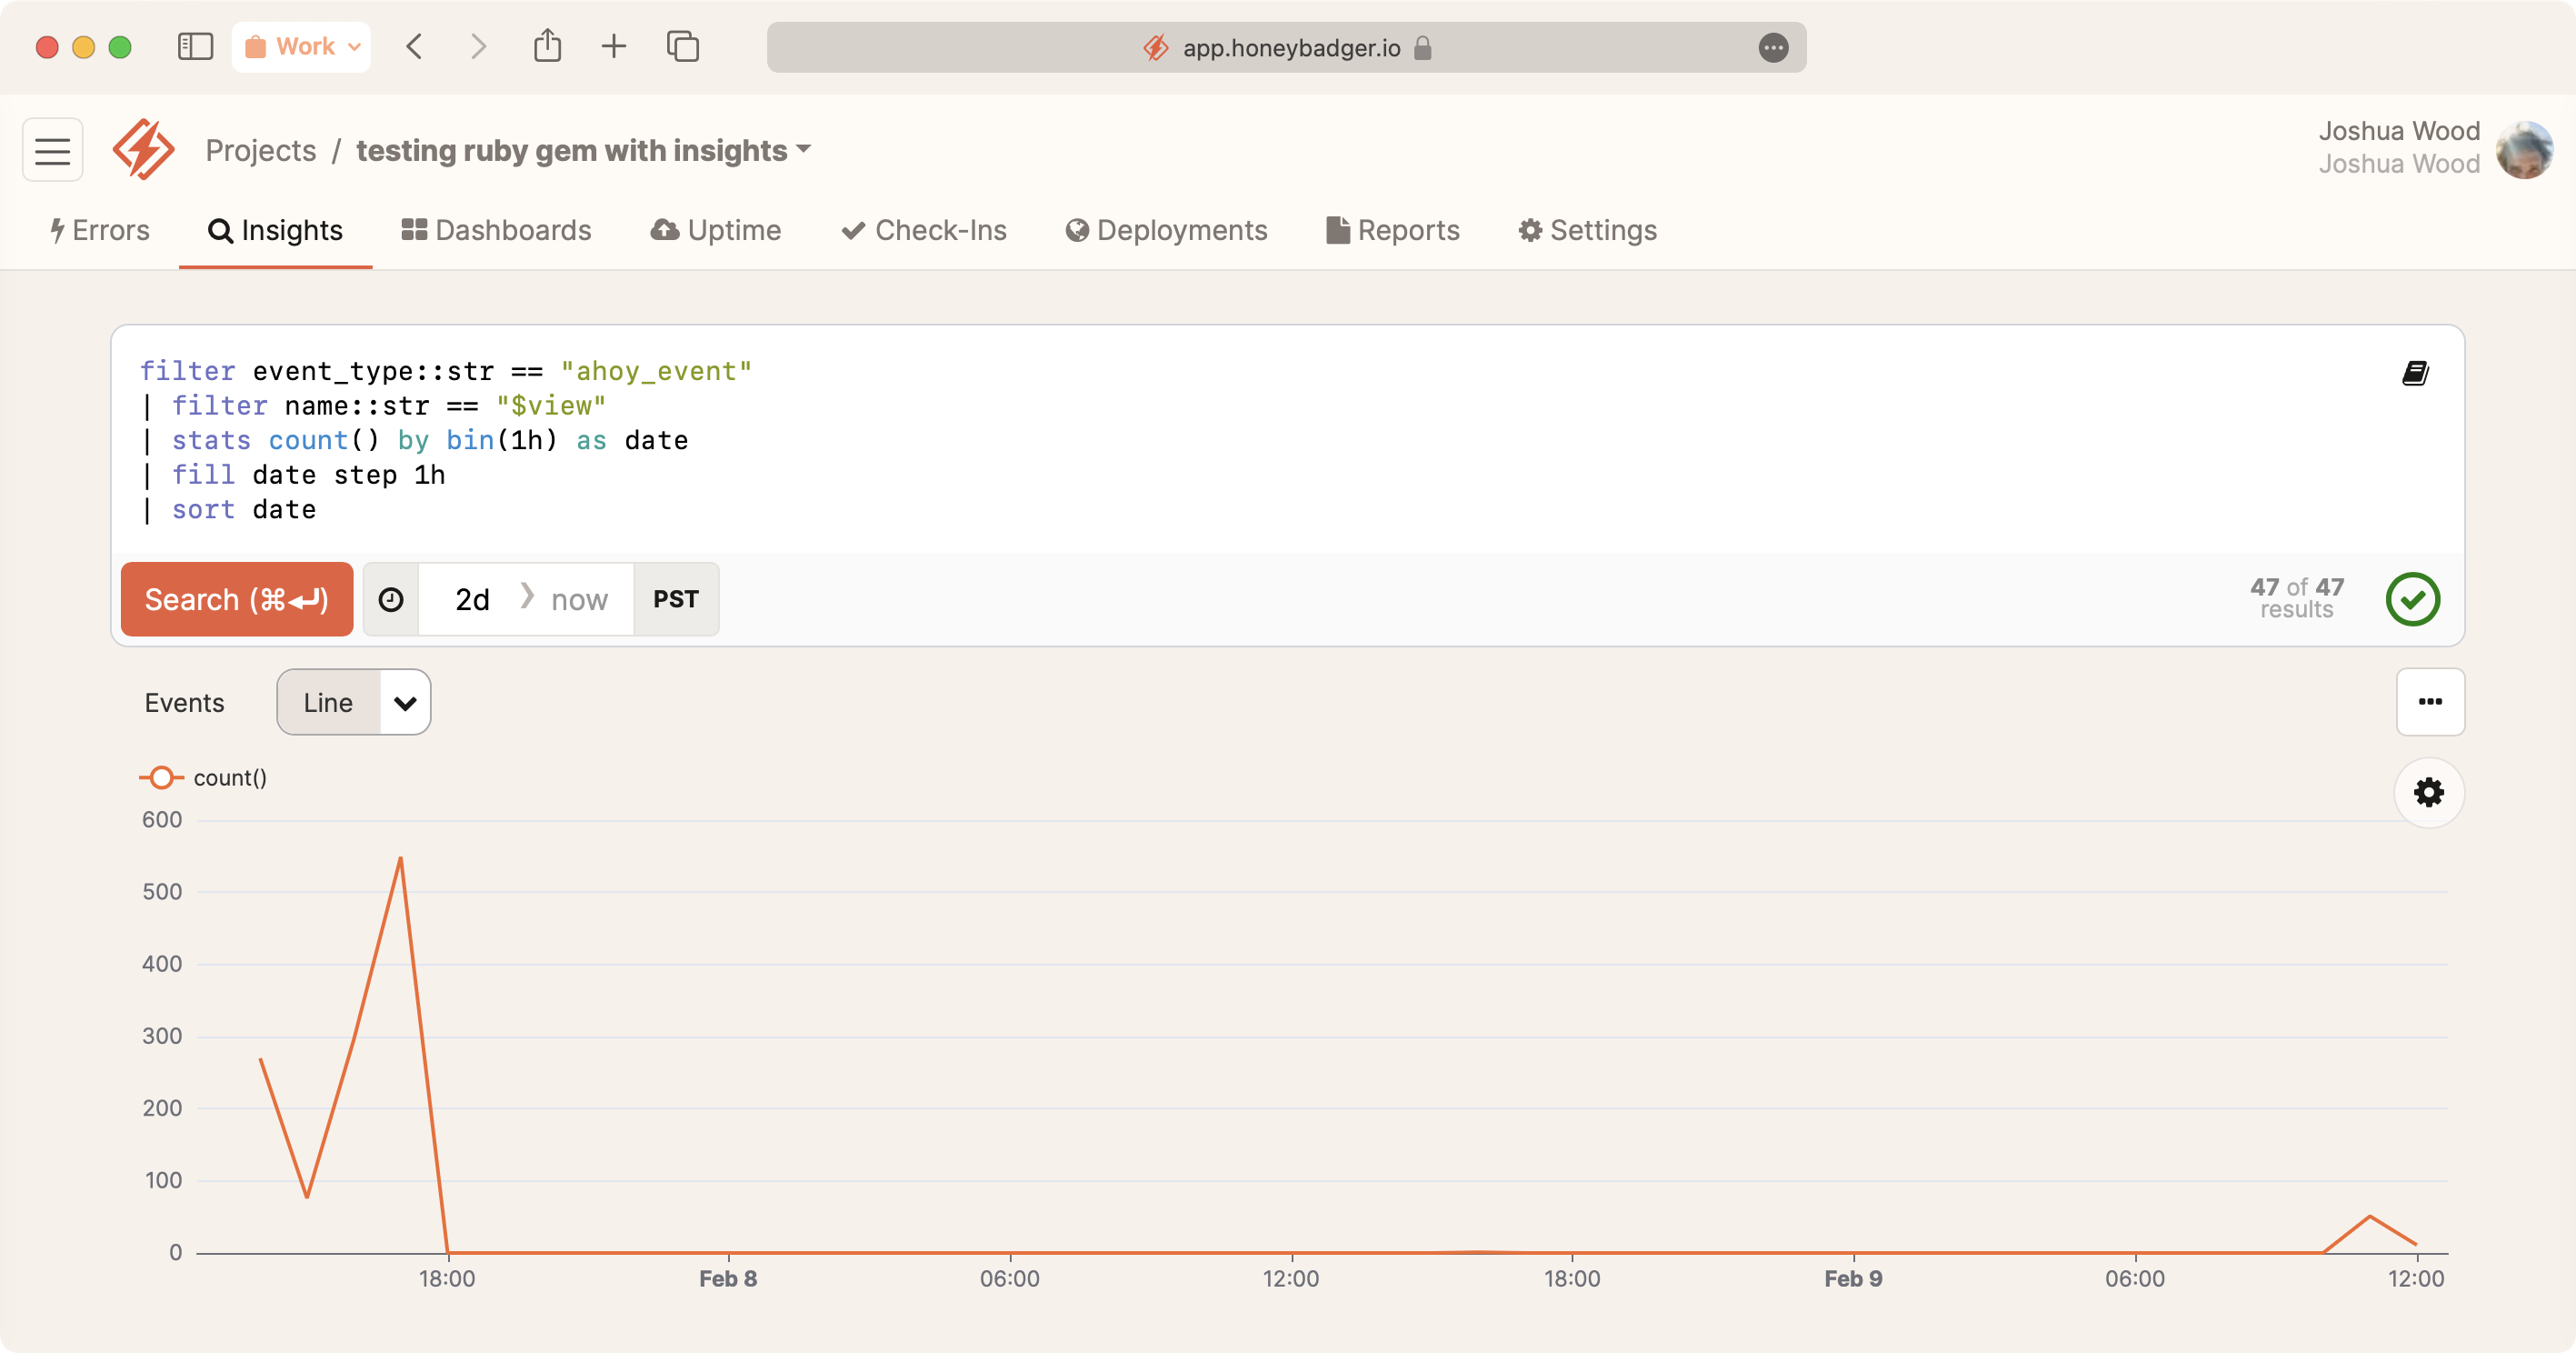
Ahoy chart in Honeybadger Insights
Sending our Ahoy data to Insights means we can query our web/product analytics and user events in the same place as our observability data. It's a significant upgrade for product-led teams like ours. If that sounds like you, check it out!
Send us an email to join the beta, or sign up to be notified when it launches for everyone (we won't use this email for anything else).
-
Try Honeybadger for FREEHoneybadger helps you find and fix errors before your users can even report them. Get set up in minutes and check monitoring off your to-do list.Start free trialEasy 5-minute setup — No credit card required
-
Get the Honeybadger newsletterEach month we share news, best practices, and stories from the DevOps & monitoring community—exclusively for developers like you.Include latest Ruby articles
Recommend
About Joyk
Aggregate valuable and interesting links.
Joyk means Joy of geeK