

Basis Daily Monitoring T-Codes
source link: https://community.sap.com/t5/technology-blogs-by-members/basis-daily-monitoring-t-codes/ba-p/13482892
Go to the source link to view the article. You can view the picture content, updated content and better typesetting reading experience. If the link is broken, please click the button below to view the snapshot at that time.

If someone is going to choose their career as "BASIS Consultant" We need to know the basics and daily activities of a basis person that needs to be performed on the system. I've listed a few activities which can help us to monitor the system performance.
SM51: SAP servers
Transaction code SM51 is to display a list of active application servers that have registered in the SAP message server. Further, you can manage & display the status, users, and work processes in all application servers belonging to the SAP System.

SM66: Global Work Process
SM66 is used to check the Active Work Process of all the instances. No, work process status should be in PRIVATE mode if it's then wp is consuming more memory.

If any work process is in PRIV mode, go to SM51 and Check the server name, instance number, and contact the user if he is working in the system or not. If the user is not available Cancel the process without the core.

SP01: Spool Request Selection
In SP01 t-code we check the Spool Request data.

Execute the report with the required date and if the requested data is more than 500 we will get a popup to select the entries.

At the end of the page, we can find the following data for the spool request.

SMGW: Gateway Monitor
The Gateway Monitor (transaction SMGW) is used for analyzing and administrating the gateway in the SAP system. We check the number of Active gateway connections.

SM37: Job Selection
Transaction code SM37 is used to monitor the background, batch jobs running in the system.
From the initial screen, you can search by the job name, user name, or program name accordingly with the time condition.
- Scheduled - Job already been defined, but the start condition has not yet been defined.
- Released - The job has been fully defined, including a start condition.
- Ready - The start condition of a released job has been met. A job scheduler has put the job in line to wait for an available background work process.
- Active - The job is currently running. Active jobs can no longer be modified or deleted.
- Finished - All steps that make up this job have completed successfully.
- Canceled - The job has terminated. This can happen in two ways:
- An administrator intentionally terminates the job
- A job step contains a program that produces an error, such as:
- An E or A error message in an ABAP program
- A failure return code from an external SAPXPG program

SM12: Lock entries
In SM12 we check the Lock entries. No lock entries should exist for more than 24hours. The number of lock entries should not exceed more than 500.

Check the list.

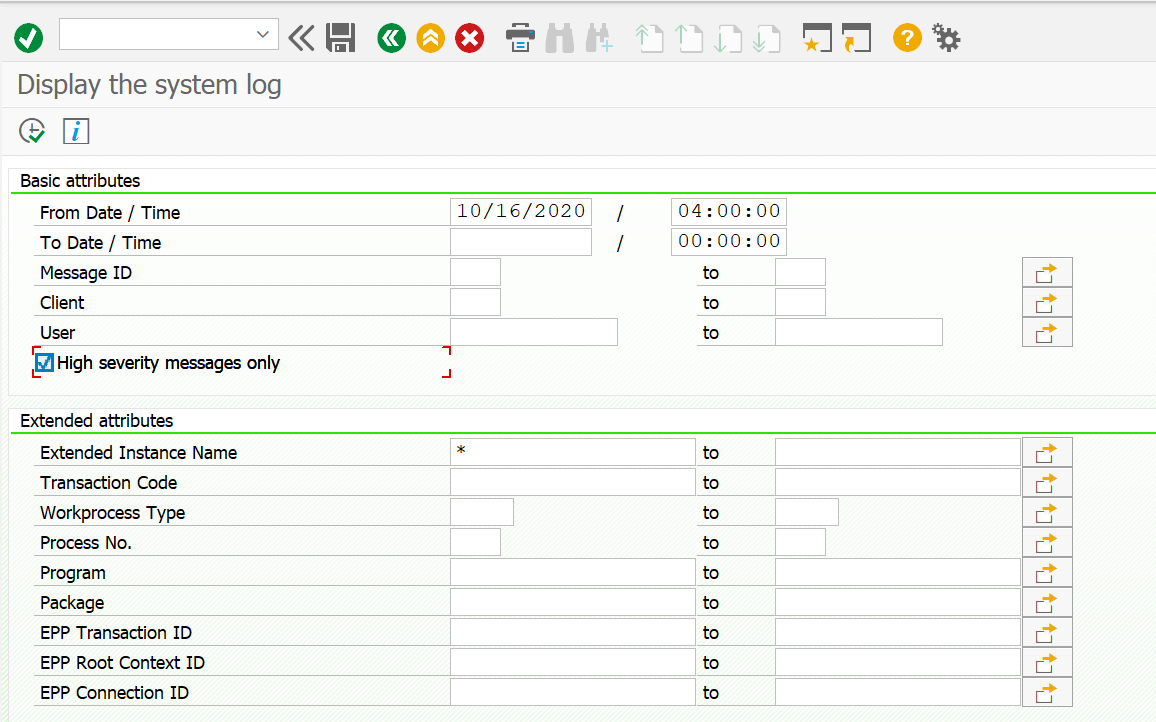
SM21: System logs
Transaction code SM21 is used to check and analyze system logs for any critical log entries. The SAP System logs are all system errors, warnings, user locks due to failed login attempts from known users, and process messages in the system log.
- From the initial screen, go to System Log -> Choose -> All remote system logs. Set the date a day before and click on the Reread system log.
- In the system log analysis window, you can check/analyze the critical error message by double-clicking it.
The list can be restricted for Problems Only, Problems, and all messages.
SM13: Update Records
Here we check the update records of the system which are getting canceled. If the records are reached more than 50 then we need to take action.

ST22: ABAP dumps
Transaction code ST22 is used to lists the ABAP dumps generated in the system, we can check for a date, user as required.

Every dump indicates the reason for the error, transaction code, variables that caused the error. The types of error can be of various kinds for which action is to be taken to fix this error from happening again after analysis.
SMQ1: qRFC Monitor (Outbound queue)
We need to check if any outbound entries got stuck in the queue. If so check with the respective job owner and re-execute the entries.

SMQ2: qRFC Monitor (Inbound queue) We need to check if any Inbound entries got stuck in the queue. If so check with the respective job owner and re-execute the entries.

SM58: Transactional RFC
In SM58 we can check the transactional RFC errors if any occurred.

We can observe different types of errors for different functional modules check the target system entries and perform the required analysis if the user requires it then we can re-execute those entries or else we can delete the entries from the system. For example, we are deleting the WORKFLOW_LOCAL_100 Entries.

Go to the log file -> Reorganize

Enter the target system name in Destination box->And check the boxes as shown in the below screenshot-> Execute the program.
We are supposed to delete only Connection errors, System error, and Already Executed.

ST02: SAP Memory Configuration monitor
SAP Memory Configuration monitor checks the SAP Buffers and SAP Memory areas for problems such as swapping.
It is a snapshot of the utilization of SAP shared buffers.
High watermarks of utilization for example extended, roll, paging, and heap memory can be obtained from the SAP memory configuration monitor.

ST06: Memory Overview / Operating System Monitor
The operating system provides the instance with the following resources:
- Virtual Memory
- Physical Memory
- File system Administration
- Physical disk
- Network
You can use the operating system monitor to monitor the system resources that the operating system provides. The operating system collector SAPOSCOL collects these resources.

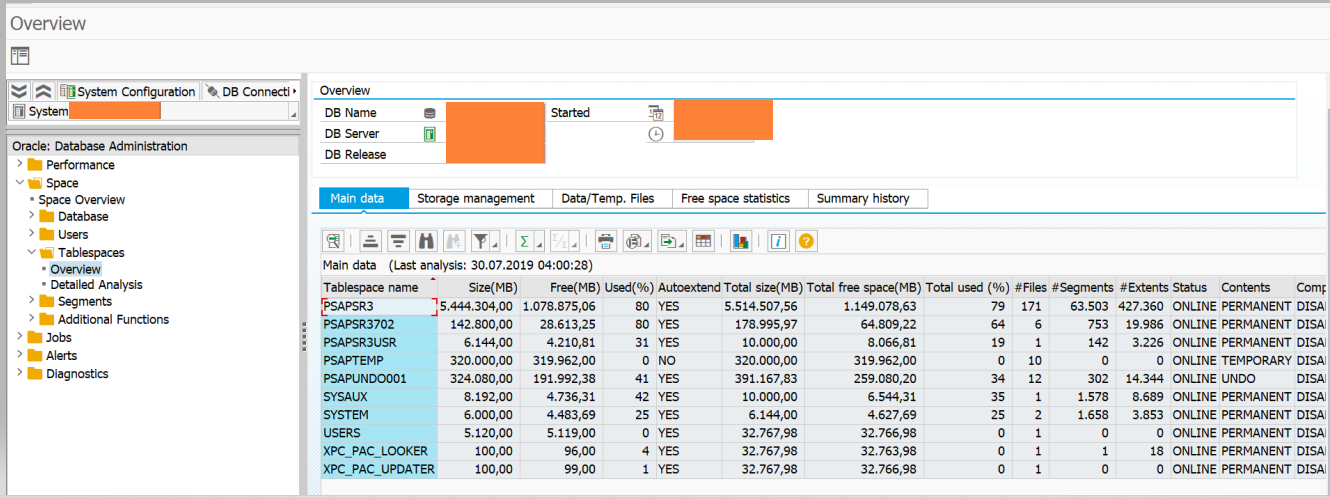
DB02: DBA Cockpit
Transaction code DB02 is to analyze and monitor database statistics (DB growth, tablespace size, missing index &, etc.).
- Check Tablespace size. Go to Tablespaces -> Overview. If a tablespace size is reaching a 95% level, it’s advisable to increase the size. The Auto-extend should be Yes.
SMLG: Load Distribution We need to check this tcode for performance issue, here we check the Response Time in load distribution of the Instance.

Go to-> SMLG -> Load Distribution icon

ST03N: Workload analysis
The ST03 Workload Monitor is the central access point for analyzing performance problems in the SAP system. ST03N is a revised version of the transaction ST03. In the current SAP Releases transaction, ST03N replaces transaction ST03 and is automatically started when you enter transaction code ST03.
Here you can compare the performance values for all instances, and compare the performance of particular instances over a period of time. Due to the number of possible analysis views for the data determined in transaction ST03, you can quickly determine the cause of performance problems.
You can use the workload monitor to display the following, among other things:
- Number of instances configured for your system
- Number of users working on the different instances
- Response time distribution
- Distribution of workload by transaction steps, transactions, packages, sub-applications, and applications
- Transactions with the largest response times and database time
- Memory usage for each transaction or each user per dialog step
- Workload caused by RFC, broken down by transactions, function modules, and destinations
- Number and volume of spool requests
- Statistics about response time distribution, with or without the GUI time
- Optional: table accesses
- Workload and transactions used by users, broken down by users, accounting numbers, and clients
- Workload generated by requests from external systems

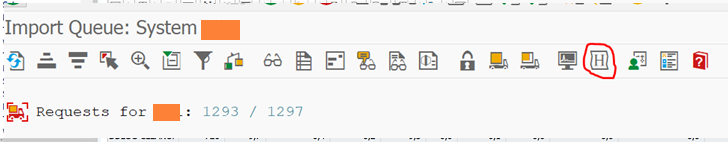
STMS_IMPORT: Transport Request
This tcode is used to import the transport requests to the system. But for daily monitoring purposes, we use it to check the import history.
Go to-> STMS_IMPORT -> select the History Icon.
SCC4: Clients Overview
In SCC4 we check whether the client is open or closed.
Go to -> SCC4 -> select the Production Client
If the Changes and Transports for Client-Specific Objects are -> No Changes Allowed then Client is Closed. Other than that any option is selected then the client is Opened.

Also, make sure Cross-Client Object Changes are set to No Changes to Repository and cross-client Customizing Objects.
Many thanks for taking the time to read my blog and I hope by reading this blog you can perform all the System monitoring activities in SAP ECC&S/4, BW, GRC Systems. I also welcome any comments, opinions, and feedback on my blog.
Recommend
About Joyk
Aggregate valuable and interesting links.
Joyk means Joy of geeK