

SAP Datasphere Analytic Model Series
source link: https://community.sap.com/t5/technology-blogs-by-sap/sap-datasphere-analytic-model-series-data-model-introduction/ba-p/13550812
Go to the source link to view the article. You can view the picture content, updated content and better typesetting reading experience. If the link is broken, please click the button below to view the snapshot at that time.


Figure 1: A complex data model that we’ll use along the entire blog series

Introduction
The SAP Datasphere Analytic Model Series is intended to provide you with useful guidance on how to utilize the new Analytic Model to leverage the potential of your data landscape. The Analytic Model allows for rich analytical modelling in a targeted modelling environment and will be THE go-to analytic consumption entity for SAP Datasphere.This article is the second in the blog post series and introduces an example data model that we’ll use along the entire blog series listed below:
In this blog, we describe the data model structure and help you import it with data. As a result, you’ll have a rich model for your own experiments with the Analytic Model and you’ll also be able to immediately apply the learnings of upcoming blogs since they are all based on exactly this model.
Understanding the Data Model
Data model consists of sales opportunity data of employees for various products and customers of the company across different cost centers within sales organizations of the company.Also, Time related Dimensions linked to data model provide options for doing time related drilldown, reporting and filtering. Moreover, Hierarchies for Employees and Products can be used for further analysis.
Some of the example reporting scenarios are mentioned below:
- Identify Top/Bottom N Employees in current month/quarter/year in terms of Sales opportunity value.
- Identify total value of Missed opportunities across products in current month/quarter/year
- Identify Top/Bottom N Products in terms of Sales opportunity value
- Sales Opportunity Data
- Header Table - MCT_Opportunities
- Item Table - MCT_OpportunityItems
- Product data
- Product dimension with hierarchy - MCT Products
- Product categories dimension table - MCT_ProductCategories
- Product Groups texts table - MCT_ProductGroupTexts -
- Controlling Area data
- Dimension MCT_ControllingArea
- Cost Center data
- Dimension MCT Cost Center
- Sales Organization data
- Dimension - MCT_SalesOrganization
- Sales Organization Texts - MCT_SalesOrgText
- Item Status Texts - MCT_ItemStatusTexts
- Employee data
- Dimension with hierarchy data - MCT_Employees
- Time data
- Dimension Day - SAP.TIME.VIEW_DIMENSION_DAY
- Translation Table – Quarter - SAP.TIME.M_TIME_DIMENSION_TDAY
- Translation Table – Month - SAP.TIME.M_TIME_DIMENSION_TMONTH -
- Translation Table – Day - SAP.TIME.M_TIME_DIMENSION_TQUARTER

Figure 2 : Impact and Lineage Diagram of the sample data model
To check the association further in detail, please refer the tables and views associations once you have imported the data model into SAP Datasphere.Importing the Data Model
For data model import, it’s preferred to create a new space. However, you can use existing spaces if you are confident that there will be no conflict which will arise due to the existing objects like Table, Views in your space.1. As a first step, download the ZIP files from below path to your local directory. It contains the data CSV files and the CSN export for the data model.
https://sap-my.sharepoint.com/:f:/p/jai_gupta/Eonw6KzV8GtNqUrVhS6db5oBgumWYc6F0JsATn_wINQA2g?e=UgCnU...

Figure 3: Item List screenshot zip file
2. Next, go to your space and click on “Create Time Tables and Dimensions”, as shown below.
Figure 4: Space Builder Time Dimension and Tables
3. Then click on Create in the opened dialog without changing anything.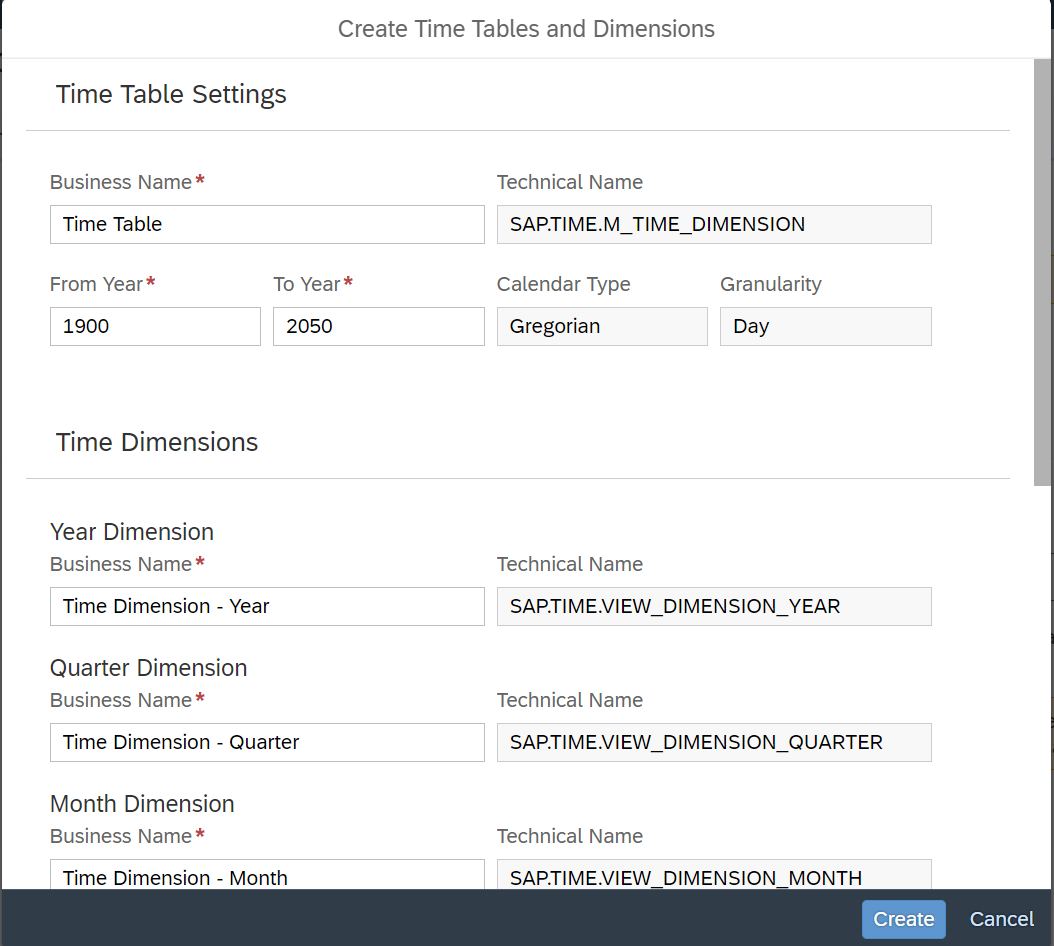
Figure 5: Time Dimension and Tables Dialog
4. Next, open your space in the Data Builder and check whether the Time Dimensions and tables you created previously are deployed in the space, as shown below
Figure 6: Time Dimension and Tables Data Builder
5. Once verified, click on Import Objects from CSN/JSON files, as shown below.
Figure 7: Import CSN/JSON File Data Builder
6. Here, in the opened dialog select the file ER_MCT_MEDIUM.json for import.
Figure 8: Choose JSON File
7. From the opened dialog, select all the objects and click on Import CSN File, as shown below.This will create the missing tables and views for the data model in your space and will create associations between them.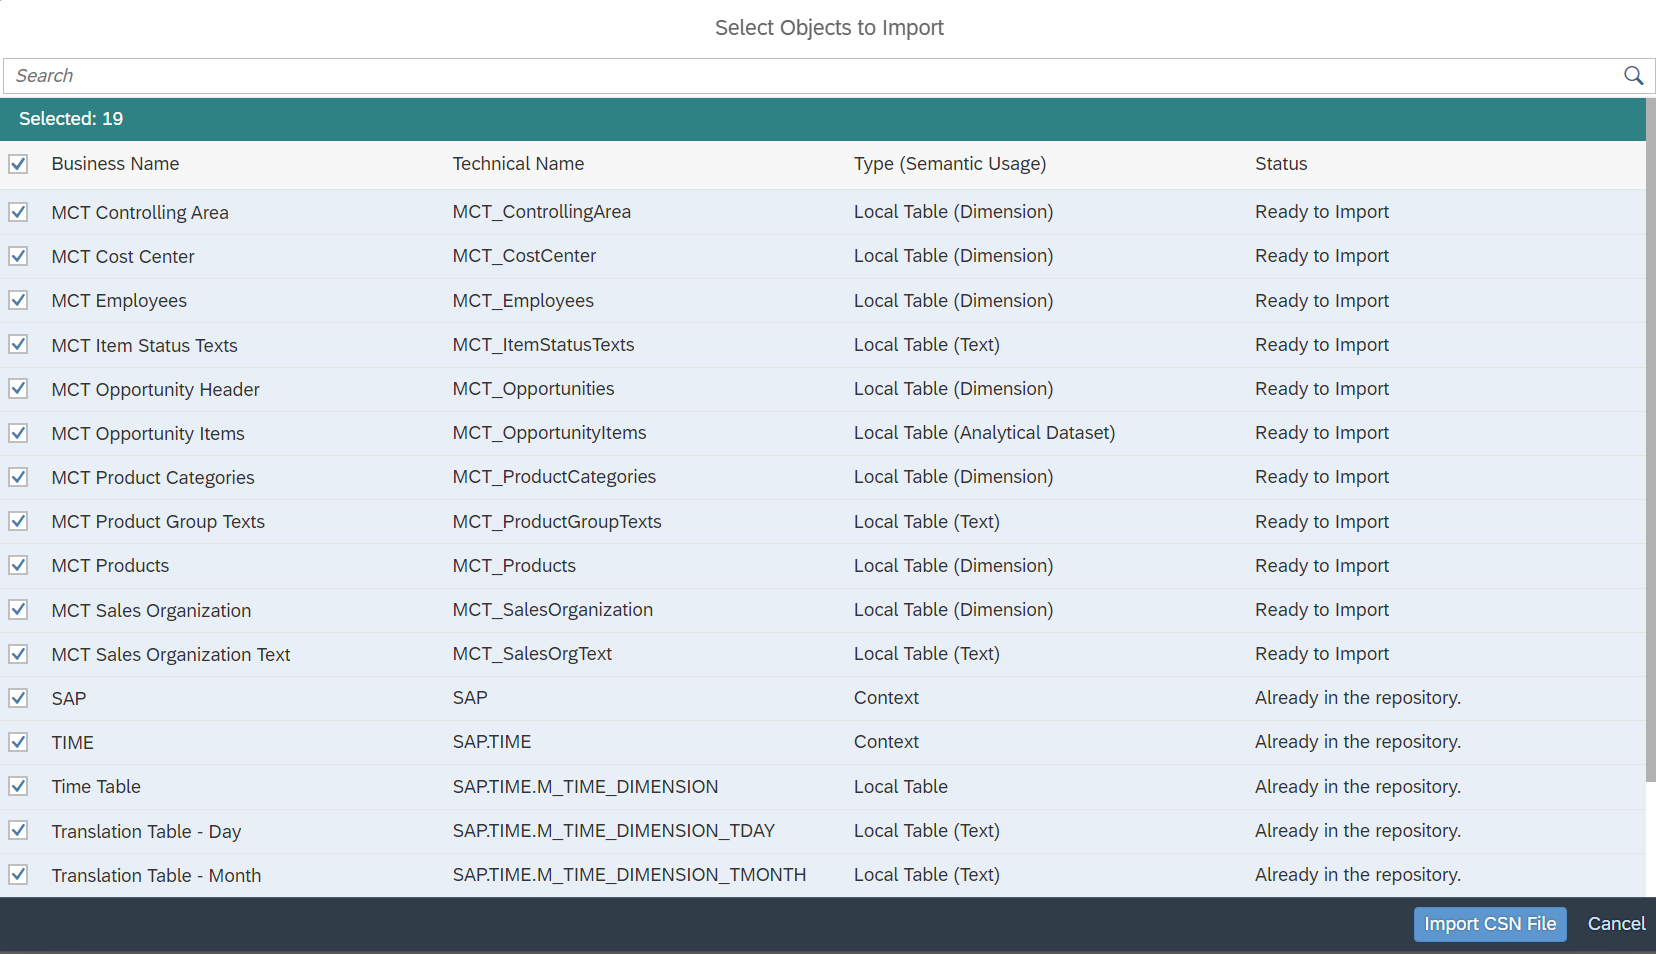
Figure 9: Import CSN/JSON File Objects
8. Next, go to Tables in Data Builder and check for imported objects, as shown below. All the tables will be in Not Deployed status, as shown below.
Figure 8:Imported Tables status
9. Now, open the table MCT Opportunity Items and click on Deploy, as shown below. This will deploy the table along with all the associated tables.
Figure 9: Deploy Table
10. Next, upload the csv file to import the data in the MCT Opportunity Items, as shown below.
Figure 10:Upload CSV data in Table
11. Click on Choose File and select MCT_OpportunityItems.csv, as shown below.
Figure 11: Choose the csv file
12. If you are importing the data for the first time then keep the default settings and upload the file by clicking on Import, as shown below. Otherwise, select the checkbox Delete Existing Data before Upload to make the table empty before importing anything.
Figure 12: Preview CSV file for Import in Table
13. Next, check the Table data preview to validate if the file data has been uploaded correctly.
Figure 13: Preview Table Data
14. Once everything is verified, switch back to Data builder and you will notice all the associated tables have been deployed.
Figure 14: Check Associated Tables
15. Next upload the data in the remaining tables by opening them and importing the CSV files for each table like we did in the above steps for MCT Opportunity Items tables.As an example, please refer below screenshots where CSV file is being uploaded to table MCT Employees.

Figure 15: Example - Upload CSV data in Table

Figure 16: Select relevant CSV file

Figure 17: Preview CSV data
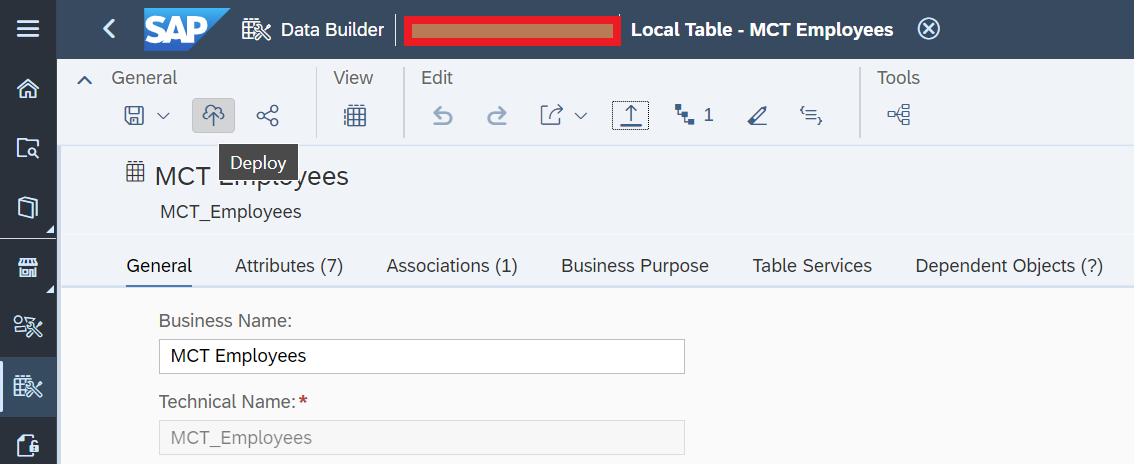
Figure 17: Deploy Table if needed
Note: Please do remember to complete the data upload activity for all the remaining tables and don’t forget to deploy the tables if they are in Not Deployed status.16. Next, go to Data Builder -> Views and deploy the Analytical Data Set(ADS) V_MCT_OpportunityItems_v2 by opening it and clicking on Deploy.

Figure 18:Open ADS

Figure 19: Deploy ADS
17. Once deployed, you can create an Analytic Model directly on top of this ADS by going to its Details properties and clicking on Create Analytic model, as shown below.
Figure 20: Analytic Model creation from ADS
18. Give your Analytic Model a Name and click on Deploy. Next check the Impact and Lineage, as shown below.
Figure 20: Analytic Model
19. Choose Dependency Analysis, and observe the relationships and associations between different tables and views which are feeding the Analytic Model.
Figure 21: Analytic Model Lineage
20. Then, quickly check the data preview in Analytic Model to make sure it is working fine, as shown below:
Figure 22: Analytic model Data preview
20. Subsequently, you can use Analytic Model in SAP Analytics Cloud as well. For that go to SAP Analytics Cloud and choose Optimized Design Experience. Furthen, you can add custom calculated measures or attributes to stories created on top of Analytic Model within SAP Analytics Cloud.Currently, we are working on making this data model available as a data product on SAP Datasphere Marketplace which will remove the need of using zip files and further streamline the import process.
Once it is available, the blog we will be updated or a new blog will be published to show an alternative on how the data model can be imported from SAP Datasphere Marketplace and used in Analytic model.
In the upcoming blogs, we will explore the different features in Analytic Model and show few reporting scenarios which can be fulfilled using this data model.
Conclusion
This blog introduced the data model that we’ll use along the entire blog series, helped you fill it with data and subsequently build an Analytic Model on top of it.Thanks for reading! I hope you find this post helpful. For any questions or feedback just leave a comment below this post. Feel free to also check out the other blog posts in the series.
Best wishes,
Jai Gupta
Further Links

Recommend
About Joyk
Aggregate valuable and interesting links.
Joyk means Joy of geeK