
6

vue3+ts打开echarts的正确方式 - 唯之为之
source link: https://www.cnblogs.com/weizwz/p/17933635.html
Go to the source link to view the article. You can view the picture content, updated content and better typesetting reading experience. If the link is broken, please click the button below to view the snapshot at that time.

实例项目使用 vite5 + vue3 + ts,项目地址 vite-vue3-charts,预览地址 https://weizwz.com/vite-vue3-charts
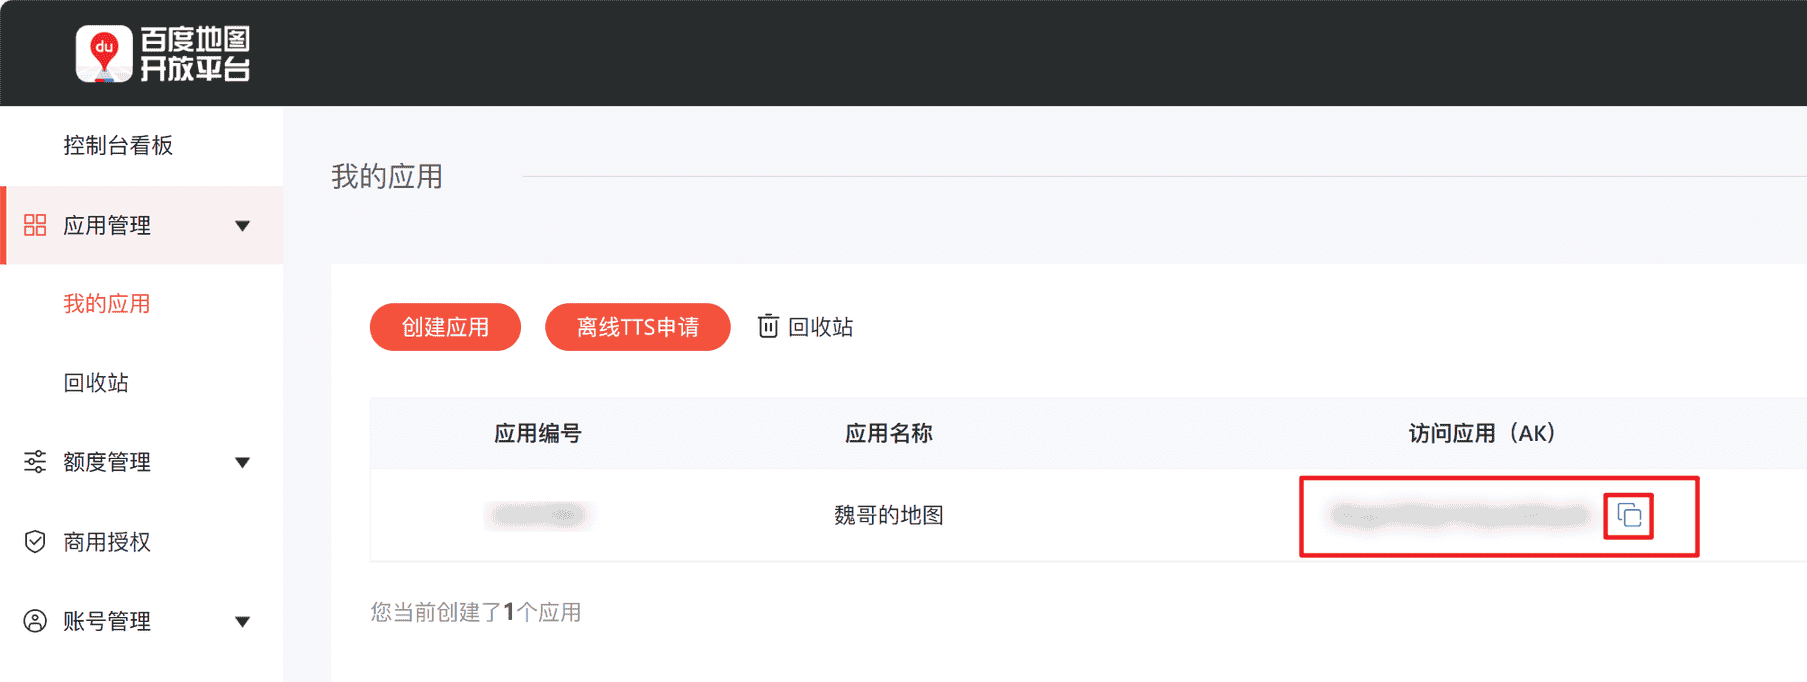
1. 注册为百度地图开发者
官网地址,然后在 应用管理 -> 我的应用 里,创建应用,创建好后复制 AK
2. 在根目录的 index.html 里引入百度地图
<head> <meta charset="UTF-8" /> <link rel="icon" type="image/svg+xml" href="/vite.svg" /> <meta name="viewport" content="width=device-width, initial-scale=1.0" /> <title>xxx</title> <script type="text/javascript" src="https://api.map.baidu.com/api?v=3.0&ak=你复制好的AK"></script></head>
在 head 里引入,是为了提前加载进来
3. 安装 echarts
npm i echarts -S
1. 增加ts对百度地图的支持
修改 .eslintrc.cjs,加入对百度地图的支持
module.exports = { // 其他省略 globals: { BMap: true }}
2. 全局注册 echarts
修改 main.ts
// 引入 echartsimport * as echarts from 'echarts'import themeJSON from '@/assets/weizwz.json'echarts.registerTheme('weizwz', themeJSON) const app = createApp(App)// 全局挂载 echartsapp.config.globalProperties.$echarts = echarts
3. 封装 echarts
src/components 下新建 chart 文件夹,并在其下新建 index.vue,封装如下
<script setup lang="ts">import { onMounted, getCurrentInstance, defineExpose, ref } from 'vue' defineOptions({ name: 'WChart'})// defineExpose 让父组件可调用此方法defineExpose({ setData}) // 组件传参const props = defineProps({ width: { type: String, //参数类型 default: '100%', //默认值 required: false //是否必须传递 }, height: { type: String, default: '10rem', required: true }, option: { type: Object, default: () => { return {} }, required: true }, // 初始化之前的工作,比如加载百度地图相关数据 initBefore: { type: Function, required: false }, // 初始化之后的工作,比如添加百度地址控件 initAfter: { type: Function, required: false }}) let chart: { setOption: (arg0: Record<string, any>) => void; resize: () => void }const wchart = ref(null) //声明周期函数,自动执行初始化onMounted(() => { init() // 监控窗口大小,自动适应界面 window.addEventListener('resize', resize, false)}) //初始化函数function init() { // 基于准备好的dom,初始化echarts实例 const dom = wchart.value // 通过 internalInstance.appContext.config.globalProperties 获取全局属性或方法 let internalInstance = getCurrentInstance() let echarts = internalInstance?.appContext.config.globalProperties.$echarts chart = echarts.init(dom, 'weizwz') // 渲染图表 if (props.initBefore) { props.initBefore(chart).then((data: Record<string, any>) => { setData(data) if (props.initAfter) props.initAfter(chart) }) } else { chart.setOption(props.option) if (props.initAfter) props.initAfter(chart) }} function resize() { chart.resize()}// 父组件可调用,设置动态数据function setData(option: Record<string, any>) { chart.setOption(option)}</script> <template> <div ref="wchart" :style="`width: ${props.width} ; height: ${props.height}`" /></template> <style lang="scss" scoped></style>
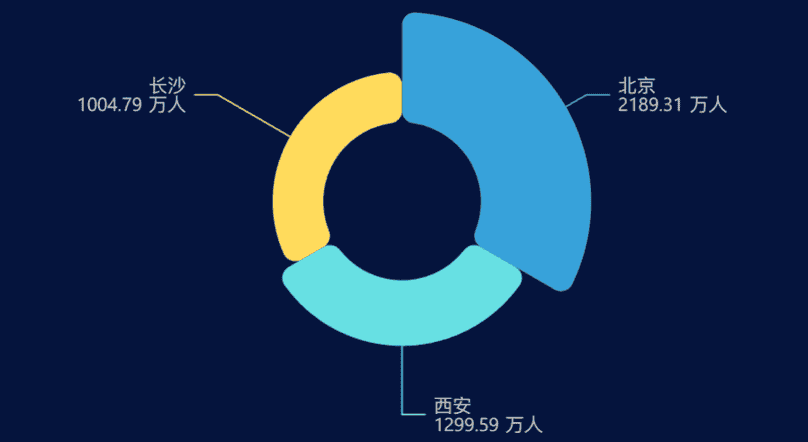
1. 使用 echarts 普通图表
示例:使用玫瑰环形图
<script setup lang="ts">import WChart from '@comp/chart/index.vue' defineOptions({ name: 'ChartLoop'})// 正常 echarts 参数const option = { grid: { top: '20', left: '10', right: '10', bottom: '20', containLabel: true }, series: [ { name: '人口统计', type: 'pie', radius: [50, 120], center: ['50%', '50%'], roseType: 'area', itemStyle: { borderRadius: 8 }, label: { formatter: '{b}\n{c} 万人' }, data: [ { value: 2189.31, name: '北京' }, { value: 1299.59, name: '西安' }, { value: 1004.79, name: '长沙' } ] } ]}</script> <template> <WChart width="100%" height="300px" :option="option" /></template> <style lang="scss" scoped></style>
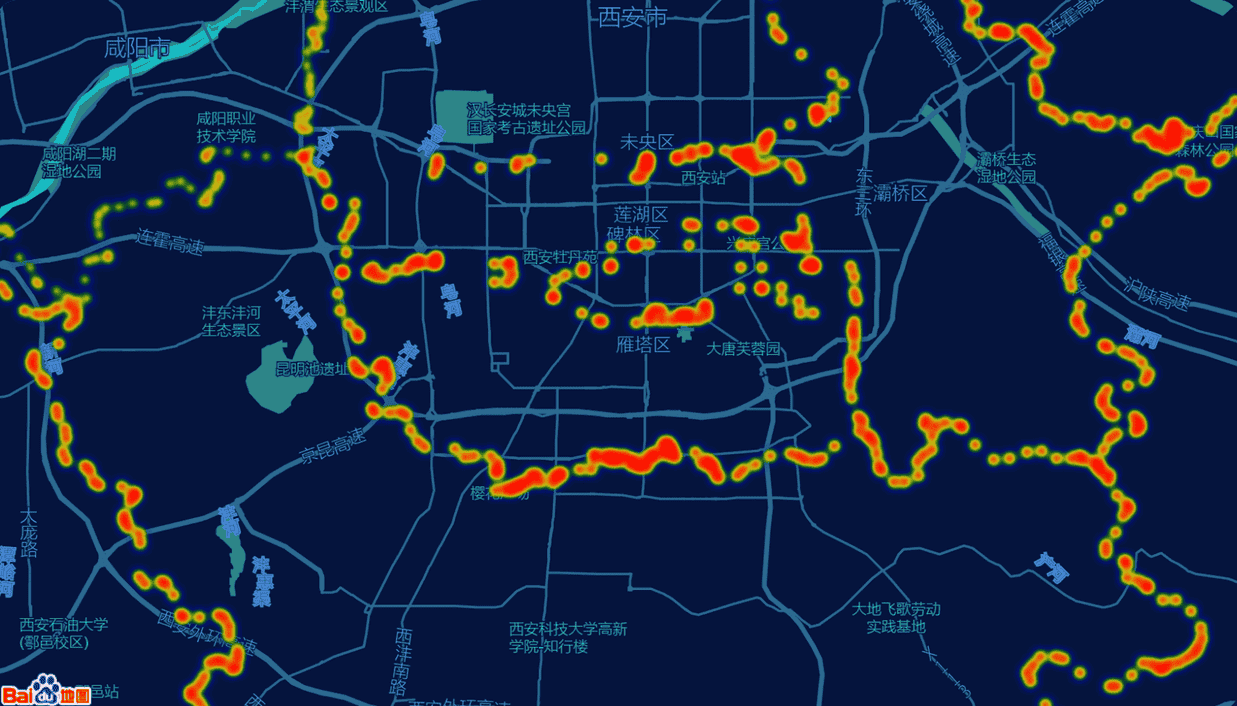
2. 结合百度地图
示例:西安热力图
<script setup lang="ts">import { reactive } from 'vue'import WChart from '@comp/chart/index.vue'// 注意需要引入 bmap,即 echarts 对百度地图的支持扩展import 'echarts/extension/bmap/bmap'// 热力数据,内容如:{ features: [ { geometry: { coordinates: [ [ [x, y] ] ] } } ]}// 为什么这么复杂,因为是我从阿里地理数据下载的,地址 https://datav.aliyun.com/portal/school/atlas/area_selectorimport xianJson from '@/assets/xian.json' defineOptions({ name: 'ChartMap'}) const option = { animation: false, backgroundColor: 'transparent', bmap: { // 地图中心点 center: [108.93957150268, 34.21690396762], zoom: 12, roam: true }, visualMap: { show: false, top: 'top', min: 0, max: 5, seriesIndex: 0, calculable: true, inRange: { color: ['blue', 'blue', 'green', 'yellow', 'red'] } }, series: [ { type: 'heatmap', coordinateSystem: 'bmap', data: reactive([] as any[]), pointSize: 5, blurSize: 6 } ]} const initBefore = () => { return new Promise((resolve) => { // 处理数据 const arr = [] for (const item of xianJson.features) { const positions = item.geometry.coordinates[0][0] for (const temp of positions) { const position = temp.concat(Math.random() * 1000 + 200) arr.push(position) } } option.series[0].data = arr resolve(option) })} const initAfter = (chart: { getModel: () => { (): any new (): any getComponent: { (arg0: string): { (): any; new (): any; getBMap: { (): any; new (): any } }; new (): any } }}) => { // 添加百度地图插件 var bmap = chart.getModel().getComponent('bmap').getBMap() // 百度地图样式,需要自己去创建 bmap.setMapStyleV2({ styleId: 'bc05830a75e51be40a38ffc9220613bb' }) // bmap.addControl(new BMap.MapTypeControl())}</script> <template> <WChart width="100%" height="500px" :option="option" :initBefore="initBefore" :initAfter="initAfter" /></template> <style lang="scss" scoped></style>
Recommend
About Joyk
Aggregate valuable and interesting links.
Joyk means Joy of geeK