

记一次 Redis 延时毛刺问题定位
source link: https://www.cyningsun.com/12-22-2023/redis-latency-spike.html
Go to the source link to view the article. You can view the picture content, updated content and better typesetting reading experience. If the link is broken, please click the button below to view the snapshot at that time.

记一次 Redis 延时毛刺问题定位
该问题发生于八月份,业务发现部分线上集群出现 10 分钟一次的耗时毛刺。整个系统的架构很简单:
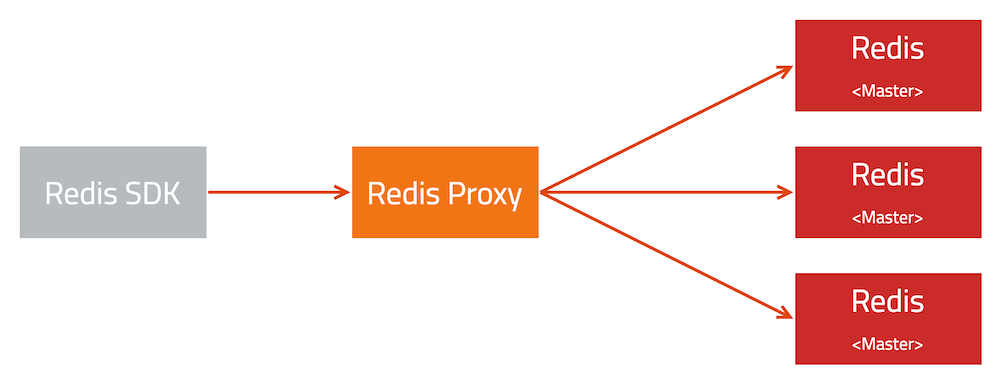
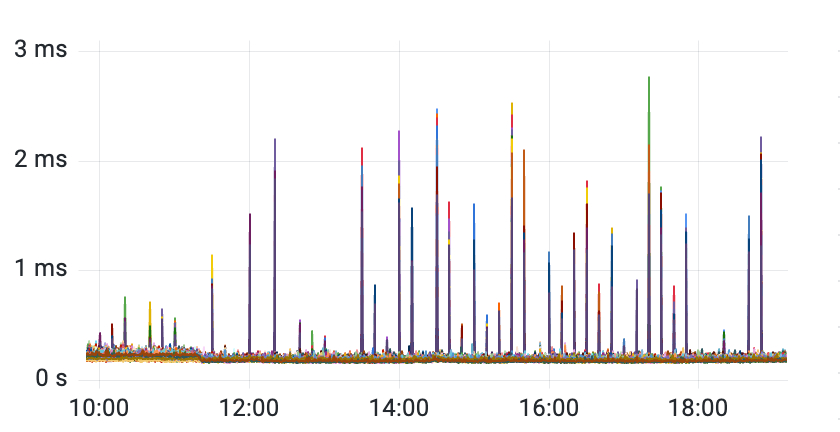
在 Redis Proxy 可以观察到明显的请求耗时毛刺,因此可以确定问题确实出现在 Redis Proxy 调用 Redis 的某个环节
然而,为了定位该问题,仍然花费了很长的时间:
- 该问题非必现,且不固定于某台机器
- 问题发现时,相同/类似毛刺现象涉及众多集群
- 在线的 Redis 版本缺少 P99 指标(耗时指标仅包括执行耗时,不包括包括等待耗时)耗时毛刺被平均之后无法观察到
由于无法利用现有指标缩小问题的范围,只能按照可能性从高到底排查:业务请求 > 网络 > 系统 > 应用。
- 业务层面:部分集群发现少量 LUA script 相关的慢速日志
- 网络层面:使用 mtr 观测出现问题的时间点网络状态,并排查上层交换机之后未见异常
- 系统层面:根据业务反馈之前有类似故障出现,原因是 atop 采集进程 PSS 导致延迟增加。该 case 可以稳定复现,现象略有不同;抽查有异常机器检查未发现有安装 atop。
- 应用层:相关集群已经较长时间没有版本更新,使用 perf record 很难发现毛刺类型问题
在针对某一个集群的 master failover 到其他节点,请求延迟毛刺消失。对比前后两台机器发现 atop 进程的差异。
$> ps aux|grep atop
root       2442  0.0  0.0   2500  1628 ?        S<    2022  42:21 /usr/sbin/atopacctd
root      11530  0.0  0.0  18024  2068 pts/0    S+   22:08   0:00 grep --color=auto atop
root     182181  1.5  0.0  33784 33184 ?        S<Ls 00:00  20:51 /usr/bin/atop -R -w /var/log/atop/atop_20230807 600

$> ps aux|grep atop
root     403334  0.0  0.0  16572  2016 pts/0    S+   22:09   0:00 grep --color=auto atop
停止所有 atop 之后,请求延迟消失
原来,线上部分机器部署的 atop 版本 默认启用了 -R 选项。在 atop 读 /proc/${pid}/smaps 时,会遍历整个进程的页表,期间会持有内存页表的锁。如果在此期间进程发生 page fault,也需要获取锁,就需要等待锁释放。具体到应用层面就是请求耗时毛刺。
除了 atop,cadvisor 等应用也会读取 /proc/${pid}/smaps,虽然默认关闭。由于关闭的方式是通过 disable_metrics 来指定关闭。如果自定义参数时遗漏相关参数,还是会打开该功能触发耗时毛刺
当读取 /proc/${pid}/smaps 获得某个进程虚拟内存区间信息时,究竟发生了什么?
seq_file
Linux 使用文件将内核里面数据结构通过文件导出到用户空间, smaps 使用到的文件类型就是 seq_file 文件。
// linux/include/linux/seq_file.h
struct seq_file {
char *buf; // 指向包含要读取或写入的数据的缓冲区
size_t size; // 缓冲区的大小
size_t from; // 缓冲区中读取或写入的起始位置
size_t count; // 读取或写入的字节数
size_t pad_until; // 将输出填充到某个位置
loff_t index; // 序列中的当前位置
loff_t read_pos; // 当前的读取位置
u64 version; // 文件版本
struct mutex lock; // 锁,确保对 seq_file 操作是线程安全的
const struct seq_operations *op; // 该结构定义了可以对 proc 执行的操作
int poll_event; // 用于 poll 和 select 系统调用
const struct file *file; // 指向文件结构的指针,即 seq_file 关联的 proc
void *private; // 私有数据字段,存储特定于文件的数据
};
struct seq_operations {
// 开始读数据项,通常需要加锁,以防止并行访问数据
void * (*start) (struct seq_file *m, loff_t *pos);
// 停止读数据项,通常需要解锁
void (*stop) (struct seq_file *m, void *v);
// 找到下一个要处理的数据项
void * (*next) (struct seq_file *m, void *v, loff_t *pos);
// 打印数据项到临时缓冲区
int (*show) (struct seq_file *m, void *v);
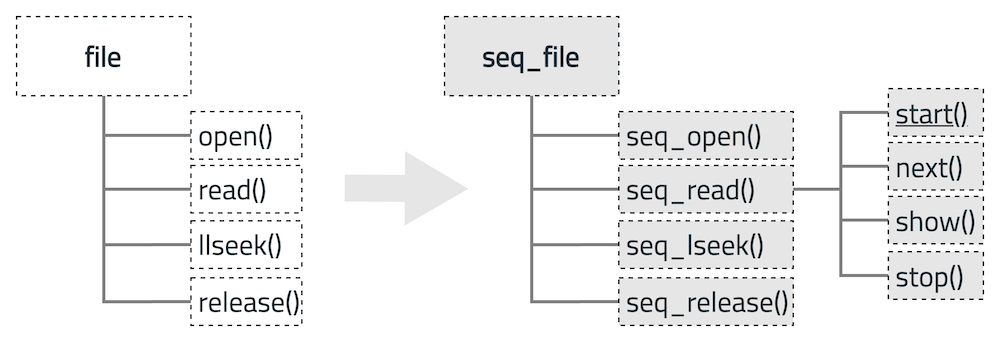
};seq_file 使用 file 存储需要关联的进程,seq_operations 定义读取进程数据的操作。使用全局函数 seq_open 把进程与 seq_operations 关联起来
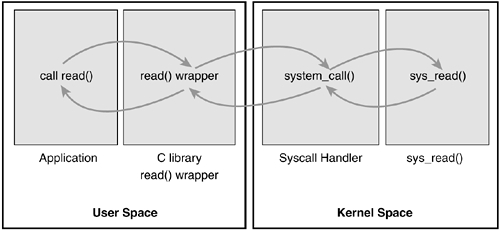
用户态: open(“/proc/pid/smaps”) –> 内核态: proc_pid_smaps_operations.open()
用户态: read(fd) –> 内核态: proc_pid_smaps_operations.read()
smaps
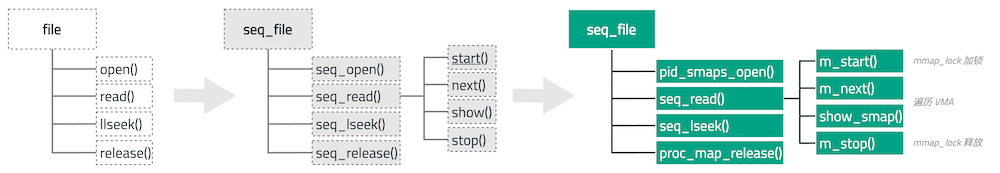
具体到 smaps,也是一样的实现 file 相关的方法,在内核中是定义在 proc_pid_smaps_operations 结构:
// linux/fs/proc/base.c

REG("smaps",      S_IRUGO, proc_pid_smaps_operations)


// linux/fs/proc/task_mmu.c
// `file_operations` 结构的一个实例,定义 `/proc/PID/smaps` 文件的操作,当操作`/proc/PID/smaps` 文件时被调用
const struct file_operations proc_pid_smaps_operations = {
	.open		= pid_smaps_open, // 打开文件的函数
	.read		= seq_read,       // 读取文件的函数
	.llseek		= seq_lseek,      // 定位文件的函数
	.release	= proc_map_release, // 释放文件的函数
};
其中 open() 函数最终会返回一个文件描述符 fd 供后续 read(fd) 函数使用。
// linux/fs/proc/task_mmu.c    pid_smaps_open()
//     --->linux/fs/proc/task_mmu.c    do_maps_open()
//         --->linux/fs/proc/task_mmu.c    proc_maps_open()

// `seq_operations`结构的实例,定义了一系列的操作函数,在处理`/proc/PID/smaps`文件时被调用
static const struct seq_operations proc_pid_smaps_op = {
	.start	= m_start,  // 开始操作的函数
	.next	= m_next,   // 下一步操作的函数
	.stop	= m_stop,   // 停止操作的函数
	.show	= show_smap // 显示操作的函数
};

static int pid_smaps_open(struct inode *inode, struct file *file)
{
	return do_maps_open(inode, file, &proc_pid_smaps_op);
}

static int do_maps_open(struct inode *inode, struct file *file,
			const struct seq_operations *ops)
{
	return proc_maps_open(inode, file, ops,
				sizeof(struct proc_maps_private));
}

static int proc_maps_open(struct inode *inode, struct file *file,
			const struct seq_operations *ops, int psize)
{
    // 调用`__seq_open_private`函数来打开一个序列文件,并返回一个指向`proc_maps_private`结构的指针。该结构包含了处理`/proc/PID/maps`文件所需的私有数据
	struct proc_maps_private *priv = __seq_open_private(file, ops, psize);

	if (!priv)
		return -ENOMEM;

	priv->inode = inode; // 将输入参数`inode`赋值给`priv->inode`

	// 调用`proc_mem_open`函数以读取模式打开`inode`指向的内存对象,并将返回的内存描述符赋值给`priv->mm`
	priv->mm = proc_mem_open(inode, PTRACE_MODE_READ);
	if (IS_ERR(priv->mm)) {
		int err = PTR_ERR(priv->mm);

		seq_release_private(inode, file);
		return err;
	}

	return 0;
}

// 打开序列文件并分配私有数据所需的基本操作
void *__seq_open_private(struct file *f, const struct seq_operations *ops,
		int psize)
{
	int rc;
	void *private;
	struct seq_file *seq;

	private = kzalloc(psize, GFP_KERNEL);
	if (private == NULL)
		goto out;

	rc = seq_open(f, ops); // 调用`seq_open`函数打开一个序列文件
	if (rc < 0)
		goto out_free;、

	seq = f->private_data; // 获取文件的私有数据,并将其转换为`seq_file`结构的指针
	seq->private = private;
	return private;

out_free:
	kfree(private);
out:
	return NULL;
}

/**
 *	seq_open -	initialize sequential file
 *	@file: file we initialize
 *	@op: method table describing the sequence
 *
 *	seq_open() sets @file, associating it with a sequence described
 *	by @op.  @op->start() sets the iterator up and returns the first
 *	element of sequence. @op->stop() shuts it down.  @op->next()
 *	returns the next element of sequence.  @op->show() prints element
 *	into the buffer.  In case of error ->start() and ->next() return
 *	ERR_PTR(error).  In the end of sequence they return %NULL. ->show()
 *	returns 0 in case of success and negative number in case of error.
 *	Returning SEQ_SKIP means "discard this element and move on".
 */
int seq_open(struct file *file, const struct seq_operations *op)
{
	struct seq_file *p = file->private_data;

	if (!p) {
		p = kmalloc(sizeof(*p), GFP_KERNEL);
		if (!p)
			return -ENOMEM;
		file->private_data = p;
	}
	memset(p, 0, sizeof(*p));
	mutex_init(&p->lock); // 初始化`seq_file`结构的锁
	p->op = op; // 将输入参数`op`赋值给`seq_file`结构的`op`成员

    // ...

	return 0;
}

struct mm_struct *proc_mem_open(struct inode *inode, unsigned int mode)
{
	// 调用`get_proc_task`函数获取`inode`对应的进程的任务结构
	struct task_struct *task = get_proc_task(inode);
	struct mm_struct *mm = ERR_PTR(-ESRCH);

    // ...

	return mm;
}
pid_smaps_open 函数通过参数 inode 找到进程相关的结构并放到 file 的私有数据结构。
当 read 时,调用 seq_read() 函数,它是内核的一个通用架构的函数,特定的 proc 文件(如:smaps)需要提供自己特有的操作方法供通用的 seq_read() 调用。smaps 即是 pid_smaps_open() 函数的 file_operations 参数 &proc_pid_smaps_op,专门为读取进程虚拟内存区(vma)信息的方法。
/**
 *	seq_read -	->read() method for sequential files.
 *	@file: the file to read from
 *	@buf: the buffer to read to
 *	@size: the maximum number of bytes to read
 *	@ppos: the current position in the file
 *
 *	Ready-made ->f_op->read()
 */
ssize_t seq_read(struct file *file, char __user *buf, size_t size, loff_t *ppos)
{
	struct seq_file *m = file->private_data;
	size_t copied = 0;
	loff_t pos;
	size_t n;
	void *p;
	int err = 0;

	mutex_lock(&m->lock); // 锁定`seq_file`结构,以确保线程安全

	/*
	 * seq_file->op->..m_start/m_stop/m_next may do special actions
	 * or optimisations based on the file->f_version, so we want to
	 * pass the file->f_version to those methods.
	 *
	 * seq_file->version is just copy of f_version, and seq_file
	 * methods can treat it simply as file version.
	 * It is copied in first and copied out after all operations.
	 * It is convenient to have it as  part of structure to avoid the
	 * need of passing another argument to all the seq_file methods.
	 */
	m->version = file->f_version;

	/* Don't assume *ppos is where we left it */
	if (unlikely(*ppos != m->read_pos)) {
		while ((err = traverse(m, *ppos)) == -EAGAIN)
			;
		if (err) {
			/* With prejudice... */
			m->read_pos = 0;
			m->version = 0;
			m->index = 0;
			m->count = 0;
			goto Done;
		} else {
			m->read_pos = *ppos;
		}
	}

	/* grab buffer if we didn't have one */
	// 如果`seq_file`结构没有缓冲区,需要分配一个
	if (!m->buf) {
		m->buf = seq_buf_alloc(m->size = PAGE_SIZE);
		if (!m->buf)
			goto Enomem;
	}
	/* if not empty - flush it first */
	// 如果`seq_file`结构的缓冲区不为空,需要先将其内容复制到用户空间
	if (m->count) {
		n = min(m->count, size);
		err = copy_to_user(buf, m->buf + m->from, n);
		if (err)
			goto Efault;
		m->count -= n;
		m->from += n;
		size -= n;
		buf += n;
		copied += n;
		if (!m->count)
			m->index++;
		if (!size)
			goto Done;
	}
	/* we need at least one record in buffer */
	pos = m->index;
	p = m->op->start(m, &pos);
	// 从序列文件中读取记录,直到出错或缓冲区满
	while (1) {
		err = PTR_ERR(p);
		if (!p || IS_ERR(p))
			break;
		err = m->op->show(m, p);
		if (err < 0)
			break;
		if (unlikely(err))
			m->count = 0;
		if (unlikely(!m->count)) {
			p = m->op->next(m, p, &pos);
			m->index = pos;
			continue;
		}
		if (m->count < m->size)
			goto Fill;
		m->op->stop(m, p);
		kvfree(m->buf);
		m->count = 0;
		m->buf = seq_buf_alloc(m->size <<= 1);
		if (!m->buf)
			goto Enomem;
		m->version = 0;
		pos = m->index;
		p = m->op->start(m, &pos);
	}
	m->op->stop(m, p);
	m->count = 0;
	goto Done;
Fill:
	/* they want more? let's try to get some more */
	// 尝试获取更多的记录,直到出错、缓冲区溢出或缓冲区满
	while (m->count < size) {
		size_t offs = m->count;
		loff_t next = pos;
		p = m->op->next(m, p, &next);
		if (!p || IS_ERR(p)) {
			err = PTR_ERR(p);
			break;
		}
		err = m->op->show(m, p);
		if (seq_has_overflowed(m) || err) {
			m->count = offs;
			if (likely(err <= 0))
				break;
		}
		pos = next;
	}
	m->op->stop(m, p);
	n = min(m->count, size);
	err = copy_to_user(buf, m->buf, n);
	if (err)
		goto Efault;
	copied += n;
	m->count -= n;
	if (m->count)
		m->from = n;
	else
		pos++;
	m->index = pos;
Done:
	if (!copied)
		copied = err;
	else {
		*ppos += copied;
		m->read_pos += copied;
	}
	file->f_version = m->version;
	mutex_unlock(&m->lock); // 解锁`seq_file`结构
	return copied;
Enomem:
	err = -ENOMEM;
	goto Done;
Efault:
	err = -EFAULT;
	goto Done;
}
seq_read() 函数的参数:文件对应的内核数据结构 file,用户态 buf 用于存放读取到的信息,size 和ppos 分别是大小和偏移。通用的 seq_read() 函数要将进程的 vma 信息读取给用户的 buf
在开始读取时,m_start 会调用 mmap_read_lock_killable 给整个 mm 结构体加锁;在读取结束时, m_stop 会调用 mmap_read_unlock 解锁。通过 m_next 和 show_smap 每次读取一个 VMA,最终完成所有所有区域的打印。
// linux/fs/proc/task_mmu.c

static void *m_start(struct seq_file *m, loff_t *ppos)
{
	// 获取`seq_file`结构的私有数据,并将其转换为`proc_maps_private`结构的指针
	struct proc_maps_private *priv = m->private;
	unsigned long last_addr = *ppos;
	struct mm_struct *mm;

	/* See m_next(). Zero at the start or after lseek. */
	if (last_addr == -1UL)
		return NULL;

	// 调用`get_proc_task`函数来获取`inode`对应的进程的任务结构
	priv->task = get_proc_task(priv->inode);
	if (!priv->task)
		return ERR_PTR(-ESRCH);

	mm = priv->mm;
	if (!mm || !mmget_not_zero(mm)) {
		put_task_struct(priv->task);
		priv->task = NULL;
		return NULL;
	}

	// 尝试获取内存描述符的读锁。如果无法获取,函数释放内存描述符和任务结构并返回错误指针
	if (mmap_read_lock_killable(mm)) {
		mmput(mm);
		put_task_struct(priv->task);
		priv->task = NULL;
		return ERR_PTR(-EINTR);
	}

	// 初始化虚拟内存区域的迭代器
	vma_iter_init(&priv->iter, mm, last_addr);
	hold_task_mempolicy(priv); // 获取任务的内存策略
	if (last_addr == -2UL)
		return get_gate_vma(mm);

	// 获取虚拟内存区域
	return proc_get_vma(priv, ppos);
}

static void *m_next(struct seq_file *m, void *v, loff_t *ppos)
{
	if (*ppos == -2UL) {
		*ppos = -1UL;
		return NULL;
	}
	return proc_get_vma(m->private, ppos);
}

static void m_stop(struct seq_file *m, void *v)
{
	struct proc_maps_private *priv = m->private;
	struct mm_struct *mm = priv->mm;

	if (!priv->task)
		return;

	release_task_mempolicy(priv); // 释放任务的内存策略
	mmap_read_unlock(mm); // 解锁内存描述符的读锁
	mmput(mm); // 减少内存描述符的引用计数,如果引用计数为零,释放内存描述符
	put_task_struct(priv->task); // 减少任务结构的引用计数,如果引用计数为零,释放任务结构
	priv->task = NULL;
}


static int show_smap(struct seq_file *m, void *v)
{
	struct vm_area_struct *vma = v;
	struct mem_size_stats mss;

	memset(&mss, 0, sizeof(mss));

	smap_gather_stats(vma, &mss, 0);

	show_map_vma(m, vma);

	SEQ_PUT_DEC("Size:           ", vma->vm_end - vma->vm_start);
	SEQ_PUT_DEC(" kB\nKernelPageSize: ", vma_kernel_pagesize(vma));
	SEQ_PUT_DEC(" kB\nMMUPageSize:    ", vma_mmu_pagesize(vma));
	seq_puts(m, " kB\n");

	__show_smap(m, &mss, false);

	seq_printf(m, "THPeligible:    %8u\n",
		   hugepage_vma_check(vma, vma->vm_flags, true, false, true));

	if (arch_pkeys_enabled())
		seq_printf(m, "ProtectionKey:  %8u\n", vma_pkey(vma));
	show_smap_vma_flags(m, vma);

	return 0;
}

/* Show the contents common for smaps and smaps_rollup */
static void __show_smap(struct seq_file *m, const struct mem_size_stats *mss,
	bool rollup_mode)
{
	SEQ_PUT_DEC("Rss:            ", mss->resident);
	SEQ_PUT_DEC(" kB\nPss:            ", mss->pss >> PSS_SHIFT);
	SEQ_PUT_DEC(" kB\nPss_Dirty:      ", mss->pss_dirty >> PSS_SHIFT);
	if (rollup_mode) {
		/*
		 * These are meaningful only for smaps_rollup, otherwise two of
		 * them are zero, and the other one is the same as Pss.
		 */
		SEQ_PUT_DEC(" kB\nPss_Anon:       ",
			mss->pss_anon >> PSS_SHIFT);
		SEQ_PUT_DEC(" kB\nPss_File:       ",
			mss->pss_file >> PSS_SHIFT);
		SEQ_PUT_DEC(" kB\nPss_Shmem:      ",
			mss->pss_shmem >> PSS_SHIFT);
	}
	SEQ_PUT_DEC(" kB\nShared_Clean:   ", mss->shared_clean);
	SEQ_PUT_DEC(" kB\nShared_Dirty:   ", mss->shared_dirty);
	SEQ_PUT_DEC(" kB\nPrivate_Clean:  ", mss->private_clean);
	SEQ_PUT_DEC(" kB\nPrivate_Dirty:  ", mss->private_dirty);
	SEQ_PUT_DEC(" kB\nReferenced:     ", mss->referenced);
	SEQ_PUT_DEC(" kB\nAnonymous:      ", mss->anonymous);
	SEQ_PUT_DEC(" kB\nKSM:            ", mss->ksm);
	SEQ_PUT_DEC(" kB\nLazyFree:       ", mss->lazyfree);
	SEQ_PUT_DEC(" kB\nAnonHugePages:  ", mss->anonymous_thp);
	SEQ_PUT_DEC(" kB\nShmemPmdMapped: ", mss->shmem_thp);
	SEQ_PUT_DEC(" kB\nFilePmdMapped:  ", mss->file_thp);
	SEQ_PUT_DEC(" kB\nShared_Hugetlb: ", mss->shared_hugetlb);
	seq_put_decimal_ull_width(m, " kB\nPrivate_Hugetlb: ",
				  mss->private_hugetlb >> 10, 7);
	SEQ_PUT_DEC(" kB\nSwap:           ", mss->swap);
	SEQ_PUT_DEC(" kB\nSwapPss:        ",
					mss->swap_pss >> PSS_SHIFT);
	SEQ_PUT_DEC(" kB\nLocked:         ",
					mss->pss_locked >> PSS_SHIFT);
	seq_puts(m, " kB\n");
}

static struct vm_area_struct *proc_get_vma(struct proc_maps_private *priv,
						loff_t *ppos)
{
	struct vm_area_struct *vma = vma_next(&priv->iter);

	if (vma) {
		*ppos = vma->vm_start;
	} else {
		*ppos = -2UL;
		vma = get_gate_vma(priv->mm);
	}

	return vma;
}


// linux/include/linux/mmap_lock.h
static inline int mmap_read_lock_killable(struct mm_struct *mm)
{
	int ret;

	__mmap_lock_trace_start_locking(mm, false);
	ret = down_read_killable(&mm->mmap_lock);
	__mmap_lock_trace_acquire_returned(mm, false, ret == 0);
	return ret;
}

static inline void mmap_read_unlock(struct mm_struct *mm)
{
	__mmap_lock_trace_released(mm, false);
	up_read(&mm->mmap_lock);
}
smaps 读取的重点在于:
- mmap_lock 锁粒度: 该锁的粒度很大,当进程发生 vma 操作都需要持有该锁,如内存分配和释放。
- 遍历 VMA 耗时:如果进程的内存比较大,就会长时间持有该锁,影响进程的内存管理。
smaps_rollup
有时只是想获取一下进程的 PSS 占用,是不是可以省去遍历 VMA 的部分呢? google 的优化是增加 /proc/pid/smaps_rollup,据 Patch 描述性能改善了 12 倍,节省几百毫秒。
By using smaps_rollup instead of smaps, a caller can avoid the
significant overhead of formatting, reading, and parsing each of a
large process’s potentially very numerous memory mappings. For
sampling system_server’s PSS in Android, we measured a 12x speedup,
representing a savings of several hundred milliseconds.
smaps_rollup 的具体实现如下,可以看到持锁的粒度和时长都大大降低,当有写入请求等待锁时,还会临时释放锁。
static int show_smaps_rollup(struct seq_file *m, void *v)
{
	// 获取`seq_file`结构的私有数据,并将其转换为`proc_maps_private`结构的指针
	struct proc_maps_private *priv = m->private;
	struct mem_size_stats mss = {};
	struct mm_struct *mm = priv->mm;
	struct vm_area_struct *vma;
	unsigned long vma_start = 0, last_vma_end = 0;
	int ret = 0;
	VMA_ITERATOR(vmi, mm, 0);
	// 调用`get_proc_task`函数来获取`inode`对应的进程的任务结构
	priv->task = get_proc_task(priv->inode);
	if (!priv->task)
		return -ESRCH;
	if (!mm || !mmget_not_zero(mm)) {
		ret = -ESRCH;
		goto out_put_task;
	}
	// 尝试获取内存描述符的读锁。如果无法获取,函数返回错误码
	ret = mmap_read_lock_killable(mm);
	if (ret)
		goto out_put_mm;
	hold_task_mempolicy(priv); // 获取任务的内存策略
	vma = vma_next(&vmi); // 获取下一个虚拟内存区域
	if (unlikely(!vma))
		goto empty_set;
	vma_start = vma->vm_start;
	// 遍历所有的虚拟内存区域,并收集统计信息
	do {
		// 调用`smap_gather_stats`函数来收集当前VMA的统计信息
		smap_gather_stats(vma, &mss, 0);
		last_vma_end = vma->vm_end;
		/*
		 * Release mmap_lock temporarily if someone wants to
		 * access it for write request.
		 */
		 // 如果内存映射的锁存在争用,需要暂时释放锁以允许其他线程进行写操作
		if (mmap_lock_is_contended(mm)) {
			vma_iter_invalidate(&vmi);
			mmap_read_unlock(mm);
			ret = mmap_read_lock_killable(mm);
			if (ret) {
				release_task_mempolicy(priv);
				goto out_put_mm;
			}
			/*
			 * After dropping the lock, there are four cases to
			 * consider. See the following example for explanation.
			 *
			 *   +------+------+-----------+
			 *   | VMA1 | VMA2 | VMA3      |
			 *   +------+------+-----------+
			 *   |      |      |           |
			 *  4k     8k     16k         400k
			 *
			 * Suppose we drop the lock after reading VMA2 due to
			 * contention, then we get:
			 *
			 *	last_vma_end = 16k
			 *
			 * 1) VMA2 is freed, but VMA3 exists:
			 *
			 *    vma_next(vmi) will return VMA3.
			 *    In this case, just continue from VMA3.
			 *
			 * 2) VMA2 still exists:
			 *
			 *    vma_next(vmi) will return VMA3.
			 *    In this case, just continue from VMA3.
			 *
			 * 3) No more VMAs can be found:
			 *
			 *    vma_next(vmi) will return NULL.
			 *    No more things to do, just break.
			 *
			 * 4) (last_vma_end - 1) is the middle of a vma (VMA'):
			 *
			 *    vma_next(vmi) will return VMA' whose range
			 *    contains last_vma_end.
			 *    Iterate VMA' from last_vma_end.
			 */
			vma = vma_next(&vmi); // 获取下一个VMA
			/* Case 3 above */
			if (!vma) // 如果没有更多的VMA,跳出循环
				break;
			/* Case 1 and 2 above */
			if (vma->vm_start >= last_vma_end) // 如果下一个 VMA 的开始地址大于或等于上一个 VMA 的结束地址,跳过当前迭代
				continue;
			/* Case 4 above */
			if (vma->vm_end > last_vma_end) // 如果下一个 VMA 的结束地址大于上一个 VMA 的结束地址,从上一个 VMA 的结束地址开始收集下一个 VMA 的统计信息
				smap_gather_stats(vma, &mss, last_vma_end);
		}
	} for_each_vma(vmi, vma);
empty_set:
	// 显示虚拟内存区域的头部前缀
	show_vma_header_prefix(m, vma_start, last_vma_end, 0, 0, 0, 0);
	seq_pad(m, ' ');
	seq_puts(m, "[rollup]\n");
	// 显示内存映射的统计信息
	__show_smap(m, &mss, true);
	release_task_mempolicy(priv); // 释放任务的内存策略
	mmap_read_unlock(mm); // 解锁内存描述符的读锁
out_put_mm:
	// 减少内存描述符的引用计数,如果引用计数为零,释放内存描述符
	mmput(mm);
out_put_task:
	// 减少任务结构的引用计数,如果引用计数为零,释放任务结构
	put_task_struct(priv->task);
	priv->task = NULL;
	return ret;
}
定位策略/工具
正如前面提到,整个故障定位过程耗时较长,定位方式也不具备普适性。针对延迟毛刺性问题,是否有什么普适的定位方法呢?
首先,定位非必现的问题,首要条件就是获取问题发生的现场快照,获取更多的问题细节。针对非必现的问题最好的方式,就是在可能出现问题的现场部署合适的脚本获取现场快照。
其次,最重要的是定位工具。本问题之所以定位耗时较长,是因为没有使用合适的工具缩小故障的范围。就进程的调用耗时而言,由两部分耗时组成:用户空间和内核空间。
用户空间耗时
由于在线的 Redis 版本缺少 P99 指标,可以使用 funcslower(bcc) 可以定位或排除 Redis 执行毛刺,将范围缩小到网络或者单机问题。
$> funcslower -UK -u 5000 -p 324568 '/var/lib/docker/overlay2/69e6c3d262a1aed8db1a8b16ddfc34c7c78999f527e028857dc2e5248ae5704a/merged/usr/local/bin/redis-server:processCommand'内核空间耗时
使用系统调用性能测试工具,通过查看系统调用的长尾延迟,可以确定系统层面是否存在问题。满足要求的工具可能有:
syscount(bcc)
syscount 并不能直接查看 outliner,但可以通过对比不同时间区间的延迟变化发现问题。使用它在问题现场,抓取到延迟前后 mmap 系统调用前后变化,问题出现前耗时为 11 us,问题发生时耗时为 177 ms,如下所示:
# ebpf 抓取故障前后 mmap 耗时
$> syscount -L -i 30  -p $PID
[21:39:27]
SYSCALL                   COUNT        TIME (us)
epoll_pwait               24952      4322184.374
write                     34458       331600.262
read                      26400        59001.053
open                         50          527.602
epoll_ctl                    70           93.506
getpid                       50           39.793
close                        50           35.262
munmap                        1           26.372
getpeername                  12           15.252
mmap                          1           11.003

[21:40:14]
SYSCALL                   COUNT        TIME (us)
epoll_pwait               24371      4189948.513
write                     34110       296551.821
mmap                          1       177477.938
read                      25878        57099.880
open                         48          504.271
epoll_ctl                    68          104.834
getpid                       49           45.939
close                        49           37.919
getpeername                   8           13.127
accept                        2            7.896
perf trace
另外一个更好用的工具是 perf trace,相较于 syscount 提供了 histogram 图,可以直观的发现长尾问题,使用示例如下所示(非问题现场):
# perf trace 示例
$> perf trace -p $PID -s

   syscall            calls    total       min       avg       max      stddev
                               (msec)    (msec)    (msec)    (msec)        (%)
   --------------- -------- --------- --------- --------- ---------     ------
   epoll_pwait        53841 14561.545     0.000     0.270     4.538      0.53%
   write              56177   757.799     0.005     0.013     0.047      0.09%
   read               55591   219.250     0.001     0.004     0.702      0.67%
   open                 170     2.468     0.012     0.015     0.043      1.69%
   getpid               171     1.668     0.002     0.010     1.069     63.91%
   mmap                  76     0.795     0.007     0.010     0.018      2.14%
   munmap                77     0.643     0.003     0.008     0.030      7.91%
   epoll_ctl            151     0.533     0.001     0.004     0.014      4.26%
   close                173     0.291     0.001     0.002     0.012      3.87%
   getpeername           24     0.064     0.002     0.003     0.004      4.76%
   accept                 8     0.045     0.003     0.006     0.011     18.34%
   setsockopt            20     0.040     0.001     0.002     0.003      5.50%
   fcntl                 16     0.029     0.001     0.002     0.006     15.83%
   getrusage              3     0.008     0.001     0.003     0.006     48.77%
   getcwd                 1     0.006     0.006     0.006     0.006      0.00%
定位到 mmap 耗时异常之后,其实相关工作就可以交给内核同事处理了,毕竟术业有专攻。要想查看慢在哪里,可以通过 func_graph 工具定位到耗时异常的函数
# tracer: function_graph
#
# CPU  DURATION                  FUNCTION CALLS
# |     |   |                     |   |   |   |

 0)               |  sys_open() {
 0)               |    do_sys_open() {
 0)               |      getname() {
 0)               |        kmem_cache_alloc() {
 0)   1.382 us    |          __might_sleep();
 0)   2.478 us    |        }
 0)               |        strncpy_from_user() {
 0)               |          might_fault() {
 0)   1.389 us    |            __might_sleep();
 0)   2.553 us    |          }
 0)   3.807 us    |        }
 0)   7.876 us    |      }
 0)               |      alloc_fd() {
 0)   0.668 us    |        _spin_lock();
 0)   0.570 us    |        expand_files();
 0)   0.586 us    |        _spin_unlock();
针对于 mmap_lock 的锁占用,要想排查持有该锁的进程列表。在内核高版本中封装了 mmap_lock 相关函数,并在其中增加了 tracepoint,可以使用 bpftrace 等工具统计持有写锁的进程、调用栈等
$> perf list |grep mmap
  mmap:vm_unmapped_area                              [Tracepoint event]
  mmap_lock:mmap_lock_acquire_returned               [Tracepoint event]
  mmap_lock:mmap_lock_released                       [Tracepoint event]
  mmap_lock:mmap_lock_start_locking                  [Tracepoint event]
  syscalls:sys_enter_mmap                            [Tracepoint event]
  syscalls:sys_exit_mmap                             [Tracepoint event]

$> bpftrace -e 'tracepoint:mmap_lock:mmap_lock_start_locking /args->write == true/{ @[comm, kstack] = count();}'
相关 perf 命令来自 字节跳动SYSTech 分享,遗憾的是由于发生问题的内核版本较旧,并未实操相关该定位过程。
当然,从 持锁这个更宽泛的观测纬度来看,可以找出有相关动作的进程,如下所示:
$> trace 'rwsem_down_read_slowpath(struct rw_semaphore *sem, int state) "count=0x%lx owner=%s", sem->count.counter, ((struct task_struct *)((sem->owner.counter)&~0x7))->comm'
/virtual/main.c:44:66: warning: comparison of array '((struct task_struct *)((sem->owner.counter) & ~7))->comm' not equal to a null pointer is always true [-Wtautological-pointer-compare]
        if (((struct task_struct *)((sem->owner.counter)&~0x7))->comm != 0) {
            ~~~~~~~~~~~~~~~~~~~~~~~~~~~~~~~~~~~~~~~~~~~~~~~~~~~~~^~~~    ~
1 warning generated.
PID     TID     COMM            FUNC             -
195453  195458  monitor         rwsem_down_read_slowpath count=0x100 owner=
195453  195458  monitor         rwsem_down_read_slowpath count=0x101 owner=ip
195453  195756  monitor         rwsem_down_read_slowpath count=0x101 owner=sh
195453  195458  monitor         rwsem_down_read_slowpath count=0x101 owner=python
195453  195458  monitor         rwsem_down_read_slowpath count=0x101 owner=python
195453  195458  monitor         rwsem_down_read_slowpath count=0x101 owner=python
212360  212360  runc            rwsem_down_read_slowpath count=0x100 owner=
212360  212360  runc            rwsem_down_read_slowpath count=0x101 owner=runc
...
然而,加锁解锁耗时跟持锁耗时是两个完全不同的概念,因此并不能直接定位到持锁耗时较长的进程,所以仍需额外的工作进一步排查。
下次遇到同步调用场景下的延迟毛刺,就可以选择合适的工具根据函数执行耗时快速定位。然而采用 streaming 模式的异步请求/响应的延迟问题,仍然需要再深入学习探索。
本文作者 : cyningsun
本文地址 : https://www.cyningsun.com/12-22-2023/redis-latency-spike.html
版权声明 :本博客所有文章除特别声明外,均采用 CC BY-NC-ND 3.0 CN 许可协议。转载请注明出处!
Recommend
About Joyk
Aggregate valuable and interesting links.
Joyk means Joy of geeK