

克服网络障碍:Prometheus如何通过间接方式采集目标服务数据
source link: https://server.51cto.com/article/776523.html
Go to the source link to view the article. You can view the picture content, updated content and better typesetting reading experience. If the link is broken, please click the button below to view the snapshot at that time.

克服网络障碍:Prometheus如何通过间接方式采集目标服务数据
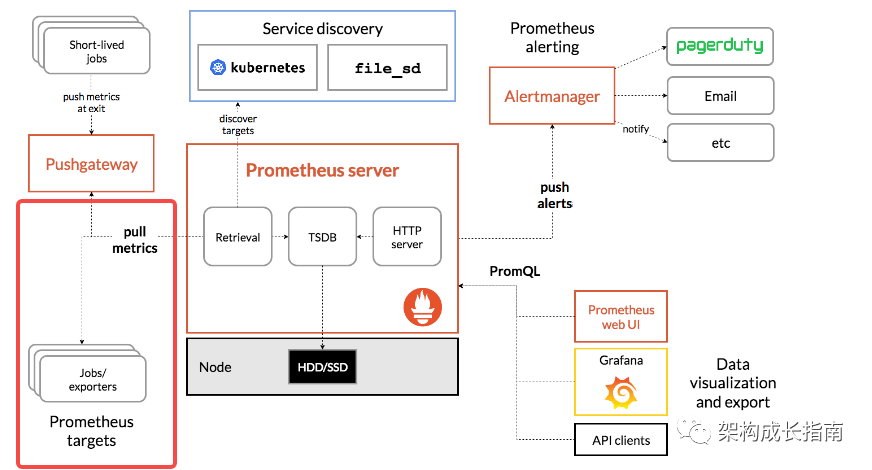
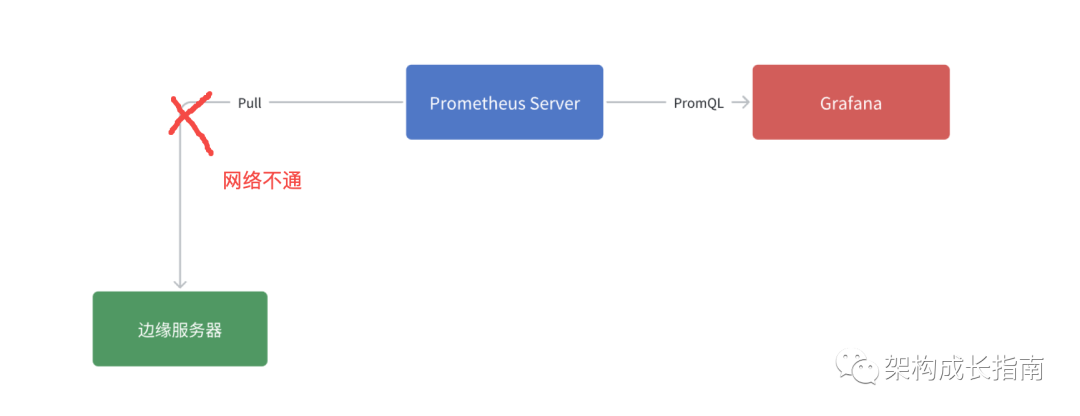
在上篇从零开始:使用Prometheus与Grafana搭建监控系统,我们了解了Prometheus采集数据主要是采用Pull模式,即主动拉取模式,这种方式虽然简单,但是有一定限制,比如服务器A部署在边缘端与Prometheus部署在云端,两者网络不通,因此不能采用Pull模式。
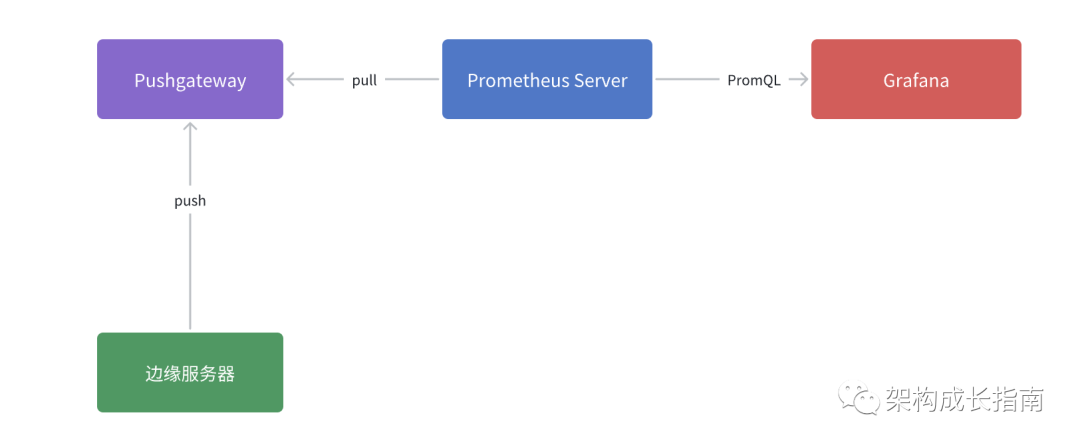
那么如何获取服务器 A 的指标?答案就是采用Pushgateway,这里Pushgateway充当了一个桥接的作用,把Pushgateway服务暴漏一个公网地址,然后服务器 A 与Prometheus都能连接即可。服务器 把数据 Push到Pushgateway,然后 Prometheus 去 Pushgateway 上定时 pull数据即可。
下面分享一下如何使用Pushgateway如何采集远程节点数据指标。
docker pull prom/pushgateway:v1.5.1docker run --name pushgateway -d -p 9091:9091 prom/pushgateway:v1.5.1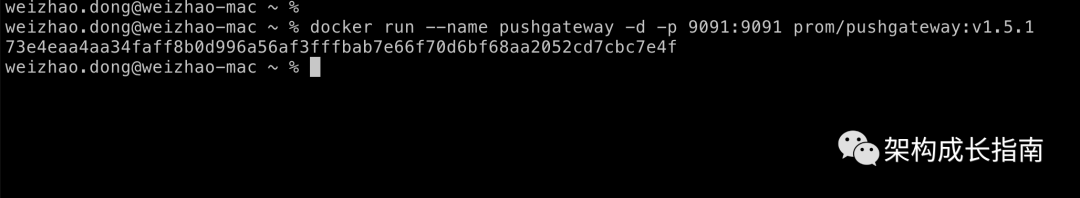
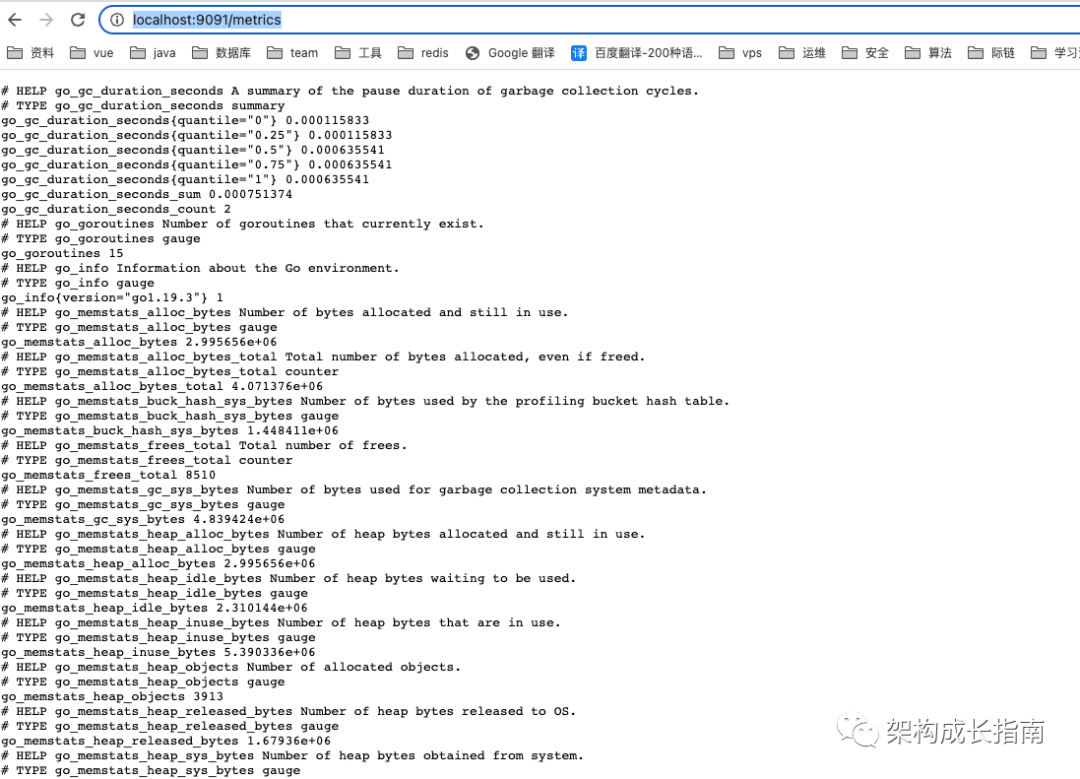
访问http://localhost:9091/metrics查看是否启动成功,可以看到Pushgateway自身也带了一些指标
边缘服务器配置下载node-exporter
wget https://github.com/prometheus/node_exporter/releases/download/v1.5.0/node_exporter-1.5.0.linux-arm64.tar.gz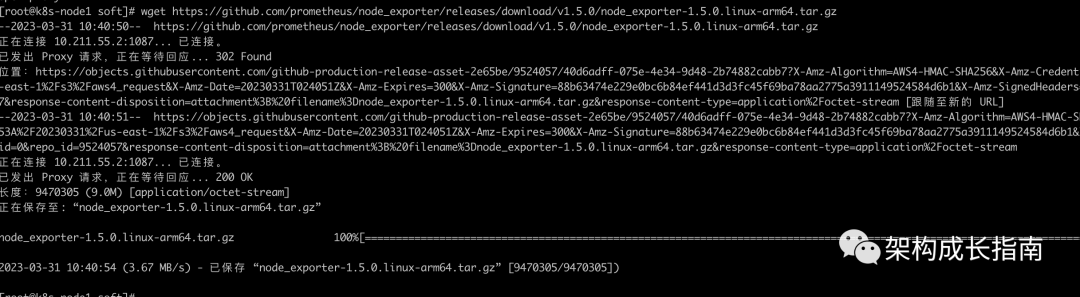
下载完成以后执行tar -xvf node_exporter-1.5.0.linux-arm64.tar.gz && cd node_exporter-1.5.0.linux-arm64进行解压
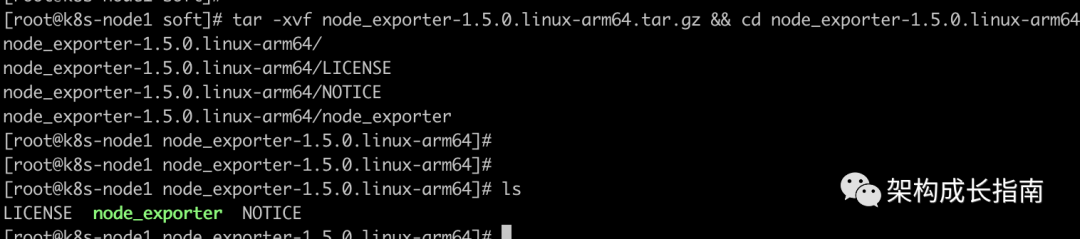
解压完成以后,执行./node_exporter进行简单验证,
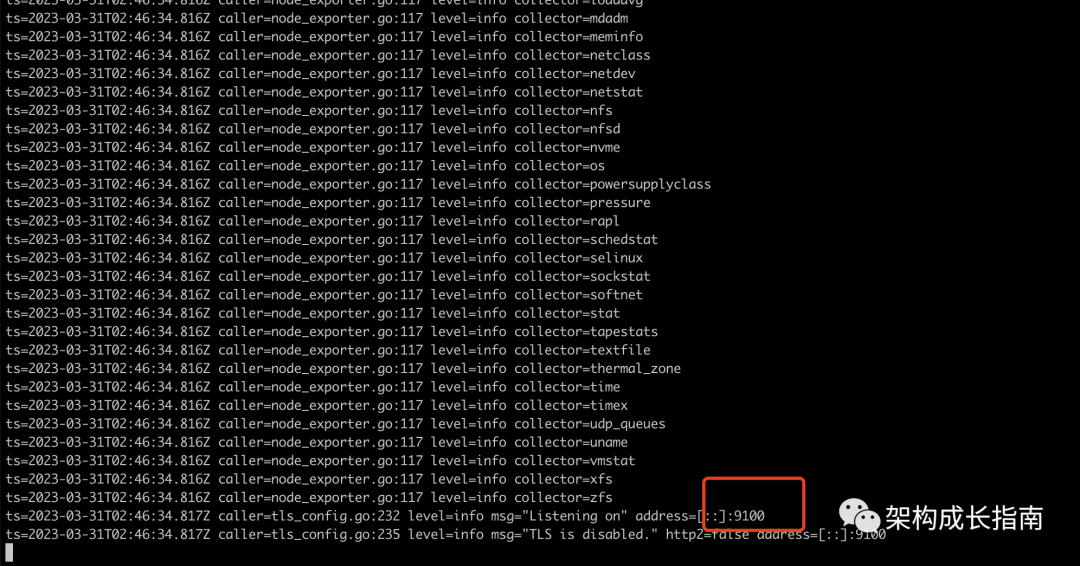
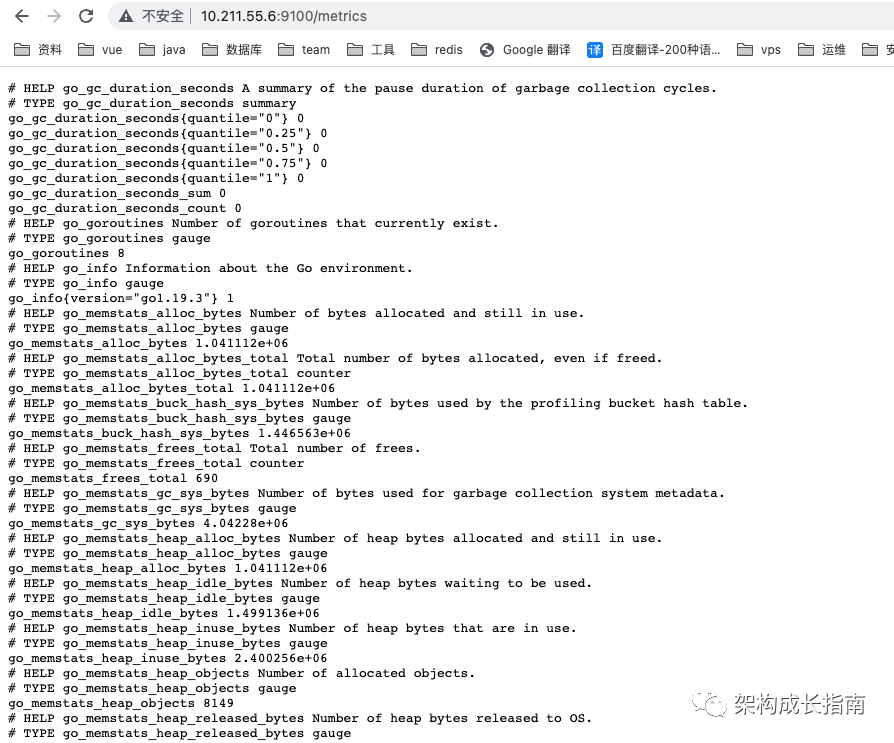
看到以上信息则启动成功,通过浏览器进行访问http://ip:9100/metrics,可以看到以下指标
安装node-exporter
由于直接启动node-exporter关闭窗口此进程就会挂掉,因此可以采用systemctl方式进行配置
执行mv node_exporter //usr/local/移动node_exporter文件
在/usr/lib/systemd/system/目录,创建node_exporter.service文件,内容如下,ExecStart指向的就是node_exporter执行文件
cat <<EOF > /usr/lib/systemd/system/node_exporter.service
[Unit]
Descriptinotallow=Node Exporter

[Service]
ExecStart=/usr/local/node_exporter
Restart=on-failure
[Install]
WantedBy=multi-user.target
EOF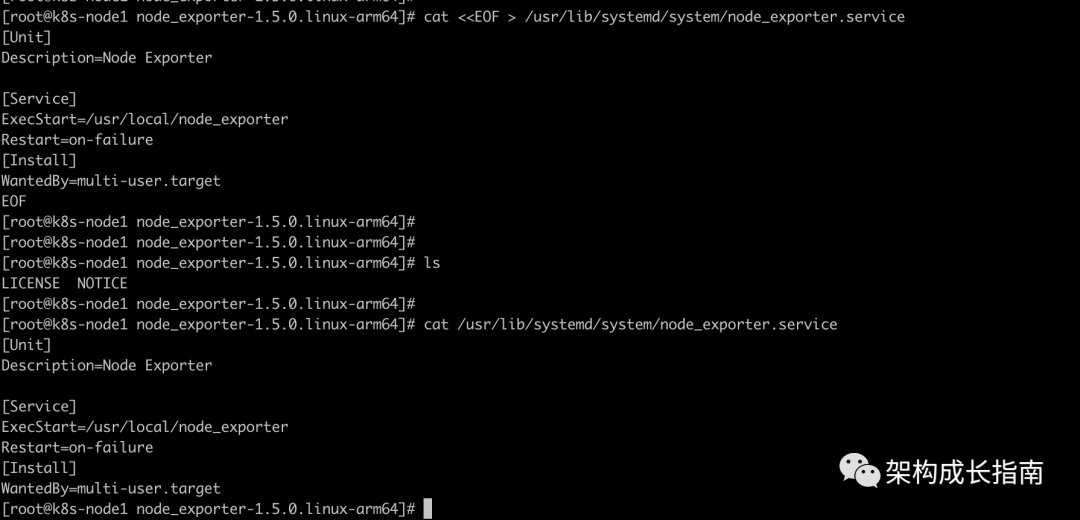
执行systemctl daemon-reload
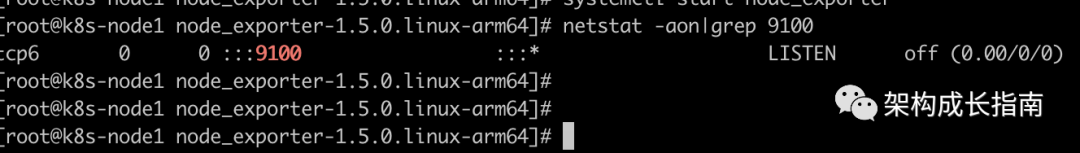
执行systemctl start node_exporter启动node_exporter
执行netstat -aon|grep 9100查看9100是否启动成功
边缘端指标上报
由于node-exporter只提供的数据,默认是由prometheus进行pull的方式来获取指标数据,而我们需要主动push数据到Pushgateway,所以这里需要增加shell脚本,先获取node-exporter数据,然后在调用Pushgateway接口进行push,以下为推送语句
PushgatewayIP: 10.211.55.2
边缘服务器IP:10.211.55.6
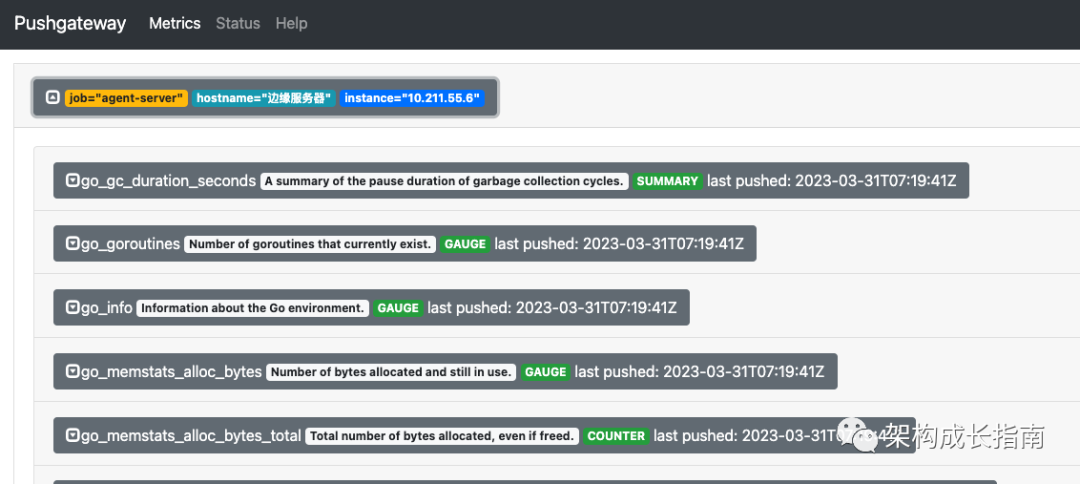
curl 10.211.55.6:9100/metrics|curl --data-binary @- http://10.211.55.2:9091/metrics/job/agent-server/instance/10.211.55.6/hostname/边缘服务器手动执行以下脚本,并访问Pushgateway查看是否有对应数据
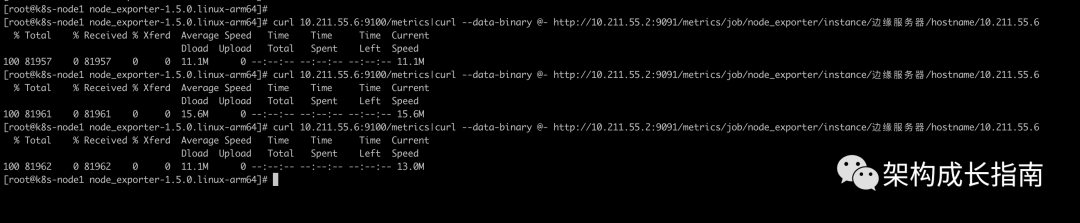
可以看到数据已上传
虽然以上脚本没问题,但是还需要定时执行才行,所以需要编写shell脚本,并通过crontab进行调用
创建shell脚本
cat <<EOF > /etc/cron.d/propushgateway.sh
#!/bin/bash
curl 10.211.55.6:9100/metrics|curl --data-binary @- http://10.211.55.2:9091/metrics/job/agent-server/instance/hostname/10.211.55.6
date>> /tmp/date.txt
EOF
分配文件执行权限
chmod 777 /etc/cron.d/propushgateway.sh配置crontab任务,10s执行一次,由于crontab只支持到分,所以采用采用以下方式配置
crontab -e
* * * * * /etc/cron.d/propushgateway.sh
* * * * * sleep 10; /etc/cron.d/propushgateway.sh
* * * * * sleep 20; /etc/cron.d/propushgateway.sh
* * * * * sleep 30; /etc/cron.d/propushgateway.sh
* * * * * sleep 40; /etc/cron.d/propushgateway.sh
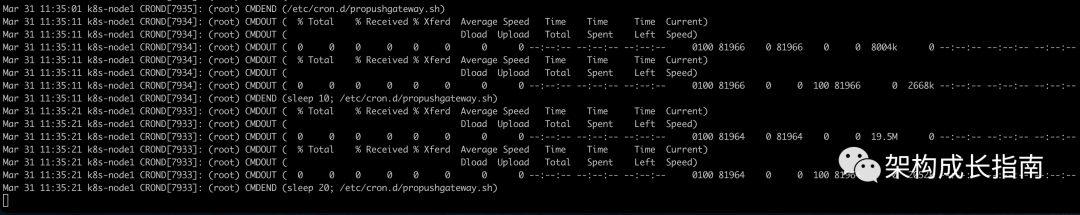
* * * * * sleep 50; /etc/cron.d/propushgateway.sh查看执行日志tail -f /var/log/cron可以看到10s执行一次
修改prometheus配置文件
在prometheus.yml文件中增加如下配置
- job_name: 'AgentServer'
# Override the global default and scrape targets from this job every 5 seconds.
honor_labels: false
static_configs:
- targets: ['10.211.55.2:9091']
labels:
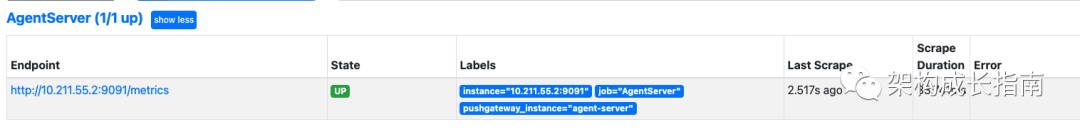
pushgateway_instance: agent-server ##这里必须加这边标签过滤,不然采集的是pushGateway数据增加完成以后重启prometheus
docker restart prometheus启动完成以后访问prometheus地址,查看Pushgateway的target已经生效
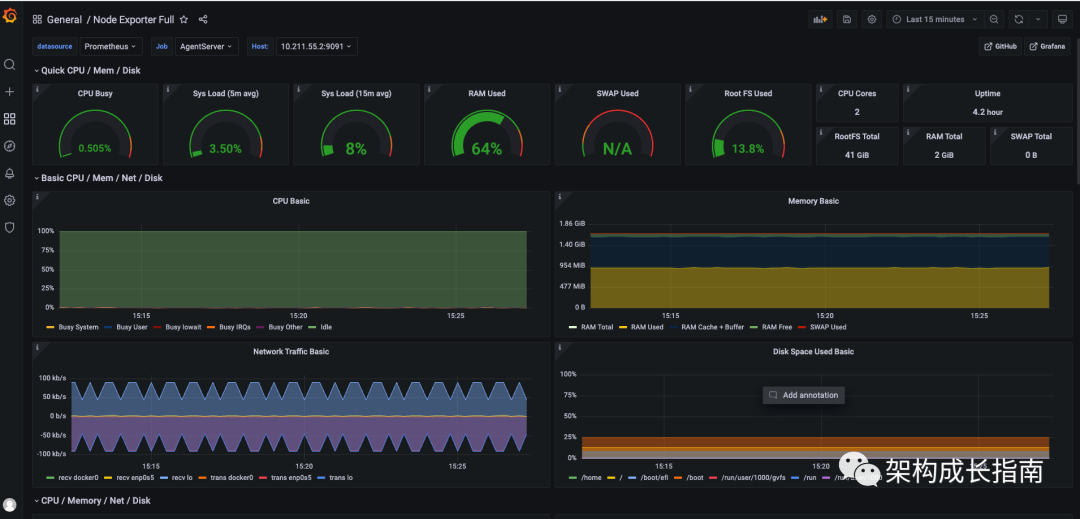
访问Grafana,可以看到边缘段数据已采集
Recommend
-
34
云计算已经成为一种主流力量,为现代组织带来了规模经济和突破性的技术进步,但这不仅仅是一种趋势,云计算正在以惊人的速度发展。然而,不断扩展的云环境也带来了新的风险。
-
5
互联网数据中心制冷如何“智”冷? 间接蒸发冷却助力碳中和_IDC空调制冷_中国IDC圈 观点 | 互联网数据中心制冷如何“智”冷? 间接蒸发冷却助力碳中和 得益于安全高效、显著节能的特性,间接蒸发冷却的接受程度更高,正在成...
-
5
Java 如何直接或间接生成 CDR 文件 V2EX › Java Java 如何直接或间接生成 CDR 文件
-
2
5个IT服务管理障碍以及如何克服的方法 责任编辑:cres 作者:Robert Scheier | 2022-03-07 09:22:00 原创文章 企业网D1Net 如果做得好,IT服务管理(ITSM)可以降低企业IT投资和管理成本,提高员工的...
-
6
...
-
2
如何利用间接电流模式仪表放大器放大具有大直流偏移的交流信号?-基础器件-与非网
-
0
2023-04-20 14:10 香港交易所:通过 ETF 间接进入虚拟资产市场更安全、更合规、风险更可控 巴比特讯,中国香港交易所近日发布研究报告《ETF 与全球金融市场虚拟资产生态圈的发展》。报告讨论的话题不仅包括虚拟资产 ETF 产品,还涵...
-
3
克服持续过程自动化的三个关键障碍 作者:Harris编译 2023-06-01 07:28:37 业务流程中通常涉及多个涉众。这可能包括业务部门的领导;企业架构师、IT运维和软件开发人员;甚至是企业高级管理人员的高度可见的过程。这...
-
4
如何克服数字化转型中的障碍 作者:Maziar Adl 2023-06-05 09:53:27 数字化转型 希望向高管展示数字化转型的团队成员可以通过帮助他们识...
-
3
复盘:在运营成长上,我克服的3种思维障碍 运营工作中,你是否还在用户和业务之间徘徊?是否还纠...
About Joyk
Aggregate valuable and interesting links.
Joyk means Joy of geeK