

在 SwiftUI 中实现音频图表
source link: https://www.51cto.com/article/773926.html
Go to the source link to view the article. You can view the picture content, updated content and better typesetting reading experience. If the link is broken, please click the button below to view the snapshot at that time.


在可访问性方面,图表是复杂的事物之一。iOS 15 引入了一项名为“音频图表”的新功能。
下面我们将学习如何通过使用 accessibilityChartDescriptor 视图修饰符为任何 SwiftUI 视图构建音频表示,呈现类似自定义条形图视图或图像的图表。
DataPoint 结构体
让我们从在 SwiftUI 中构建一个简单的条形图视图开始,该视图使用垂直条形显示一组数据点。
struct DataPoint: Identifiable {
    let id = UUID()
    let label: String
    let value: Double
    let color: Color
}
在这里,我们有一个 DataPoint 结构,用于描述条形图视图中的条形。它具有 id、标签、数值和填充颜色。
BarChartView 结构体
接下来,我们可以定义一个条形图视图,它接受一组 DataPoint 结构体实例并将它们显示出来。
struct BarChartView: View {
    let dataPoints: [DataPoint]

    var body: some View {
        HStack(alignment: .bottom) {
            ForEach(dataPoints) { point in
                VStack {
                    RoundedRectangle(cornerRadius: 8, style: .continuous)
                        .fill(point.color)
                        .frame(height: point.value * 50)
                    Text(point.label)
                }
            }
        }
    }
}
如上例所示,我们有一个 BarChartView,它接收一组 DataPoint 实例并将它们显示为水平堆栈中不同高度的圆角矩形。
ContentView 结构体
我们能够在 SwiftUI 中轻松构建条形图视图。接下来让我们尝试使用带有示例数据的新 BarChartView。
struct ContentView: View {
    @State private var dataPoints = [
        DataPoint(label: "1", value: 3, color: .red),
        DataPoint(label: "2", value: 5, color: .blue),
        DataPoint(label: "3", value: 2, color: .red),
        DataPoint(label: "4", value: 4, color: .blue),
    ]

    var body: some View {
        BarChartView(dataPoints: dataPoints)
            .accessibilityElement()
            .accessibilityLabel("Chart representing some data")
    }
}
在这里,我们创建了一组 DataPoint 实例的示例数组,并将其传递给 BarChartView。我们还为图表创建了一个可访问元素,并禁用了其子元素的可访问性信息。为了改进图表视图的可访问性体验,我们还添加了可访问性标签。
最后,我们可以开始为我们的条形图视图实现音频图表功能。音频图表可以通过旋钮菜单获得。要使用旋钮,请在 iOS 设备的屏幕上旋转两个手指,就像您在拨盘。VoiceOver 会说出第一个旋钮选项。继续旋转手指以听到更多选项。松开手指选择音频图表。然后在屏幕上上下滑动手指以导航。
音频图表允许用户使用音频组件理解和解释图表数据。VoiceOver 在移动到图表视图中的条形时播放具有不同音调的声音。VoiceOver 对于更大的值使用高音调,对于较小的值使用低音调。这些音调代表数组中的数据。
现在,我们可以讨论在 BarChartView 中实现此功能的方法。首先,我们必须创建一个符合 AXChartDescriptorRepresentable 协议的类型。AXChartDescriptorRepresentable 协议只有一个要求,即创建 AXChartDescriptor 类型的实例。AXChartDescriptor 类型的实例表示我们图表中的数据,以 VoiceOver 可以理解和交互的格式呈现。
extension ContentView: AXChartDescriptorRepresentable {
    func makeChartDescriptor() -> AXChartDescriptor {
        let xAxis = AXCategoricalDataAxisDescriptor(
            title: "Labels",
            categoryOrder: dataPoints.map(\.label)
        )

        let min = dataPoints.map(\.value).min() ?? 0.0
        let max = dataPoints.map(\.value).max() ?? 0.0

        let yAxis = AXNumericDataAxisDescriptor(
            title: "Values",
            range: min...max,
            gridlinePositions: []
        ) { value in "\(value) points" }

        let series = AXDataSeriesDescriptor(
            name: "",
            isContinuous: false,
            dataPoints: dataPoints.map {
                .init(x: $0.label, y: $0.value)
            }
        )

        return AXChartDescriptor(
            title: "Chart representing some data",
            summary: nil,
            xAxis: xAxis,
            yAxis: yAxis,
            additionalAxes: [],
            series: [series]
        )
    }
}
我们所需做的就是符合 AXChartDescriptorRepresentable 协议,并添加 makeChartDescriptor 函数,该函数返回 AXChartDescriptor 的实例。
首先,我们通过使用 AXCategoricalDataAxisDescriptor 和 AXNumericDataAxisDescriptor 类型定义 X 轴和 Y 轴。我们希望在 X 轴上使用字符串标签,这就是为什么我们使用 AXCategoricalDataAxisDescriptor 类型的原因。在线图的情况下,我们将在两个轴上都使用 AXNumericDataAxisDescriptor 类型。
接下来,我们使用 AXDataSeriesDescriptor 类型定义图表中的点。有一个 isContinuous 参数,允许我们定义不同的图表样式。例如,对于条形图,它应该是 false,而对于线图,它应该是 true。
struct ContentView: View {
    @State private var dataPoints = [
        DataPoint(label: "1", value: 3, color: .red),
        DataPoint(label: "2", value: 5, color: .blue),
        DataPoint(label: "3", value: 2, color: .red),
        DataPoint(label: "4", value: 4, color: .blue),
    ]

    var body: some View {
        BarChartView(dataPoints: dataPoints)
            .accessibilityElement()
            .accessibilityLabel("Chart representing some data")
            .accessibilityChartDescriptor(self)
    }
}
作为最后一步,我们使用 accessibilityChartDescriptor 视图修饰符将符合 AXChartDescriptorRepresentable 协议的实例设置为描述我们图表的实例。
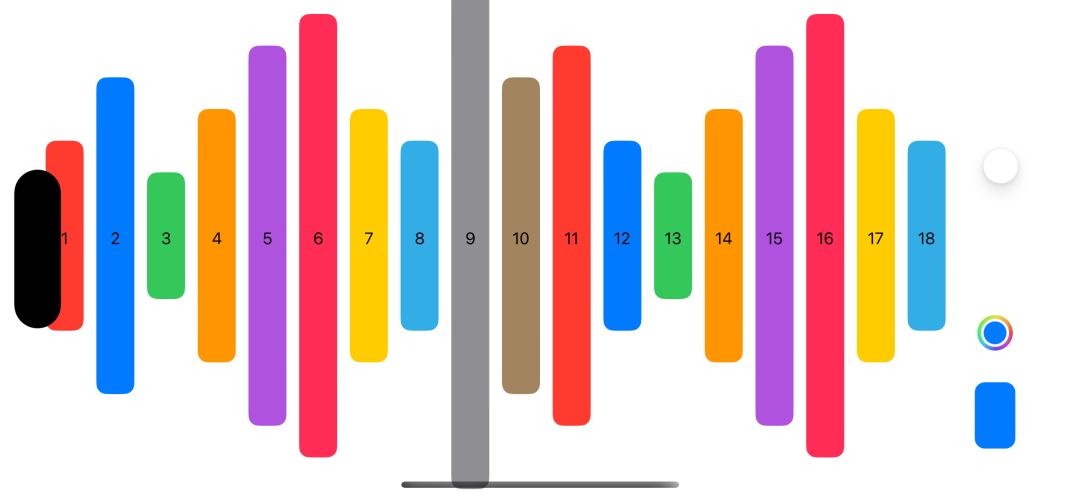
示例截图:
音频图表功能对于视力受损的用户来说是一项重大改进。音频图表功能的好处是,可以将其用于任何您想要的视图,甚至包括图像视图。只需创建 AXChartDescriptor 类型的实例。
Recommend
About Joyk
Aggregate valuable and interesting links.
Joyk means Joy of geeK