

如何快速从 32 位转储文件中找到异常发生时的线程上下文
source link: https://bianchengnan.gitee.io//articles/find-the-right-exception-context-in-x64-dump-continue/
Go to the source link to view the article. You can view the picture content, updated content and better typesetting reading experience. If the link is broken, please click the button below to view the snapshot at that time.

在上一篇文章中介绍了如何在 64 位进程的转储文件中查找异常上下文的方法 —— KiUserExceptionDispatcher() 函数对应栈帧的 Child-SP 的值保存了异常发生时的线程上下文。
本文将介绍如何在 32 位进程及 wow64 进程的转储文件中查找异常上下文的方法,并且会先介绍几个跟异常分发相关的函数和结构体。如果忘记了结论,可以根据函数参数手动逆向查找验证。
因为 32 位进程中的函数参数可以通过 ebp 进行定位 —— ebp+8 指向第一个参数,ebp+c 指向第二个参数 …(对调用约定不是 fastcall 的函数有效,一般系统 API 都是 stdcall),每个函数的 ebp 值可以通过 k 命令列出来。如果知道了关键函数的参数,就可以快速定位到异常上下文了。
在查找前先介绍几个关键结构体及异常分发函数。
关键的异常分发函数
ntdll!KiUserExceptionDispatcher
void KiUserExceptionDispatcher(EXCEPTION_RECORD* exceptionRecord, CONTEXT* contextRecord);ntdll!RtlDispatchException
BOOL RtlDispatchException(EXCEPTION_RECORD* exceptionRecord, CONTEXT* contextRecord);kernel32!UnhandledExceptionFilter
LONG UnhandledExceptionFilter(_EXCEPTION_POINTERS* ExceptionInfo);
关键的结构体
typedef struct _EXCEPTION_POINTERS
{
  PEXCEPTION_RECORD ExceptionRecord;
  PCONTEXT          ContextRecord;
} EXCEPTION_POINTERS, *PEXCEPTION_POINTERS;
0:000> dt _EXCEPTION_RECORD
ntdll!_EXCEPTION_RECORD
   +0x000 ExceptionCode    : Int4B
   +0x004 ExceptionFlags   : Uint4B
   +0x008 ExceptionRecord  : Ptr32 _EXCEPTION_RECORD
   +0x00c ExceptionAddress : Ptr32 Void
   +0x010 NumberParameters : Uint4B
   +0x014 ExceptionInformation : [15] Uint4B
-
注意:文档中给出的
_CONTEXT是64位的定义,通过dt命令列出来的是32位的。
0:000> dt _CONTEXT
ntdll!_CONTEXT
   +0x000 ContextFlags     : Uint4B
   +0x004 Dr0              : Uint4B
   +0x008 Dr1              : Uint4B
   +0x00c Dr2              : Uint4B
   +0x010 Dr3              : Uint4B
   +0x014 Dr6              : Uint4B
   +0x018 Dr7              : Uint4B
   +0x01c FloatSave        : _FLOATING_SAVE_AREA
   +0x08c SegGs            : Uint4B
   +0x090 SegFs            : Uint4B
   +0x094 SegEs            : Uint4B
   +0x098 SegDs            : Uint4B
   +0x09c Edi              : Uint4B
   +0x0a0 Esi              : Uint4B
   +0x0a4 Ebx              : Uint4B
   +0x0a8 Edx              : Uint4B
   +0x0ac Ecx              : Uint4B
   +0x0b0 Eax              : Uint4B
   +0x0b4 Ebp              : Uint4B
   +0x0b8 Eip              : Uint4B
   +0x0bc SegCs            : Uint4B
   +0x0c0 EFlags           : Uint4B
   +0x0c4 Esp              : Uint4B
   +0x0c8 SegSs            : Uint4B
   +0x0cc ExtendedRegisters : [512] UChar
下面通过几个实例介绍如何在 32 位进程及 wow64 进程的转储文件中查找异常上下文。
基本上 32 位进程和 wow64 进程查找方法一样,不再单独分析,这里介绍几种典型情况。
下图是某个 32 位进程转储文件发生异常时的调用栈。
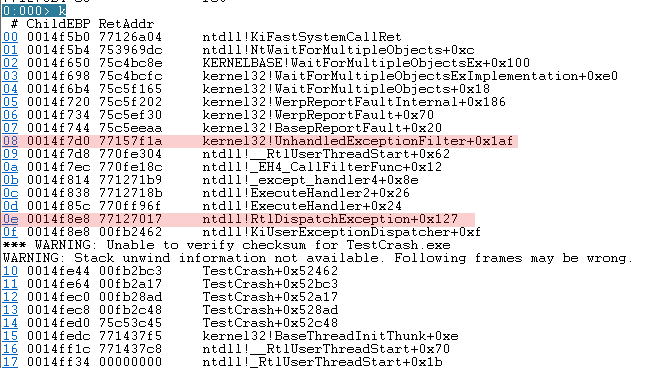
从上图中可知,RtlDispatchException() 对应的 ebp 是 0x0014f8e8,UnhandledExceptionFilter() 对应的 ebp 是 0x0014f7d0。从RtlDispatchException() 入手。
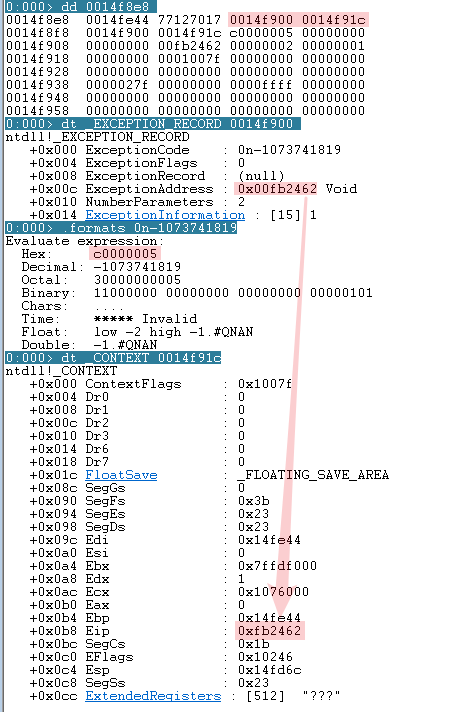
通过 dd 0014f8e8 命令可以得知 EXCEPTION_RECORD 的地址是 0x0014f900(ebp+8 处的值),CONTEXT 的地址是 0x0014f91c (ebp+c 处的值)。
再通过 dt _EXCEPTION_RECORD 0014f900 和 dt _CONTEXT 0014f91c 查看对应结构体的具体内容,可以发现是匹配的,如下图。
下图是某个 wow64 位进程转储文件发生异常时的调用栈。
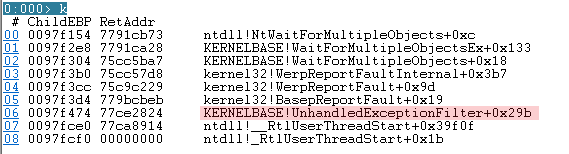
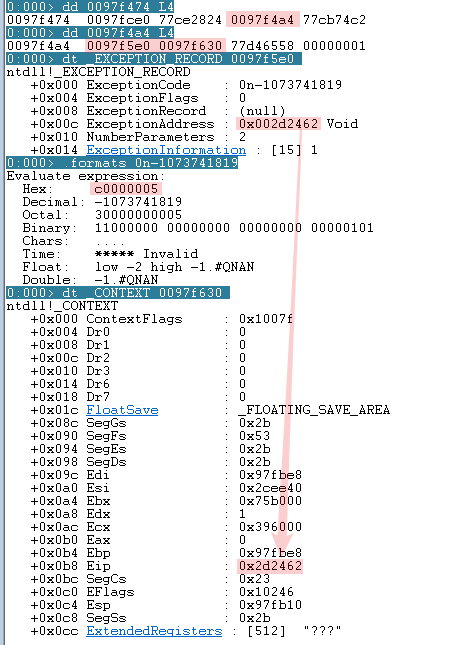
调用栈中只能看到 UnhandledExceptionFilter() ,对应的 ebp 是 0x0097f474。ebp+8 位置的值(0x0097f4a4)存储了
_EXCEPTION_POINTERS* 的值(0x0097f4a4)。使用 dd 0097f4a4 L4 查看 _EXCEPTION_RECORD 的地址(0x0097f5e0)和 _CONTEXT 的地址(0x0097f630)。然后再验证,发现是匹配的。郑国过程如下图:
32位进程中的函数参数可以通过ebp进行定位。我觉得这是32位进程调试时相对于64位进程最友好的地方了,不用费劲到栈上找参数了。可以通过
ntdll!RtlDispatchException()和kernel32!UnhandledExceptionFilter()的参数快速找到异常上下文。
Recommend
About Joyk
Aggregate valuable and interesting links.
Joyk means Joy of geeK