

Streamlining Backend Operations: High-Fidelity Wireframes for TV’s Broadcasting...
source link: https://uxplanet.org/streamlining-backend-operations-high-fidelity-wireframes-for-tvs-broadcasting-management-portal-5e868ec9148c
Go to the source link to view the article. You can view the picture content, updated content and better typesetting reading experience. If the link is broken, please click the button below to view the snapshot at that time.

Streamlining Backend Operations: High-Fidelity Wireframes for TV’s Broadcasting Management Portal
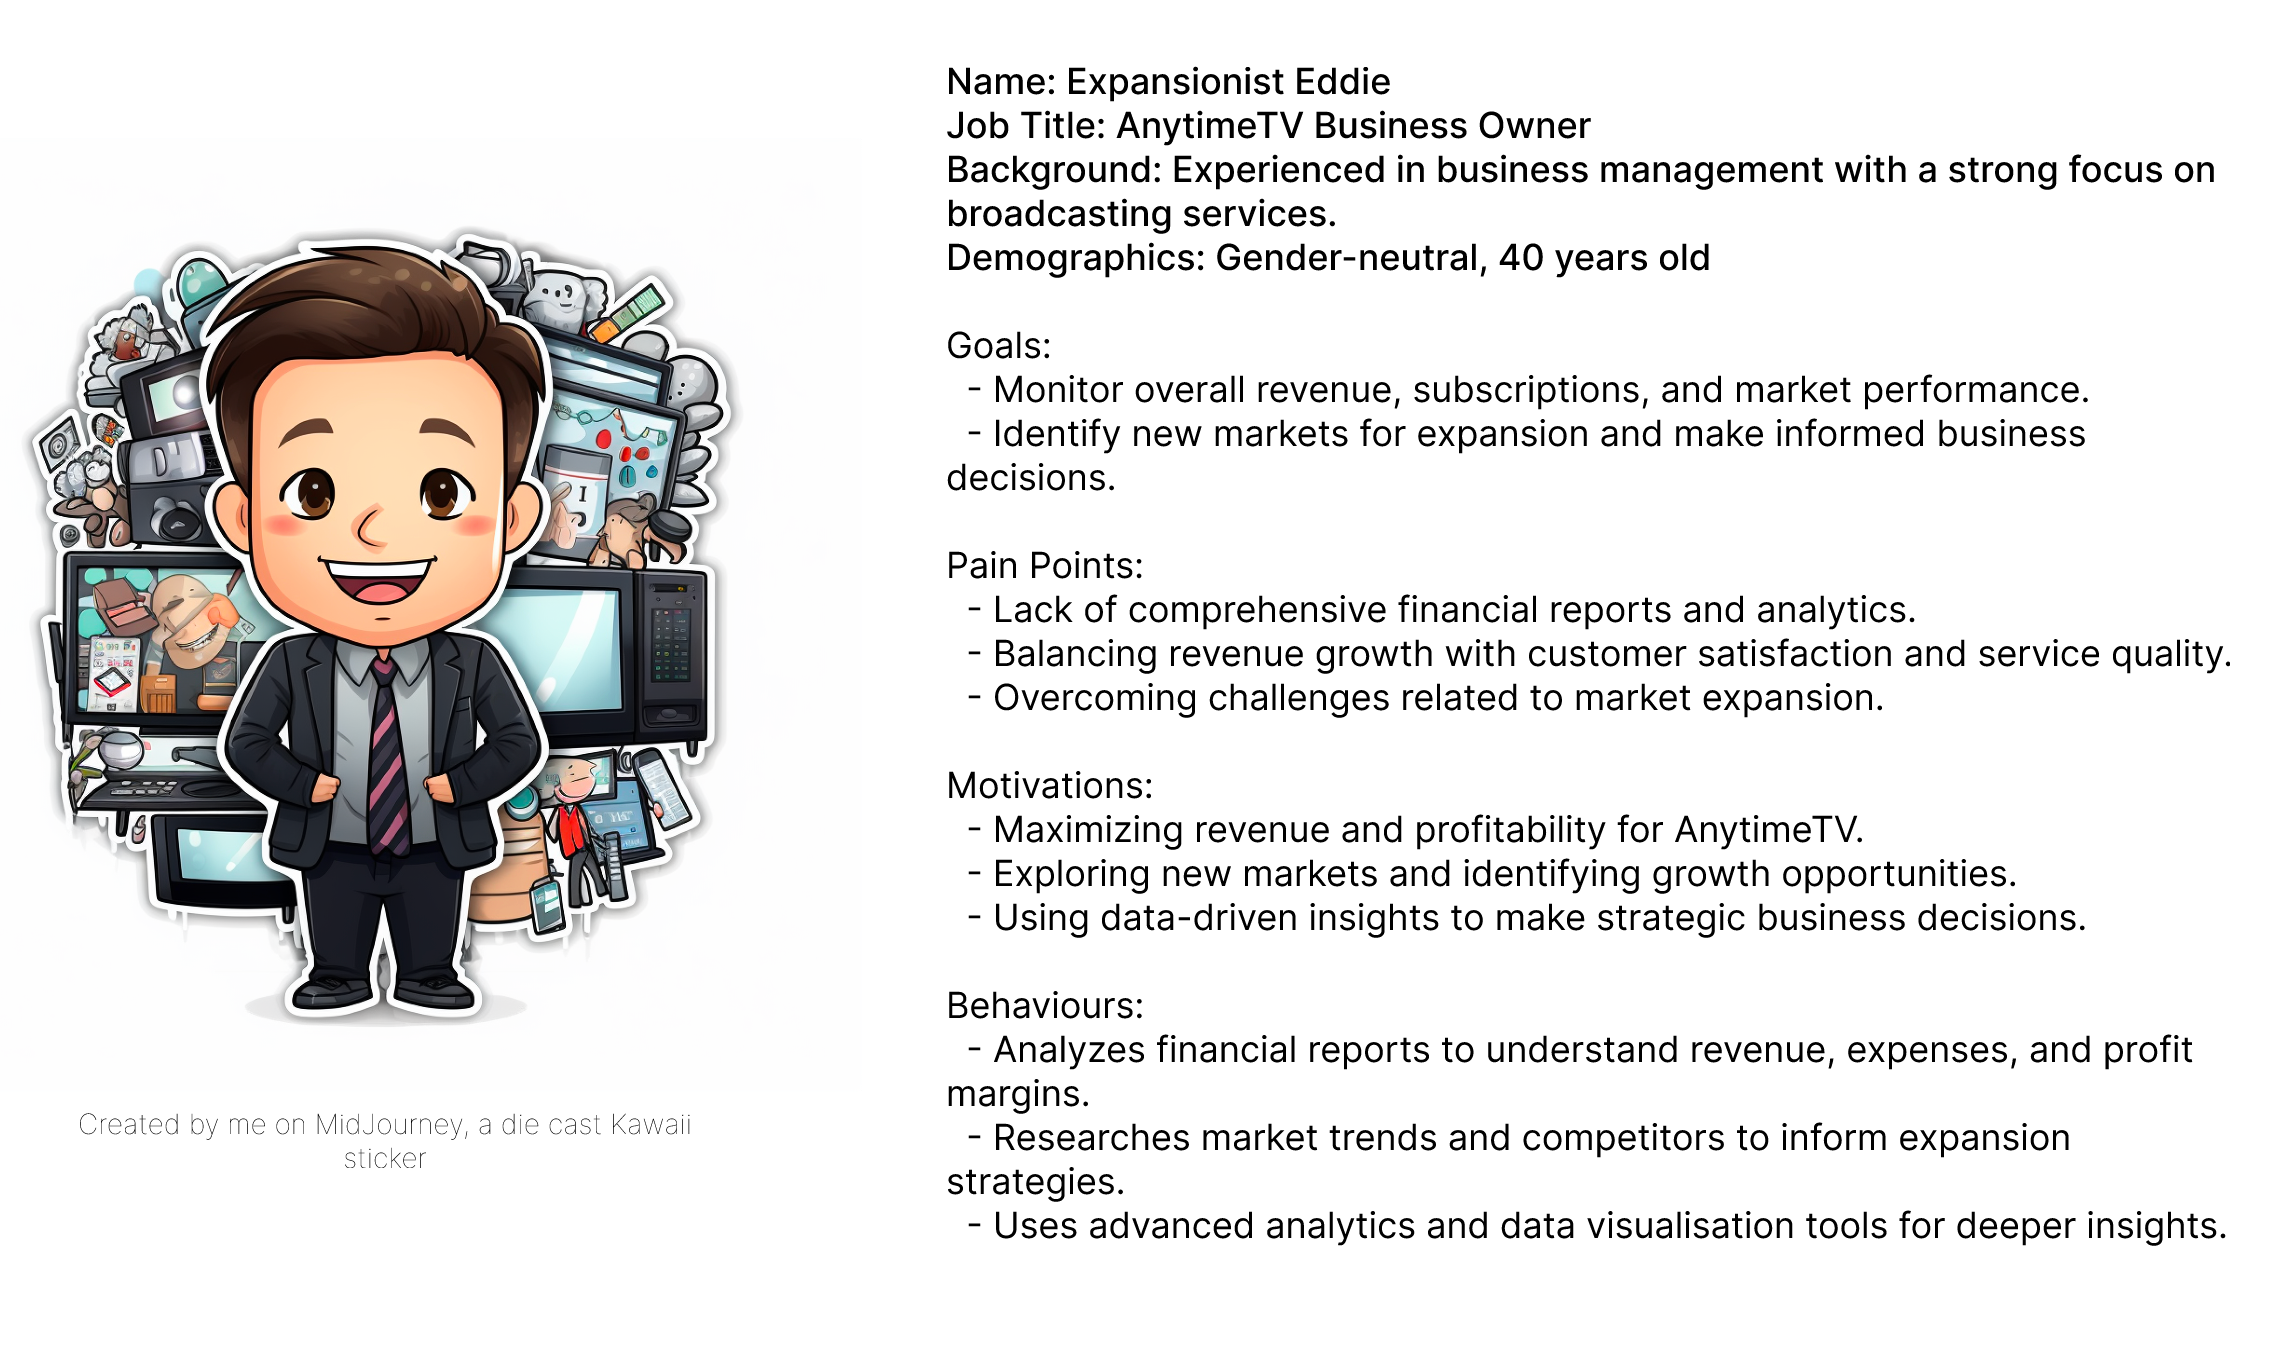
Embark on a journey of seamless backend management for the fictitious broadcasting services of AnytimeTV. In this solution, I present a meticulously crafted series of high-fidelity wireframes that cater to the distinct needs of three key user personas: Agents, Admins, and Business Owners. By delving into the intricacies of their daily tasks, I’ve reimagined their online portal experience, ensuring efficient package marketing, real-time monitoring, and strategic decision-making.
Join me as I unveil a user-centered symphony of design, where every wireframe echoes the essence of operational excellence.
“Before we begin, it’s important to clarify that ‘AnytimeTV’ is used purely as a reference name for this UI/UX case study. It represents a fictional TV broadcasting company, serving as a basis for the design exploration. The focus here lies on the design solution itself, tailored to address the needs of various user personas within this context. Now, let’s delve into the intricacies of crafting a user-centered symphony of design.”
I am also unveiling 3 Exquisite Dashboards Tailored to Diverse Sales, Backend, and Business Owner User Personas.


Here is a Figma link to refer to: Figma File
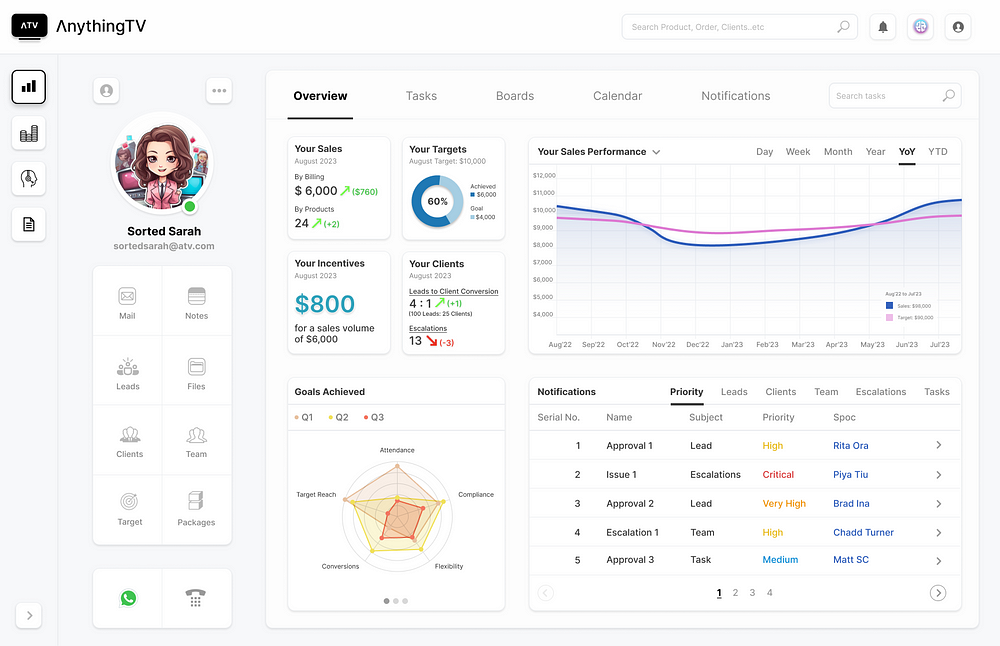
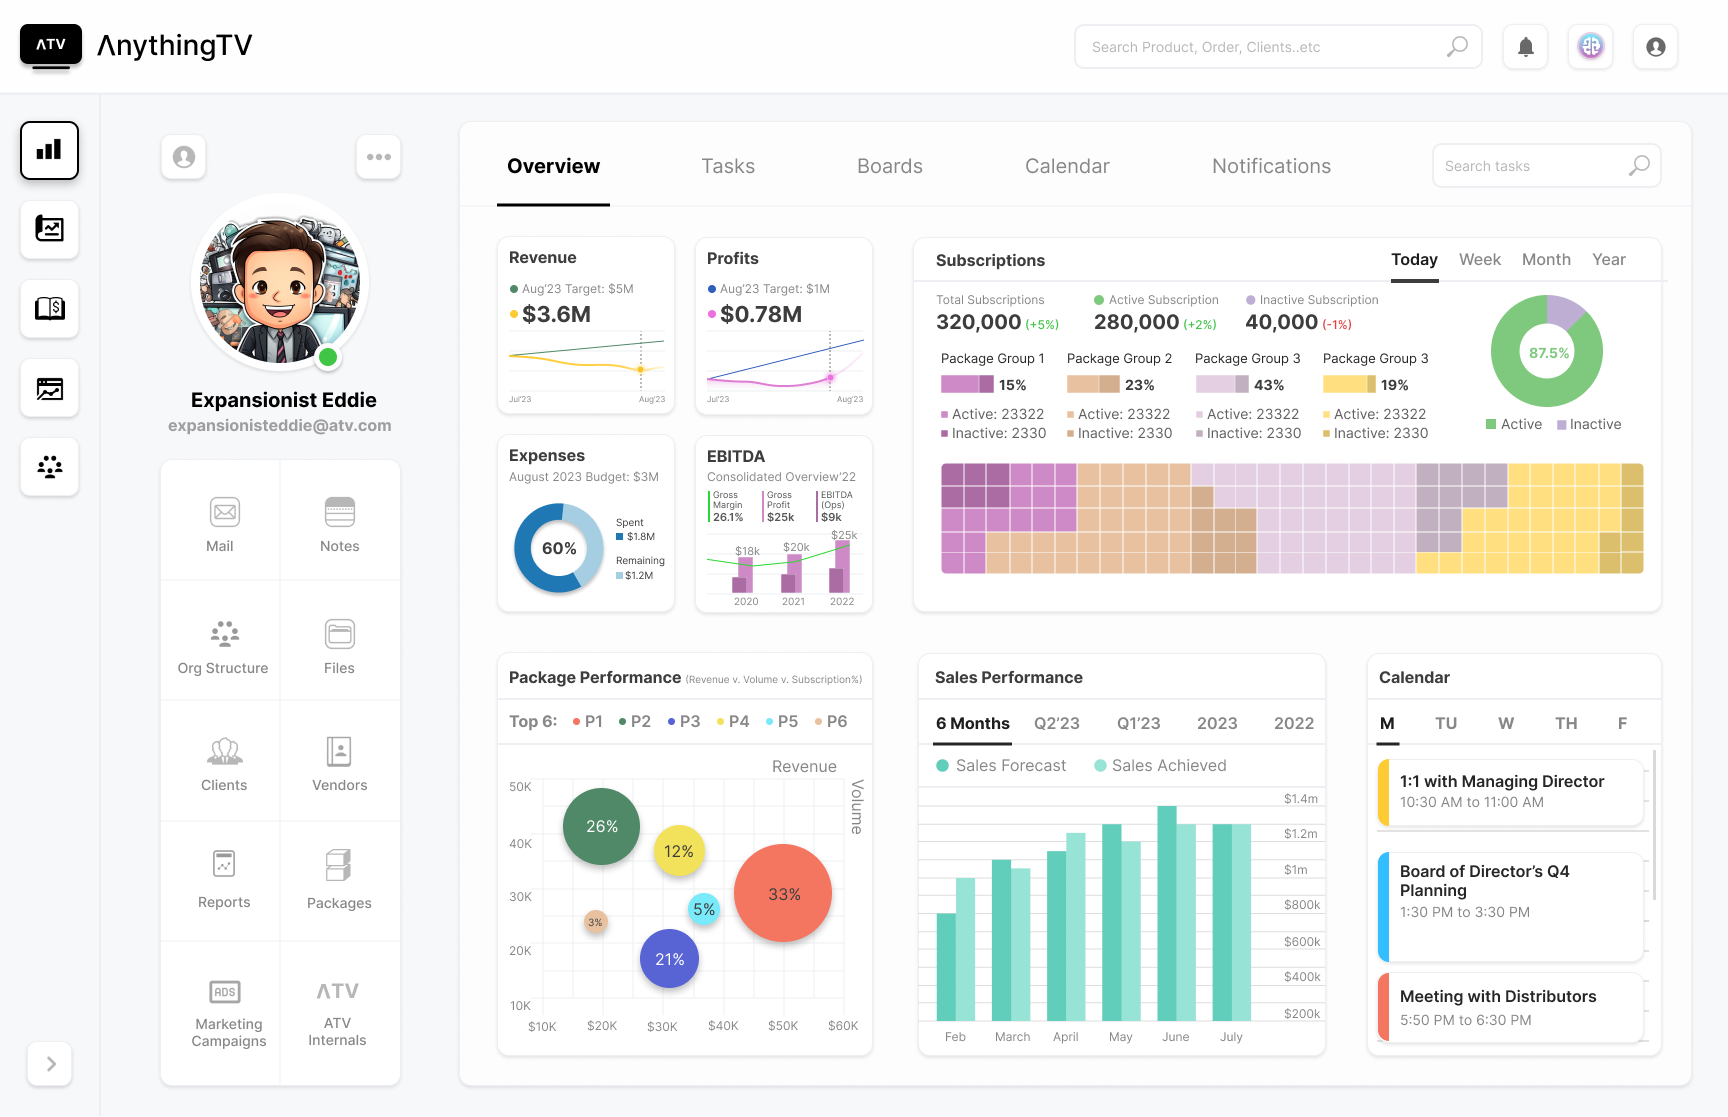
Designing for the Sales Agent View:
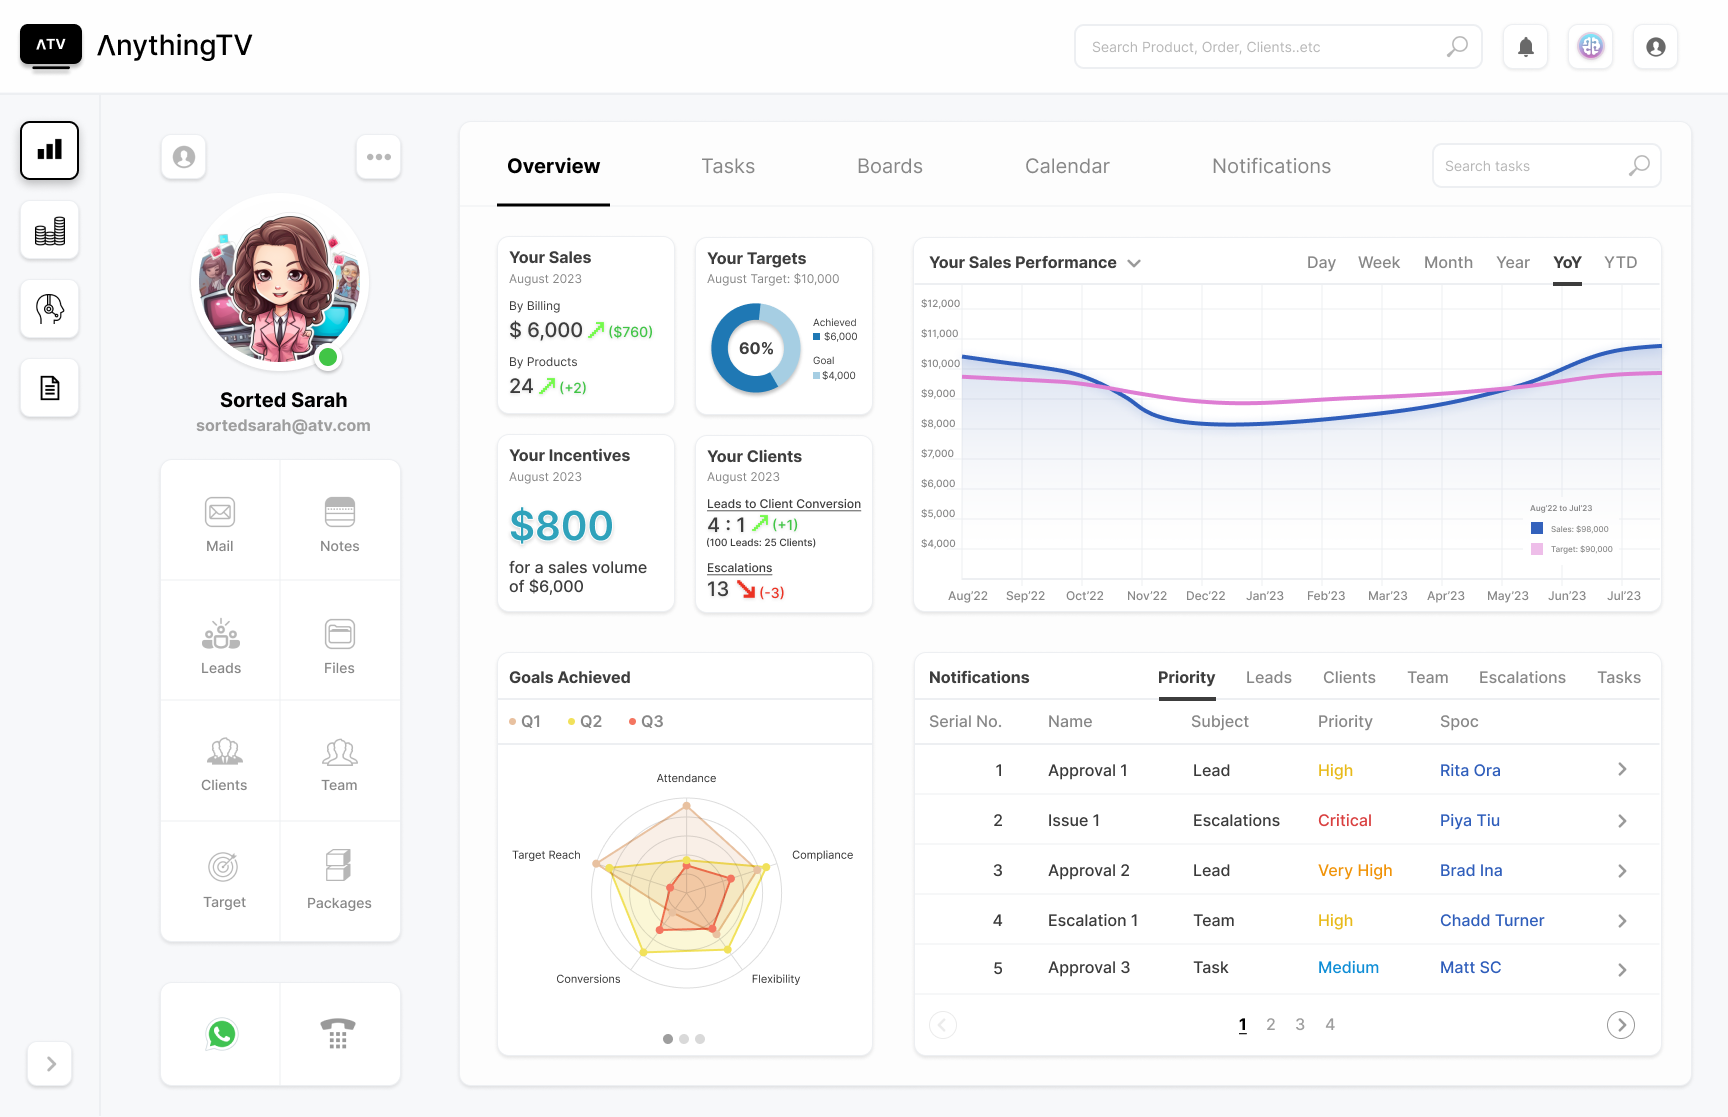


That was the overview. Here are the individual screens:
Dashboards! Overview.
Interaction: Left Panel

Here are navigations!
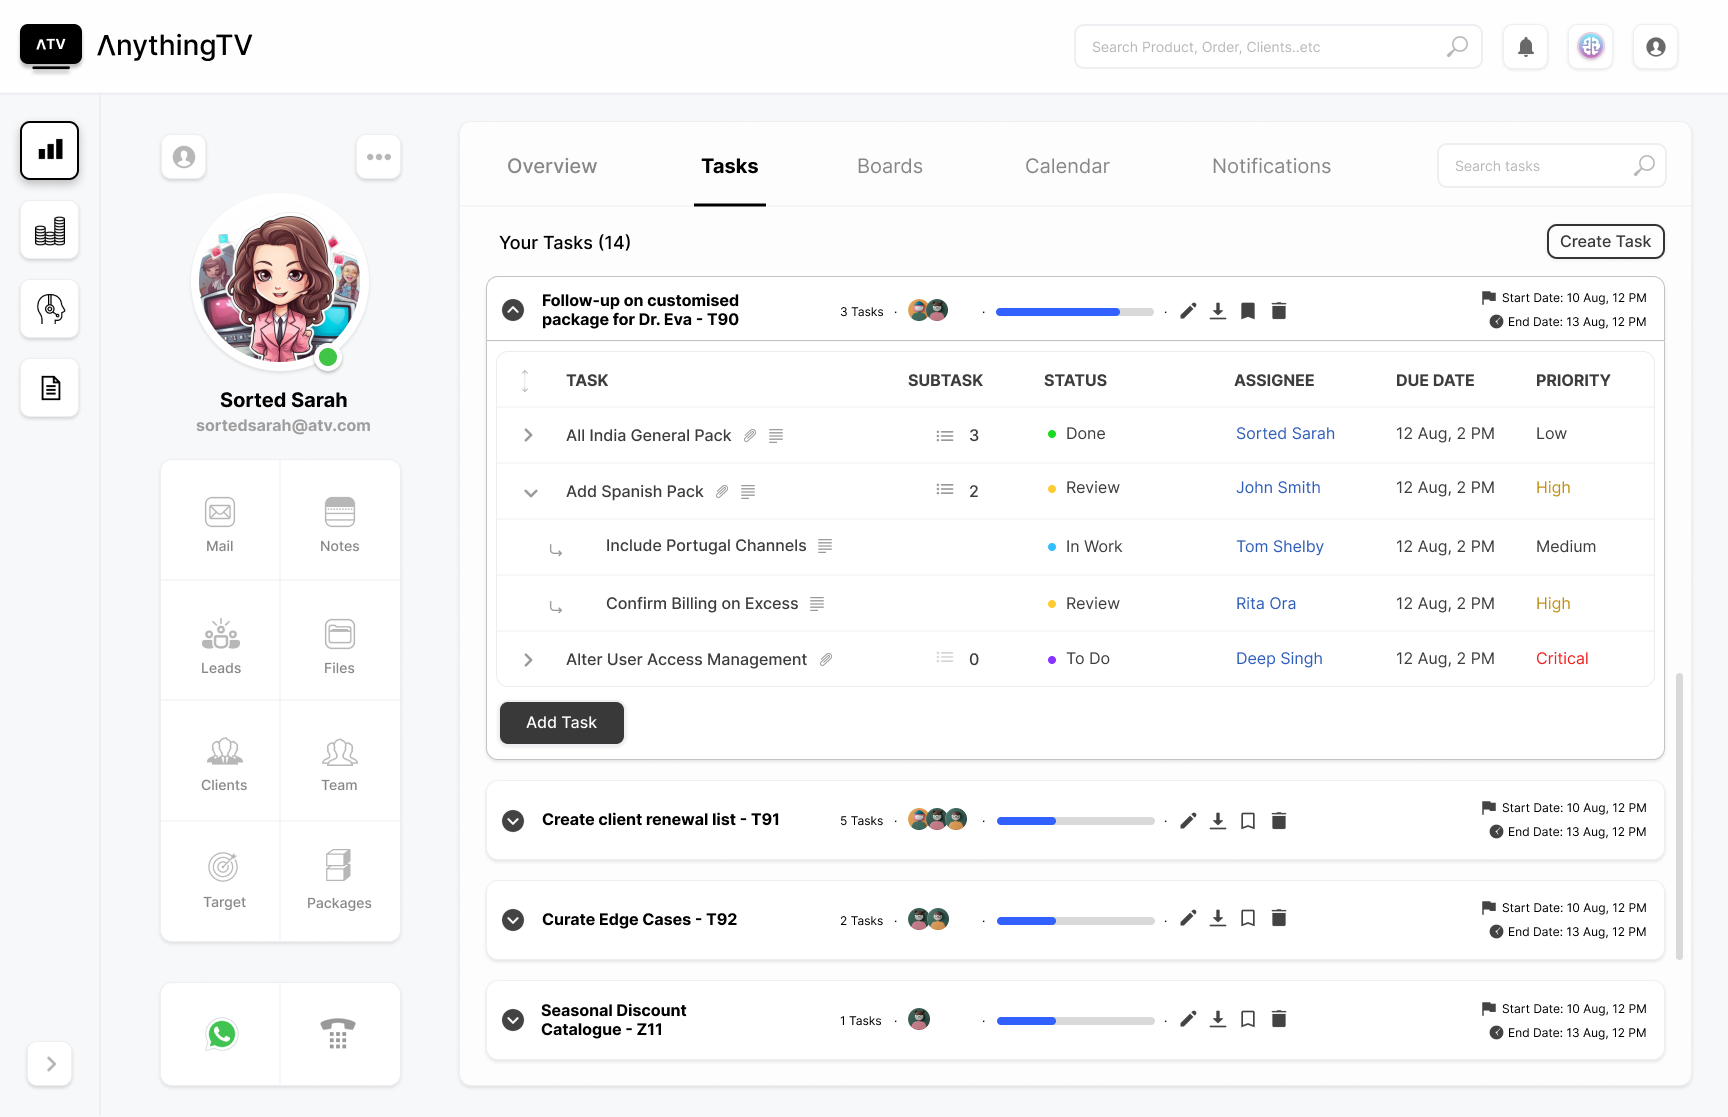
- Tasks

Interaction: Creating a Task

2. Boards

Interactions: Create a task

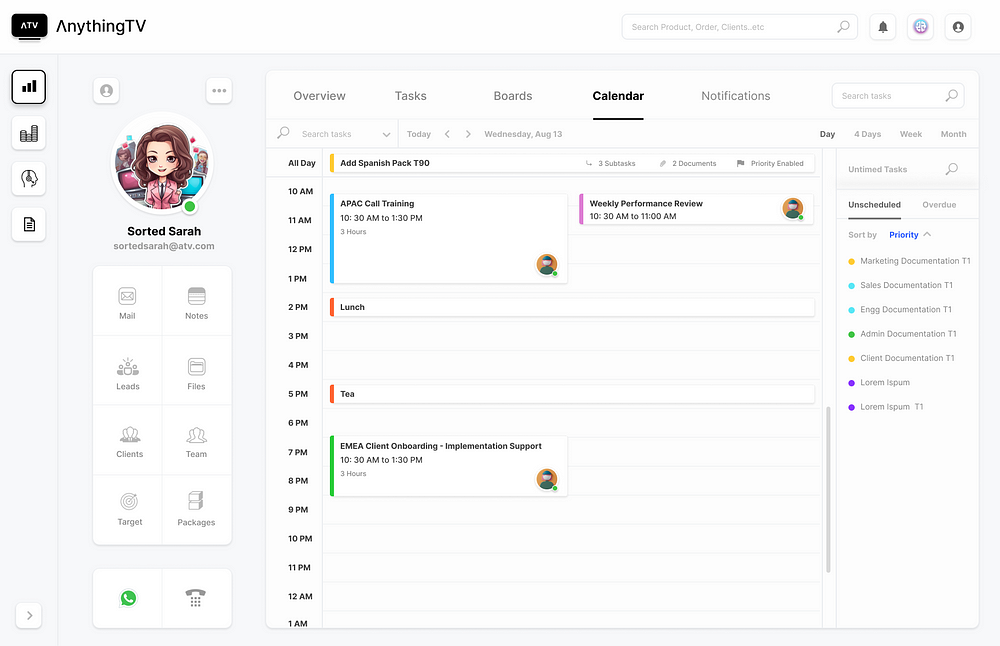
3. Calendar
Now, for the Admin..
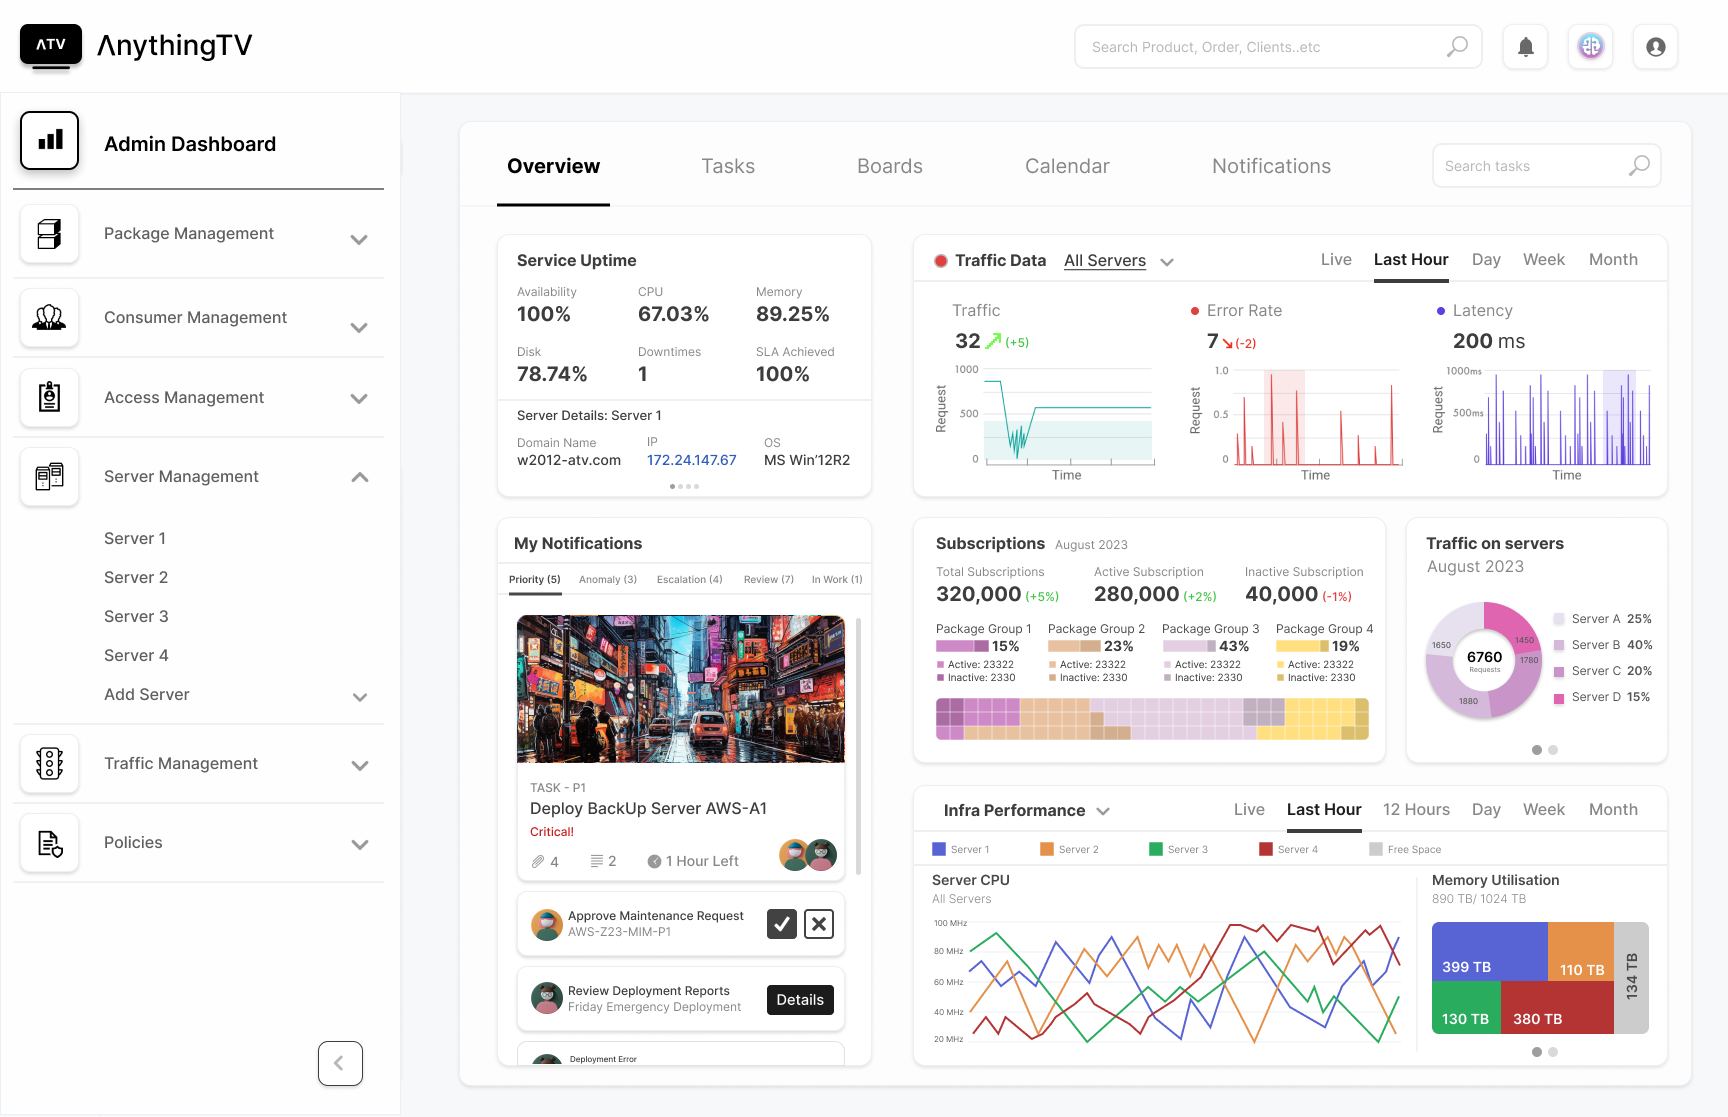


Now for the individual screens..
Dashboard! Overview
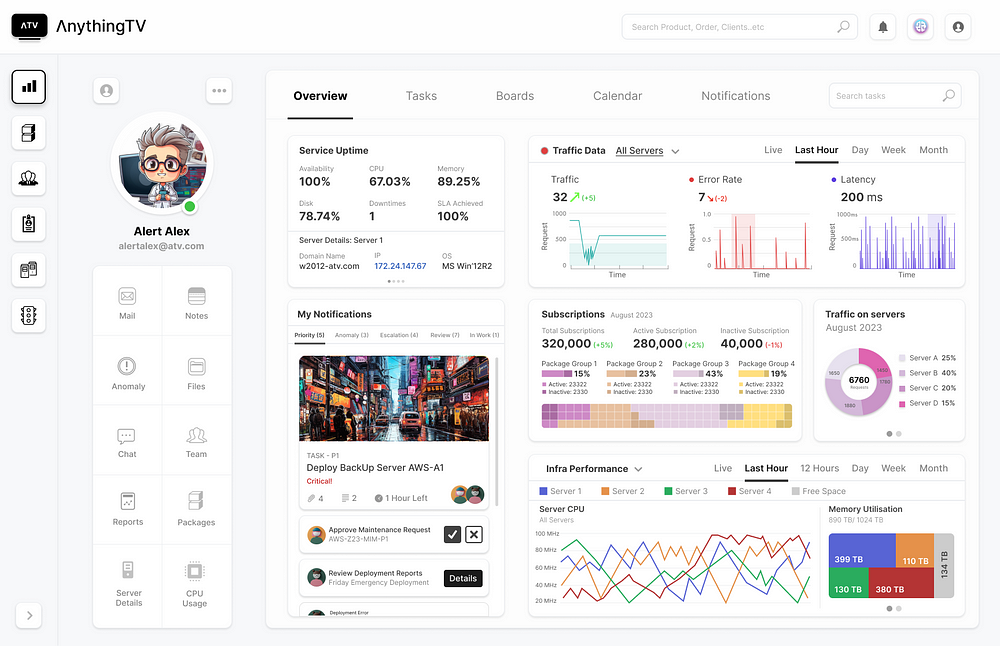
Interaction: Left Panel

The admin (Alex) navigates to Traffic Management..

Interaction: He clicks on the expand drop button on the panel strip..

Interaction: He clicks on one of the rows to find more detail about the incident..

Now for the Business owner..


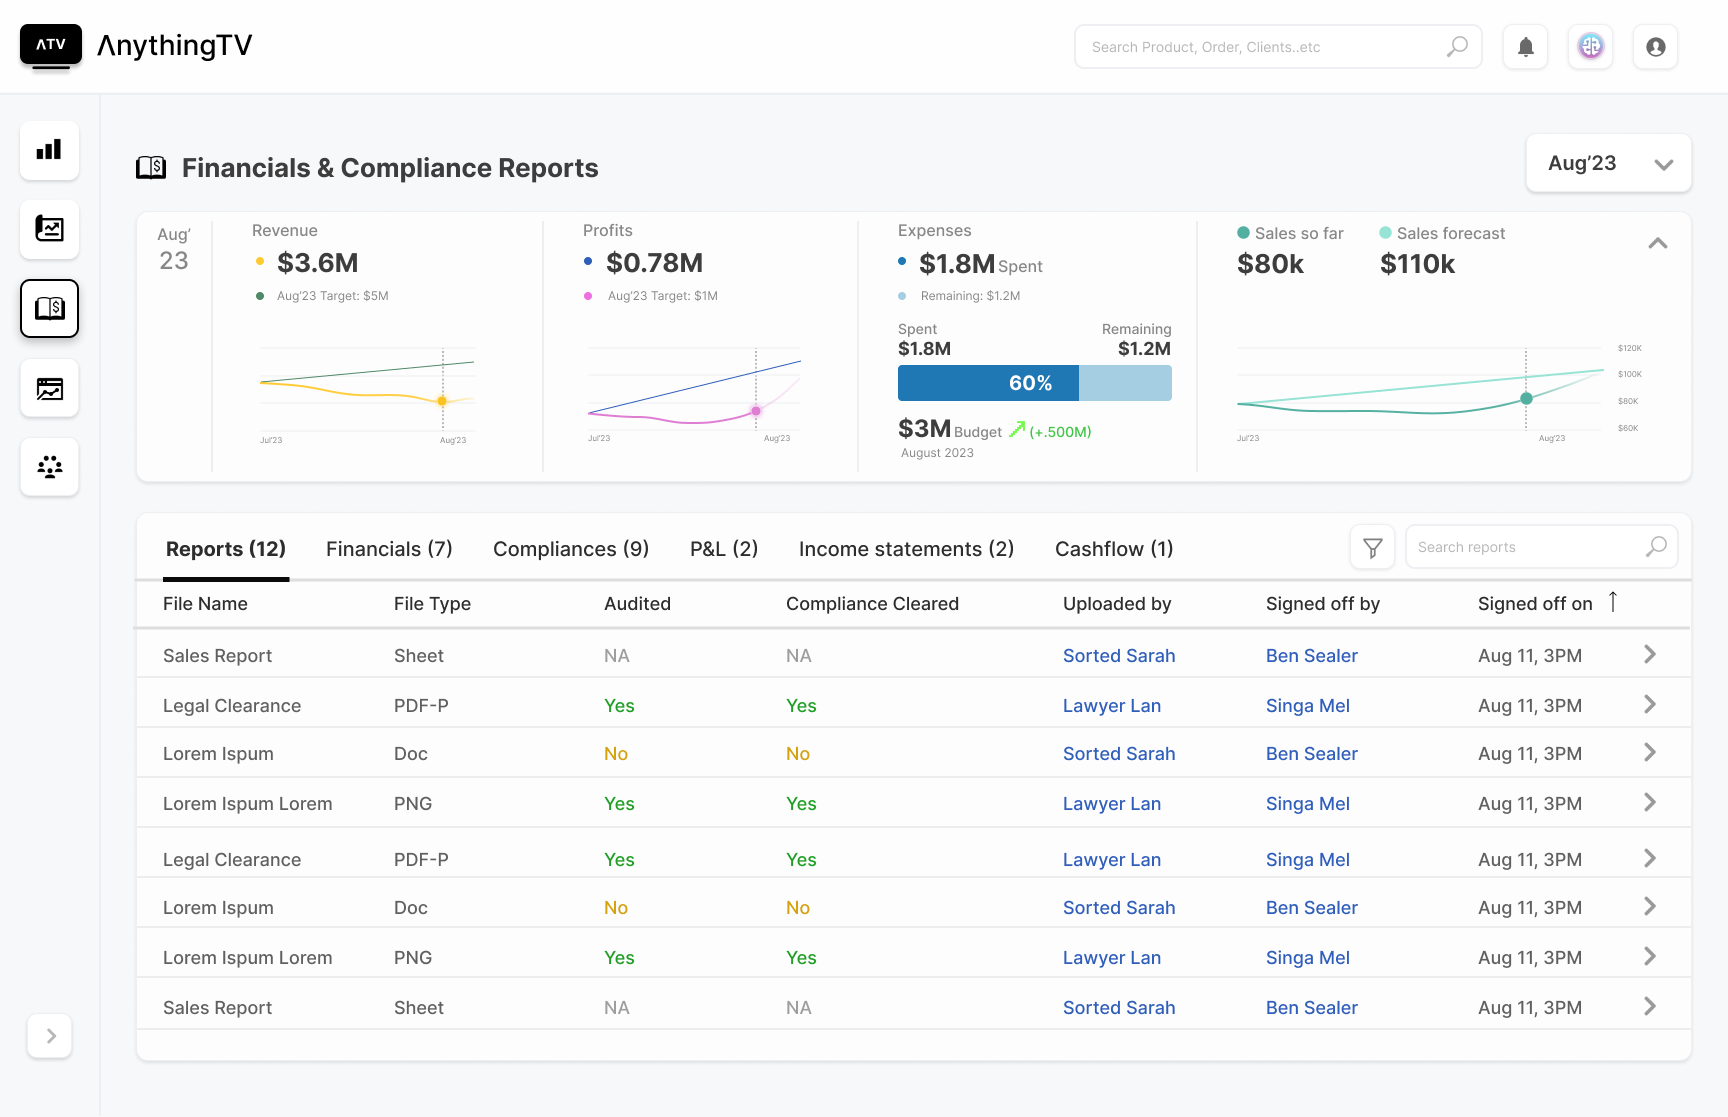
Some individual screens..
- Dashboard

Interaction: Left Panel

Navigating to Financial Reports..
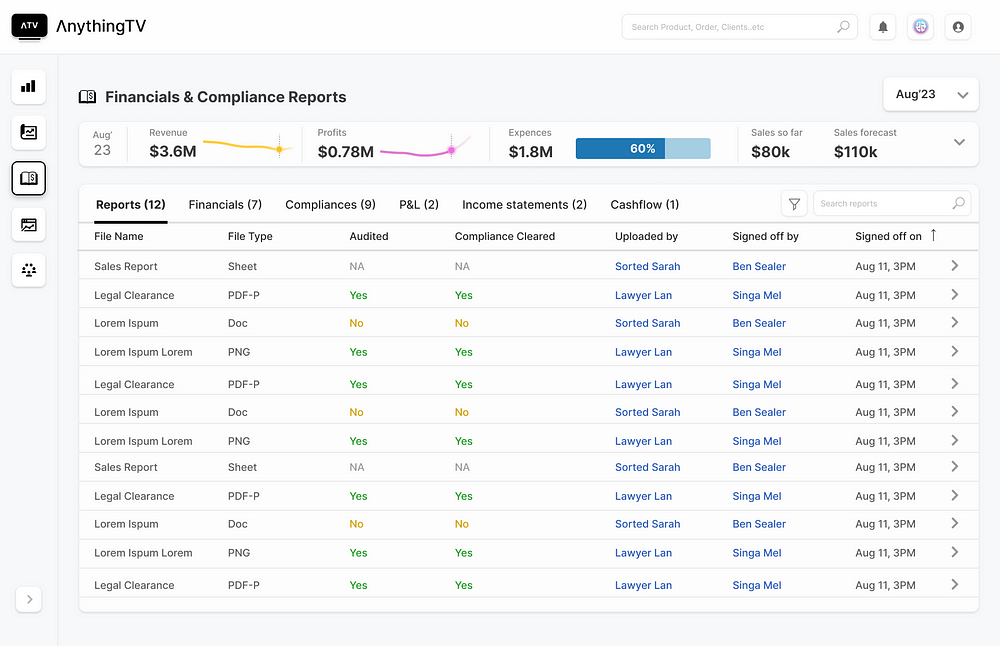
Interaction: User clicks the expand chevron..

In conclusion, the challenge posed by AnytimeTV’s complex subscription-based broadcasting services necessitates a design solution that caters to the distinct needs of its three primary user groups — Agents, Admins, and Business Owners. The development of high-fidelity wireframes, complemented by meticulous research, sketches, and data visualization principles, lays the foundation for a holistic design approach.
While the final design holds substantial significance, it’s essential to emphasize that the journey itself, the process of arriving at the solution, is equally crucial. The path to crafting an effective, user-centric platform is often laden with insights, revelations, and adaptations. This process, including feedback loops and iterative refinements, not only refines the final product but also ensures that it remains responsive to evolving user requirements.
Drawing inspiration from design luminaries like Edward Tufte, who advocate for information-rich, user-centric dashboards, your creation aligns with principles that prioritize clarity, conciseness, and the elimination of clutter. With a commitment to leveraging data visualization to empower users with actionable insights, your dashboard promises to revolutionize how AnytimeTV monitors and manages its broadcasting services.
The journey to this solution has been one of exploration, creativity, and a dedication to addressing the unique challenges of AnytimeTV. As we look forward to the implementation of these high-fidelity wireframes, we are reminded that effective design is not just a destination; it’s a dynamic process that will continue to evolve with the changing landscape of user needs and expectations.
Recommend
About Joyk
Aggregate valuable and interesting links.
Joyk means Joy of geeK