

Container Apps: How to capture a network trace using TCPDUMP
source link: https://azureossd.github.io/2023/09/06/capturing-a-network-trace-aca/index.html
Go to the source link to view the article. You can view the picture content, updated content and better typesetting reading experience. If the link is broken, please click the button below to view the snapshot at that time.

Container Apps: How to capture a network trace using TCPDUMP
2 minute read | By Aldmar Joubert
This post will cover using TCPDUMP to capture a network trace on Container Apps.
Prerequisites
Some important prerequisites are to be able to capture and download the dump file for analysis:
- Ability to download files from the container. This can be done by mounting an Azure File Share with read/write permissions allowed.
- Ability to connect to the container through the Console blade or use the
az containerapp execcommand. See console documentation here
Download files from the container
You’ll need a way to download files from the container. By default, there is no way to get files generated at runtime by a container in Container Apps without some additional configuration.
The most simplistic way is to mount a volume from an Azure File Share with an Azure Storage Account.
For a quickstart on how to add a volume, follow Use storage mounts in Azure Container Apps
Console access
You can use either the Azure CLI or the portal for console access. Below is what portal access would look like:
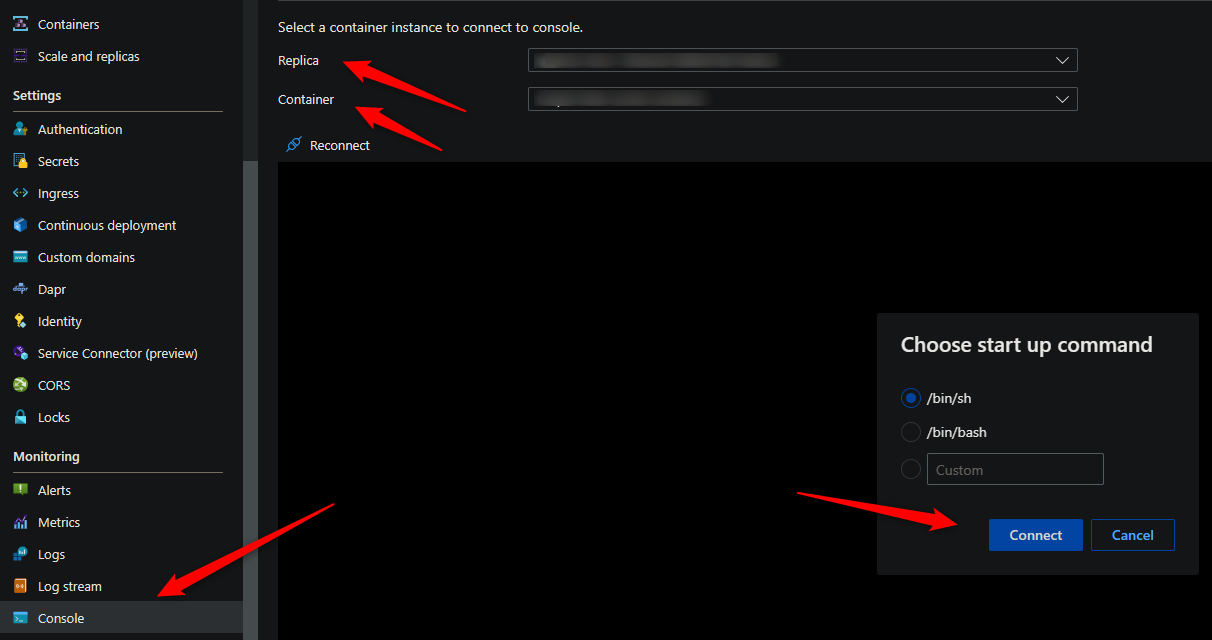
The commands for installing TCPDUMP and capturing a network trace requires access to a terminal - so console access is required.
Installing TCPDUMP
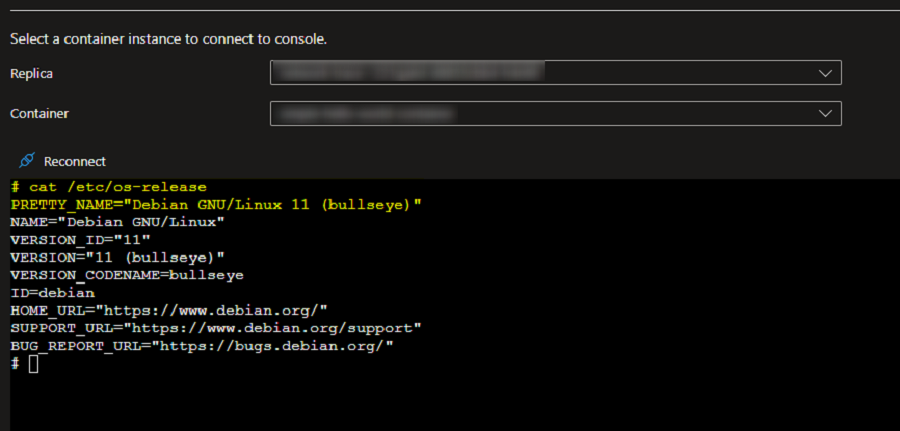
Validate the OS
Run th below command in the console to validate which installation commands to use.
cat /etc/os-release
Install TCPDUMP
For Ubuntu/Jessie/Debian based images, you need to run the below commands:
	apt-get update
	apt install tcpdump
For Alpine based images, you need to run the below commands:
	apk update
	apk add tcpdump
Collect a network trace using TCPDUMP
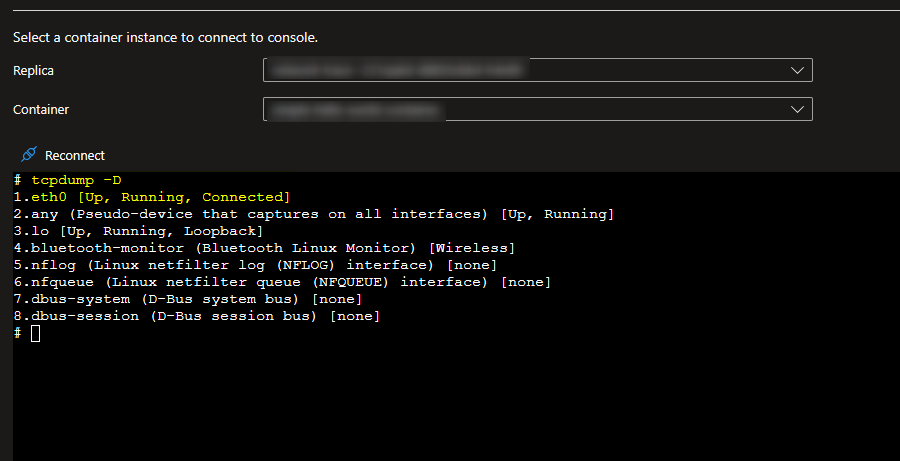
Check which network interface is being used
tcpdump -D
Run TCPDUMP
Once you have identified which network interface you wish to collect the trace on, run the below TCPDUMP command to start collecting the trace for traffic flowing through that particular network interface. The trace will be saved to a file named dump.pcap under your mount path.
tcpdump -i eth0 -s0 -w /MOUNT-PATH/dump.pcap
Reproduce the issue and once complete you can stop the trace in the console with CTRL + C. The dump will then be available to download in your file share.
Explanation of each switch in the above command
-i : is to select which interface the capture is to take place on. If you want to capture traffic on all interfaces use -i any
-s : Snap length, is the size of the packet to capture. -s0 will set the size to unlimited - use this if you want to capture all the traffic.
-w : to write to a capture file.
Analyze the newtork trace
Wireshark can be used to analyze the PCAP file locally.
To analyze the PCAP file in the console, use:
tcpdump -r dump.pcap
Post questions | Provide product feedback
Tags: Configuration container apps network trace networking storage mounts tcpdump
Categories: Container Apps How-To Troubleshooting
Updated: September 06, 2023
Recommend
-
47
In my experience as a sysadmin, I have often found network connectivity issues challenging to troubleshoot. For those situations, tcpdump is a great ally. The Linux Terminal
-
49
Enjoy this republication of my original article originally posted at SQL Solutions Group. Many people work in a tightly controlled environment. Every change requires a change control form and approval to make a...
-
104
README.md xdpcap xdpcap is a tcpdump like tool for eXpress Data Path (XDP). It can capture packets and actions / return codes from XDP programs, using...
-
9
Debugging Distributed Trace Gaps with tcpdump By Max Englander, Sep 14, 2020 At Teachers Pay Teachers, our engi...
-
12
Capturing specific SSL and TLS version packets using tcpdump(8) March 8th, 2019 In the process of deprecating old and insecure versions of TLS, I wanted to capture all packets that were of TLS version < 1.2...
-
4
Network trace in Oracle RDBMS13-Jul-2008: Network trace in Oracle RDBMS There're well-known parameters trace_level_server and trace_level_client in
-
9
LIBPCAP 1.x.y by The Tcpdump Group To report a security issue please send an e-mail to [email protected]. To report bugs and...
-
11
Assuming the target containers can actually install new software (apt install is available) what follows is a quick and very dirty method to run tcpdump on k8s/AKS containers in Azure. If you’re running Kubernetes 1.23 and up,...
-
5
Resources > Blog > Blog How OpenTelemetry Is Changing the...
-
3
Collecting a Network Trace on Linux Web Apps 5 minute read | By Fred Cardoso ...
About Joyk
Aggregate valuable and interesting links.
Joyk means Joy of geeK