

一个经典教程学会机器学习构建过程:鸢尾花分类
source link: http://kw.dataea.cn/2023/08/03/sklearn-ml-1/
Go to the source link to view the article. You can view the picture content, updated content and better typesetting reading experience. If the link is broken, please click the button below to view the snapshot at that time.

使用scikit-learn数据集iris来进行鸢尾花分类,构建一个机器学习模型 ,可以从这些已知品种的鸢尾花测试数据中进行学习,从而能够预测新鸢尾花的品种。
本教程基于scikit-learn数据集iris来进行鸢尾花分类,构建一个机器学习模型 ,可以从这些已知品种的鸢尾花测试数据中进行学习,从而能够预测新鸢尾花的品种。
学习目标:了解进行机器学习的基本流程,了解数据集准备、模型选择、分类算法、模型精度评估,为后续具体算法学习做好准备。
一、初识数据
查看数据集的结构和内容
from sklearn.datasets import load_iris
iris_dataset = load_iris()
# 展示数据字典
print(iris_dataset.keys())
# target_names对应预测花的品牌名称
print("target_names : \n{}".format(iris_dataset['target_names']))
# feature_names 对应每一个特征的说明:萼片长度、萼片宽度、花瓣长度、花瓣宽度
print("feature_names: \n{} ".format(iris_dataset['feature_names']))
# 展示数据结构
print("shape : {}",iris_dataset['data'].shape)
# 查看5个数据样本
print(iris_dataset['data'][:5])
# target 是每朵花对应的一个品种名称用数字表示
print(iris_dataset['target'])
dict_keys(['data', 'target', 'frame', 'target_names', 'DESCR', 'feature_names', 'filename', 'data_module'])
target_names :
['setosa' 'versicolor' 'virginica']
feature_names:
['sepal length (cm)', 'sepal width (cm)', 'petal length (cm)', 'petal width (cm)']
shape : {} (150, 4)
[[5.1 3.5 1.4 0.2]
 [4.9 3.  1.4 0.2]
 [4.7 3.2 1.3 0.2]
 [4.6 3.1 1.5 0.2]
 [5.  3.6 1.4 0.2]]
[0 0 0 0 0 0 0 0 0 0 0 0 0 0 0 0 0 0 0 0 0 0 0 0 0 0 0 0 0 0 0 0 0 0 0 0 0
 0 0 0 0 0 0 0 0 0 0 0 0 0 1 1 1 1 1 1 1 1 1 1 1 1 1 1 1 1 1 1 1 1 1 1 1 1
 1 1 1 1 1 1 1 1 1 1 1 1 1 1 1 1 1 1 1 1 1 1 1 1 1 1 2 2 2 2 2 2 2 2 2 2 2
 2 2 2 2 2 2 2 2 2 2 2 2 2 2 2 2 2 2 2 2 2 2 2 2 2 2 2 2 2 2 2 2 2 2 2 2 2
 2 2]
二、准备训练数据和测试数据
我们要用新的数据来评估模型的性能。新数据是指模型之前没有见过的数据,而我们有这些数据的标签。通常的做法是将收集好的带标签的数据分成两部分。一部分数据用于构建机器学习模型,叫作训练数据(training data)或训练集(training set)。其余的数据用来评估模型性能,叫作测试数据(test data)、测试集(test set)或留出集(hold-out set)。
一般选择数据集的75%的行数据及对应标签作为训练集,剩下25%的数据及标签作为测试集。
from sklearn.model_selection import train_test_split
X_train,X_test,y_train,y_test = train_test_split(
    iris_dataset['data'],iris_dataset['target'],random_state=0)
# random_state 参数用于随机数生成器的种子,确保函数输出固定不变。

print("train shape: {},{} ".format(X_train.shape,y_train.shape))
print("test shape: {},{} ".format(X_test.shape,y_test.shape))
train shape: (112, 4),(112,)
test shape: (38, 4),(38,)
三、观察数据
绘制数据可视化视图,观察数据特征关系。使用pandas DataFrame 绘制散点矩阵图。
import pandas as pd
# 利用数据集中feature_names中的字符串对数据列进行标记
iris_dataframe = pd.DataFrame(X_train,columns=iris_dataset.feature_names)
print(iris_dataframe.head(10))
# 利用DataFrame创建散点图矩阵,按y_train 即 target 着色
grr = pd.plotting.scatter_matrix(iris_dataframe,c=y_train,figsize=(15,15),marker='o', hist_kwds={'bins':20},s=60,alpha=.8 )
 sepal length (cm)  sepal width (cm)  petal length (cm)  petal width (cm)
0                5.9               3.0                4.2               1.5
1                5.8               2.6                4.0               1.2
2                6.8               3.0                5.5               2.1
3                4.7               3.2                1.3               0.2
4                6.9               3.1                5.1               2.3
5                5.0               3.5                1.6               0.6
6                5.4               3.7                1.5               0.2
7                5.0               2.0                3.5               1.0
8                6.5               3.0                5.5               1.8
9                6.7               3.3                5.7               2.5
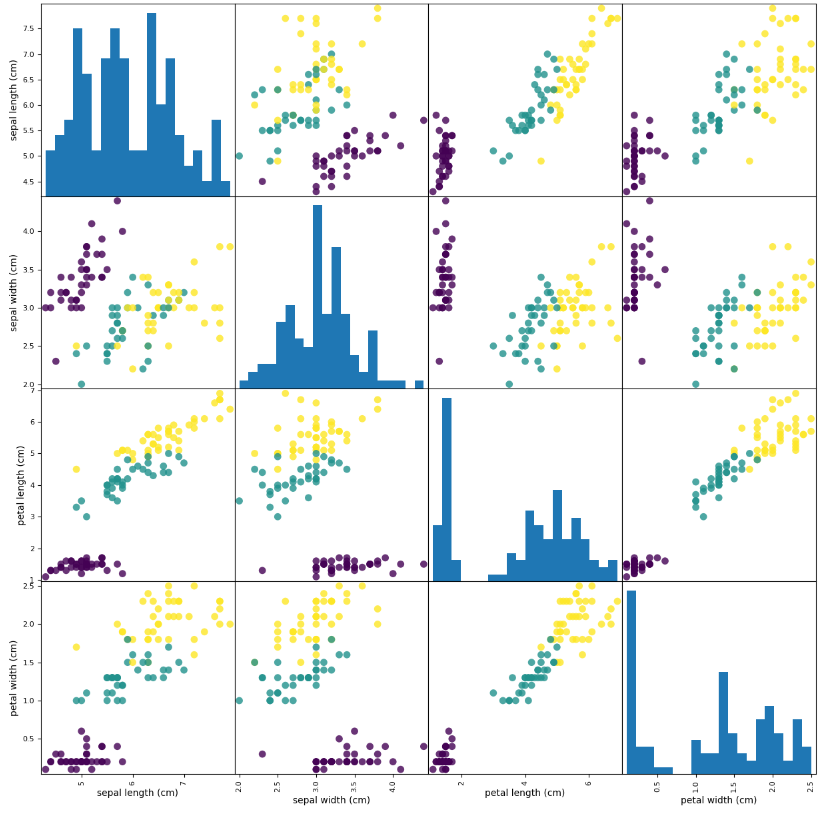
从图中可以看出,利用花瓣和花萼的测量数据基本可以将三个类别区分开。这说明机器学习模型很可能可以学会区分它们,些数据集可以作为目标训练数据使用。
三、构建模型:K近邻算法
本任务的目标是对花的品种进行分类,所以可以使用分类算法。
要对一个新的数据点做出预测,算法会在训练集中寻找与这个新数据点距离 最近的数据点一将找到的数据点的标签赋值给这个数据点。
K近邻算法中的K的含义是,我们可以考虑训练集中与新数据点最近的任意k个邻居,而不只是考虑最近的那一个。然后我们可以用这些邻居中数量最多的类别做出预测。
from sklearn.neighbors import KNeighborsClassifier
knn = KNeighborsClassifier(n_neighbors=1)
knn.fit(X_train,y_train)
四、执行预测
根据数据特征要求,输入新的预测数据执行模型预测
import numpy as np
# 输入预测数据,scikit-learn要求必须为NumPy二维数组
X_new = np.array([[5,2.9,1,0.2]])
print(X_new.shape)
prediction = knn.predict(X_new)
print('预测结果为:{}, 对应鸢尾花品种为:{}'.format(prediction, iris_dataset['target_names'][prediction] ))
预测结果为:[0], 对应鸢尾花品种为:['setosa']
五、评估模型精度
评估模型精度(accuracy)。
需要用于之前创建的测试集。这些数据用于构建模型,但我们知道测试集中每朵花的实际品种。
因此,我们可以用测试数据中的每朵花进行预测,并将预测结果与标签进行对比。
通过计算精度来衡量模型的优劣,精度就是品种预测正确的花所占的比例。
# 评估方式一:
y_pred = knn.predict(X_test)
print(y_pred)
print('评估测试数据得分:{:.2f}'.format(np.mean(y_pred == y_test)))
[2 1 0 2 0 2 0 1 1 1 2 1 1 1 1 0 1 1 0 0 2 1 0 0 2 0 0 1 1 0 2 1 0 2 2 1 0
 2]
评估测试数据得分:0.97
# 评估方式二:
# 使用knn对象的score方法计算测试集的精度
print('评估测试数据得分:{:.2f}'.format(knn.score(X_test, y_test)))
评估测试数据得分:0.97
该模型得分0.97,即精度为97%。
Recommend
About Joyk
Aggregate valuable and interesting links.
Joyk means Joy of geeK