

在 CLI 簡易測量網頁回應時間
source link: https://blog.darkthread.net/blog/measure-web-speed-w-curl/
Go to the source link to view the article. You can view the picture content, updated content and better typesetting reading experience. If the link is broken, please click the button below to view the snapshot at that time.

在 CLI 簡易測量網頁回應時間
| 2023-08-23 10:52 PM | 0 | 694 |
工作上有個小需求,想找到簡便方法顯示網頁回應速度,方便快速擷圖對照改善前後的時間差異。
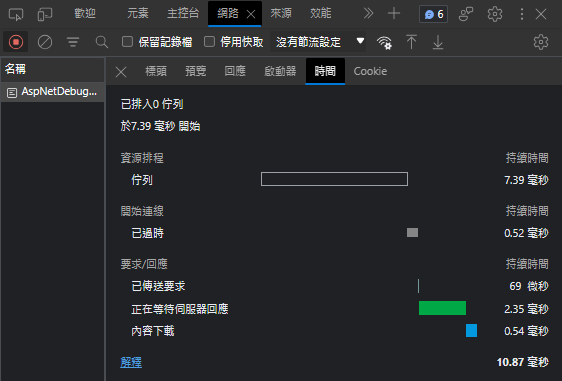
相關軟體很多,但我不想為此安裝程式,以既有工具優先;Chrome/Edge F12 開發者工具的網路功能也有每個 HTTP Request 的時間報表,是個不錯的選項:
不過,我想找到更簡單的 CLI 做法,貼指令按 Enter 直接看數字,還能在同一個畫面呈現多次測試的數據,感覺更有效率。
遠在天邊近在眼前,爬文發現,curl 就能助我完美實現夢想。(在 Windows 想使用 curl 可在 Cmder 或 Git for Windows 找到)
curl 有個 --write-out/-w 參數,能在傳輸完成後顯示相關統計,其中包含幾個有用數據:參考
- size_download 下載 Bytes 數
- speed_download 下載速度
- time_namelookup 從開始到完成 DNS 解析花費的秒數
- time_connect 從開始到到 TCP 連線建立花費的秒數
- time_appconnect 從開始到 TLS/SSL/SSH 等交握完成花費的秒數
- time_redirect 302/301 重導過程耗費的秒數(含 DNS 解析、TCP 連線... 等時間)
- time_pretransfer 從開始到傳完請求內容伺服器準備傳送回應花費的秒數
- time_starttransfer 從開始到傳回第一個 Byte 花費的秒數 (TTFB, Time to First Byte)
- time_total 整個傳輸過程耗費的時間總和
由以上時間可以再推算出幾個效能相關數字:
- time_appconnect - time_connec = TLS/SSL 交握、憑證檢核花費時間
- time_pretransfer - time_appconnect = 上傳請求內容耗費時間
- time_starttransfer - time_pretransfer = 伺服器端程式運算處理時間
- time_total - time_starttransfer = 傳完回應內容資料所耗費時間
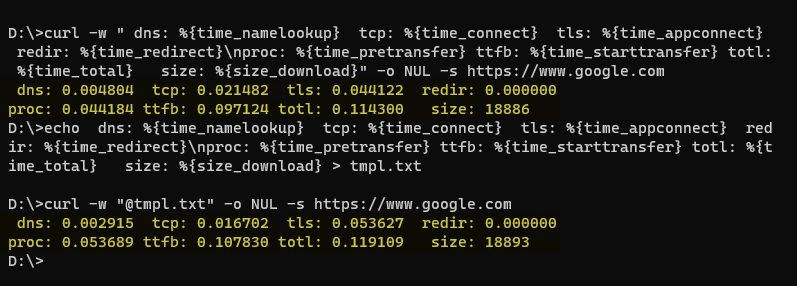
依上述說明,我組裝了一個簡單的測試指令,用縮寫名稱表達各階段:dns = DNS 解析、tcp = TCP 連線建立、tls = TLS 交握完成、proc = 伺服器端開始處理、ttfb = 回傳第一個 Byte 的時間、totl = 總計時間、redir = 重新導向過程耗時
# -w 指定輸出樣版、-o NUL (Linux/macOS 為 -o /dev/null) 將回傳結果導向黑洞
curl -w " dns: %{time_namelookup}  tcp: %{time_connect}  tls: %{time_appconnect}  redir: %{time_redirect}\nproc: %{time_pretransfer} ttfb: %{time_starttransfer} totl: %{time_total}   size: %{size_download}" -o NUL -s https://www.google.com
# 或將輸出樣版存取檔案
echo  dns: %{time_namelookup}  tcp: %{time_connect}  tls: %{time_appconnect}  redir: %{time_redirect}\nproc: %{time_pretransfer} ttfb: %{time_starttransfer} totl: %{time_total}   size: %{size_download} > tmpl.txt
curl -w "@tmpl.txt" -o NUL -s https://www.google.com
一行指令,輸入不同 URL 得到數字,完全不囉嗦,沒有多餘資訊,是我要的簡潔有力風格。
寫一支簡單的 ASPX,驗證它可以突顯不同階段的耗時狀況:
<%@Page Language="C#"%>
<script runat="server">
    void Page_Load(object sender, EventArgs e)
    {
        if (Request["delay"] == "Y")
            System.Threading.Thread.Sleep(5000);
        if (Request["10M"] == "Y")
            for (int i = 0; i < 10*1024 ; i++)
			{
                Response.Write(new string('A', 1024*1024));
				Response.Flush();
			}
		else
			Response.Write("OK");
    }
</script>
實測可觀察到 delay=Y 時從 proc 到 ttfb 耗時五秒,10M=Y 時,執行時間很短,但從第一個 Byte (ttfb) 到全部傳完 (totl) 花了超過 23 秒。

最後來測試重導時間,https://microsoft.com 會歷經兩次重導來到 https://www.microsoft.com/zh-tw/

curl 加上 -L 自動重導到目標,成功觀察到重導過程耗時:
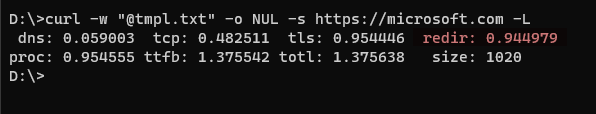
工具箱再添順手工具一把。
Recommend
About Joyk
Aggregate valuable and interesting links.
Joyk means Joy of geeK