
6

ELKStack实战六——Java日志和Nginx访问日志收集
source link: https://chegva.com/1807.html
Go to the source link to view the article. You can view the picture content, updated content and better typesetting reading experience. If the link is broken, please click the button below to view the snapshot at that time.

ELKStack实战六——Java日志和Nginx访问日志收集
1. 收集java日志
1.1 logstash-type-if判断使用
#通过type字段来做if判断,不同日志写入不同的索引
[root@linux-node1 ~]# cat /etc/logstash/conf.d/file.conf
input{
    file{
    path => ["/var/log/messages","/var/log/secure"]
    type => "system-log"
    start_position => "beginning"
    }
    file{
    path => "/var/log/elasticsearch/myes.log"
    type => "es-log"
    start_position => "beginning"
    codec => multiline{
      pattern => "^\["
      negate => true
      what => "previous"
    }
    }

}

filter{

}

output{
  if [type] == "system-log" {
    elasticsearch {
        hosts => ["192.168.56.11:9200"]
        index => "system-log-%{+YYYY.MM}"
    }
  }
  if [type] == "es-log" {
    elasticsearch {
        hosts => ["192.168.56.11:9200"]
        index => "es-log-%{+YYYY.MM}"
    }
  }
}

[root@linux-node1 ~]# /opt/logstash/bin/logstash -f /etc/logstash/conf.d/file.conf
Settings: Default pipeline workers: 2
Pipeline main started
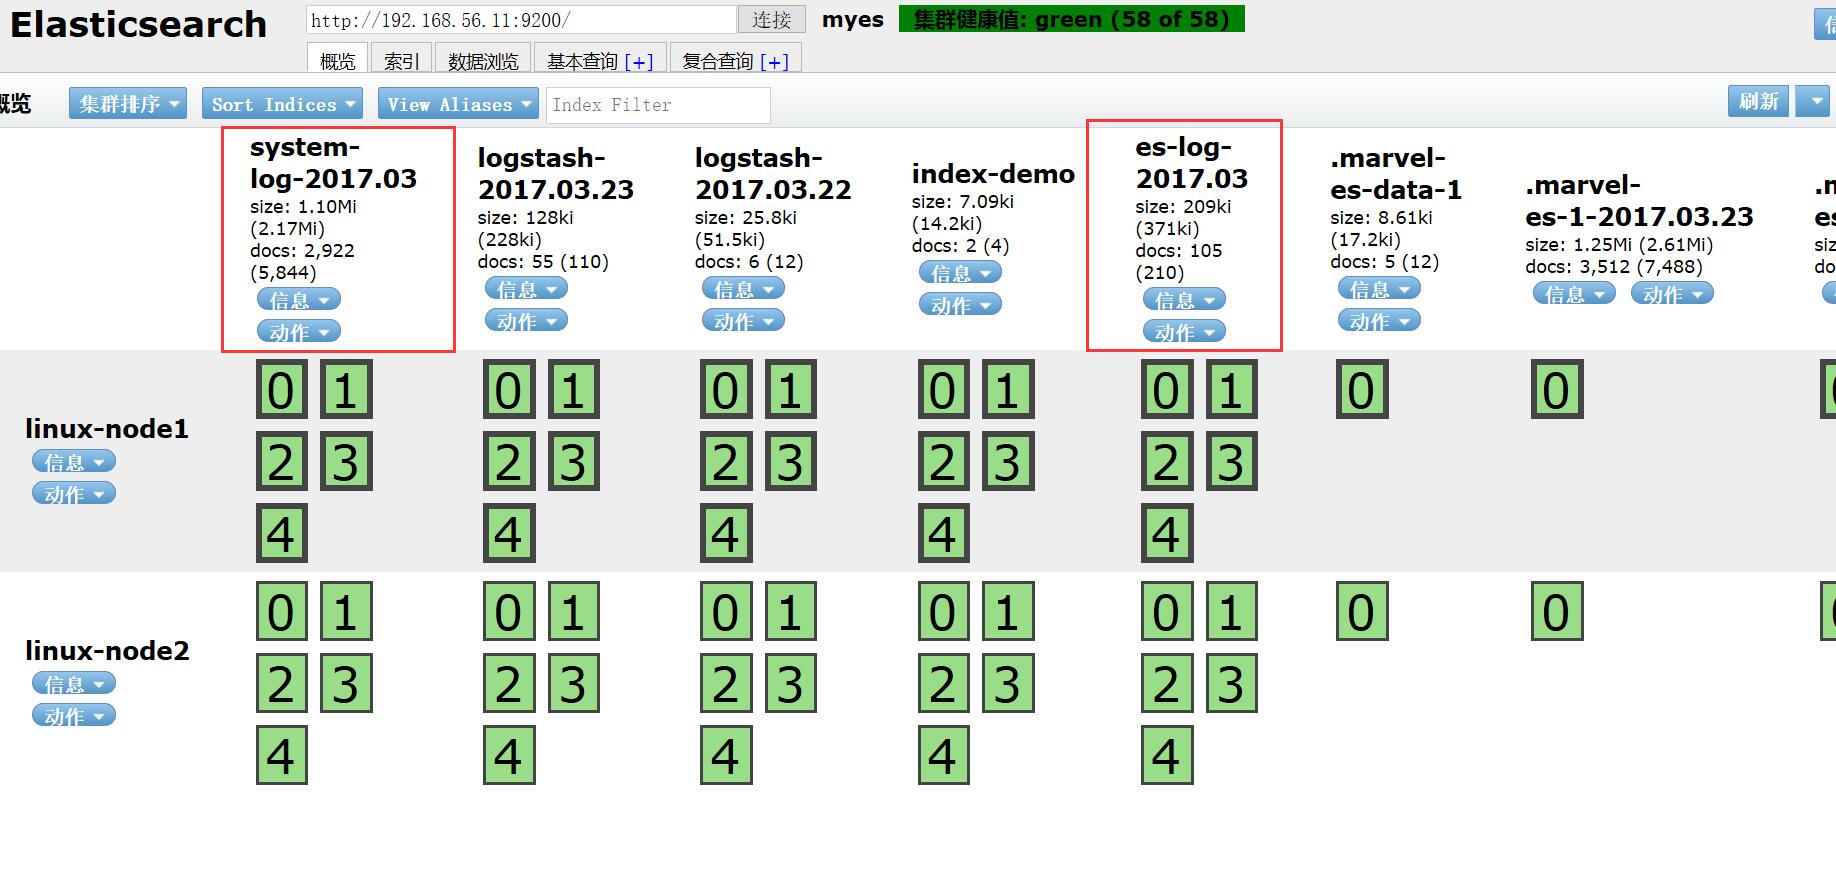
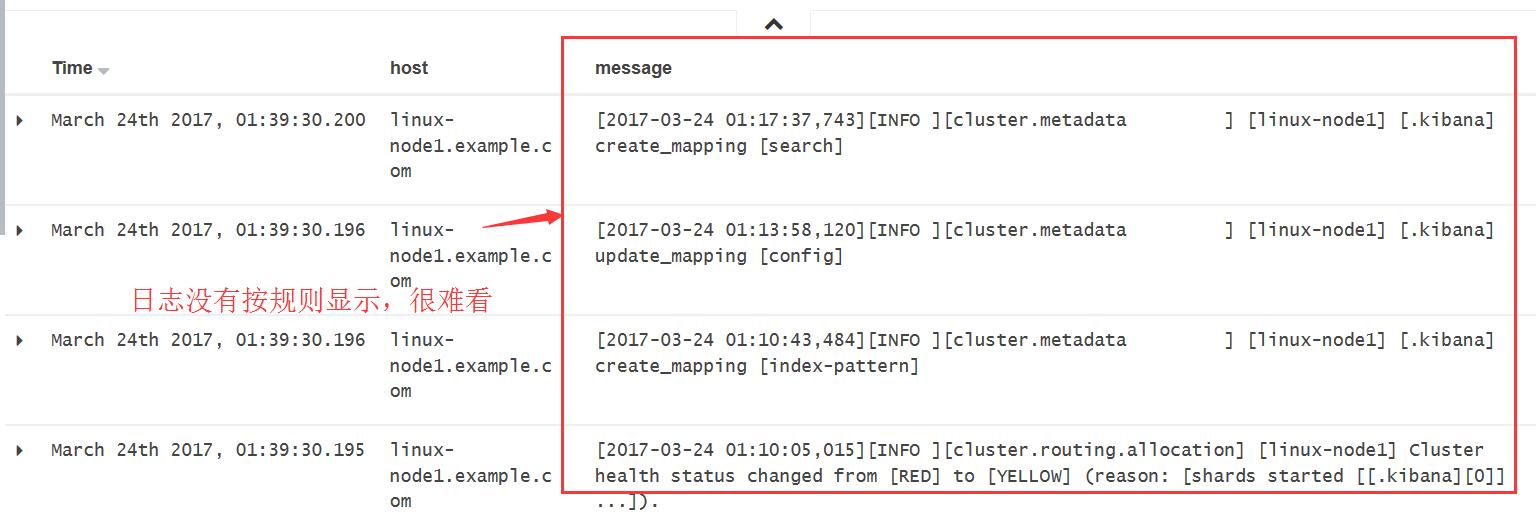
1.2 查看结果
然而,Java日志显示格式很难看
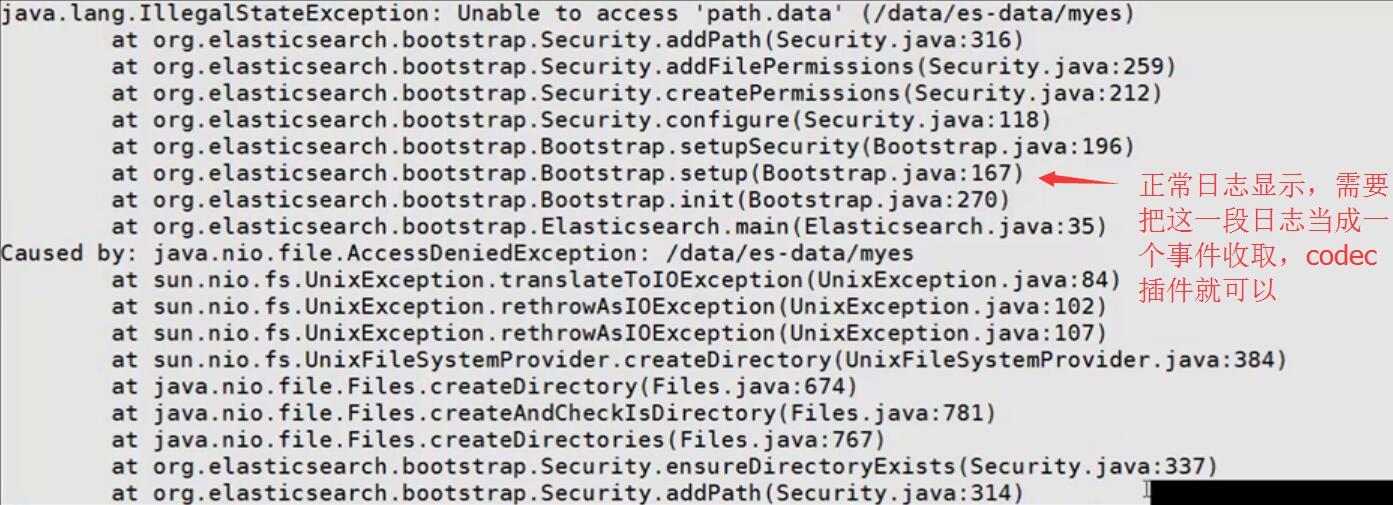
1.3 使用codec插件定义事件
[root@linux-node1 ~]# cat /etc/logstash/conf.d/codec.conf
input{
    stdin {
    codec => multiline{
      pattern => "^\["  #只要遇到[就当前一个新的事件
      negate => true
      what => "previous"
    }
    }
}

filter{
}

output{
    stdout{
        codec => rubydebug
    }
}


[root@linux-node1 ~]# /opt/logstash/bin/logstash -f /etc/logstash/conf.d/codec.conf
Settings: Default pipeline workers: 2
Pipeline main started
[fdfd
[fdf
{
    "@timestamp" => "2017-03-23T18:05:24.082Z",
       "message" => "[fdfd",
      "@version" => "1",
          "host" => "linux-node1.example.com"
}
dfdfdfd
fdfddellfd
[
{
    "@timestamp" => "2017-03-23T18:05:40.345Z",
       "message" => "[fdf\ndfdfdfd\nfdfddellfd",
      "@version" => "1",
          "tags" => [
        [0] "multiline"
    ],
          "host" => "linux-node1.example.com"
}
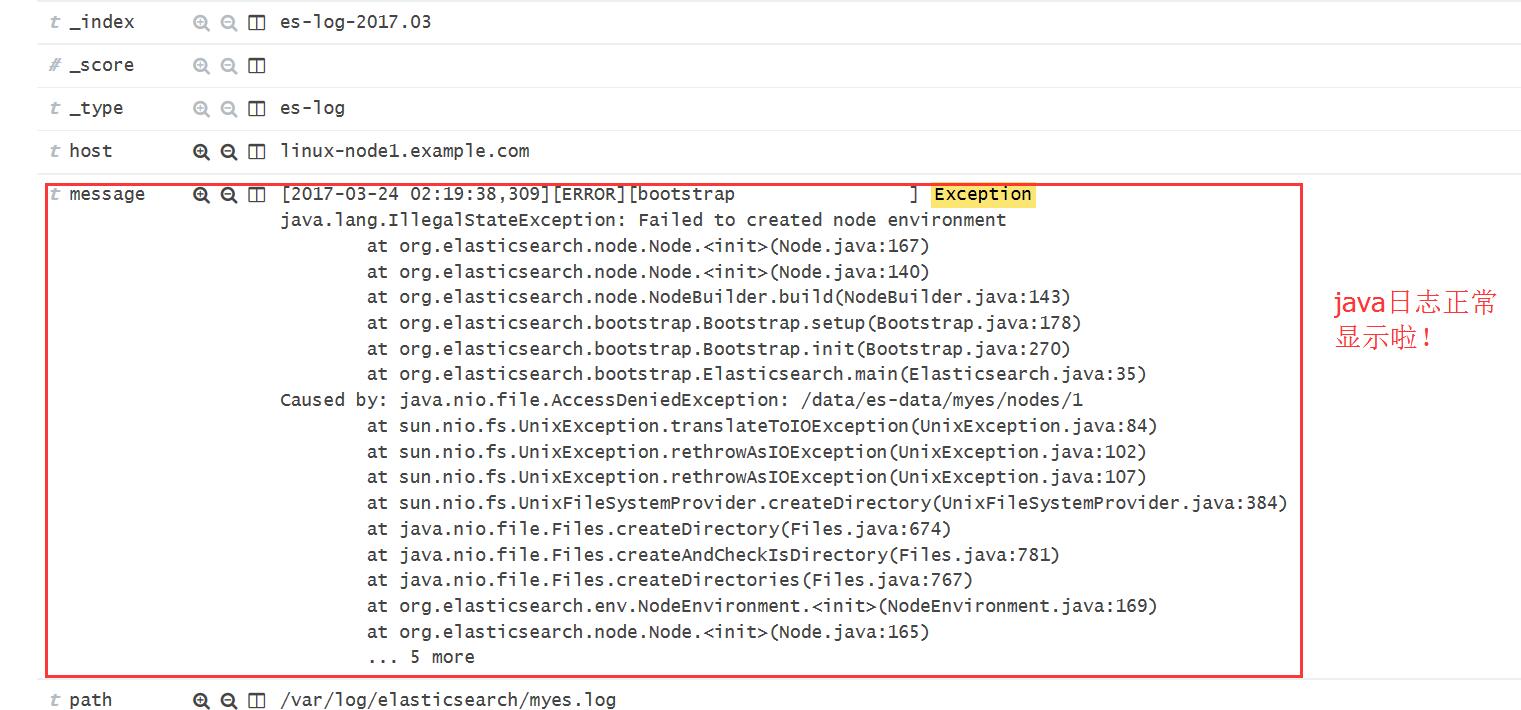
1.4 Kibana显示Java日志
#修改file.conf
[root@linux-node1 ~]# vi /etc/logstash/conf.d/file.conf
input{
    file{
        path => ["/var/log/messages","/var/log/secure"]
        type => "system-log"
        start_position => "beginning"
    }
    file{
        path => "/var/log/elasticsearch/myes.log"
        type => "es-log"
        start_position => "beginning"
        codec => multiline{
          pattern => "^\["
          negate => true
          what => "previous"
        }
    }

}

[root@linux-node1 ~]# ls -a .sin*
.sincedb_1fb922e15ccea4ac0d028d33639ba3ea  .sincedb_a9b9fed7edff6fd888ffe131a05b5397
[root@linux-node1 ~]# cat .sincedb_1fb922e15ccea4ac0d028d33639ba3ea
793841 0 64768 298751
793842 0 64768 3298
[root@linux-node1 ~]# ls -li /var/log/messages
793841 -rw------- 1 root root 302244 Mar 24 02:10 /var/log/messages

#在es上把es-log索引删除,重新收集
[root@linux-node1 ~]# /opt/logstash/bin/logstash -f /etc/logstash/conf.d/file.conf
1.5 查看效果
2. 收集nginx访问日志
2.1 修改nginx访问日志输出格式为json格式
[root@linux-node2 ~]# cat /usr/local/nginx/conf/nginx.conf
log_format  access_log_json  '{"user_ip":"$http_x_real_ip","lan_ip":"$remote_addr","log_time":"$time_iso8601","user_req":"$request","http_code":"$status","body_bytes_sent":"$body_bytes_sent","req_time":"$request_time","user_ua":"$http_user_agent"}';
[root@linux-node2 nginx]# systemctl start nginx
#测试,1000次连接,1个并发
[root@linux-node2 nginx]# ab -n 1000 -c 1 http://192.168.56.12:8080/
2.2 查看nginx日志输出格式
[root@linux-node2 ~]# tail -5 /var/log/nginx/access_log_json.log
{"user_ip":"-","lan_ip":"192.168.56.12","log_time":"2017-03-24T02:44:19+08:00","user_req":"GET / HTTP/1.0","http_code":"200","body_bytes_sent":"631","req_time":"0.000","user_ua":"ApacheBench/2.3"}
{"user_ip":"-","lan_ip":"192.168.56.12","log_time":"2017-03-24T02:44:19+08:00","user_req":"GET / HTTP/1.0","http_code":"200","body_bytes_sent":"631","req_time":"0.000","user_ua":"ApacheBench/2.3"}
{"user_ip":"-","lan_ip":"192.168.56.12","log_time":"2017-03-24T02:44:19+08:00","user_req":"GET / HTTP/1.0","http_code":"200","body_bytes_sent":"631","req_time":"0.000","user_ua":"ApacheBench/2.3"}
{"user_ip":"-","lan_ip":"192.168.56.12","log_time":"2017-03-24T02:44:19+08:00","user_req":"GET / HTTP/1.0","http_code":"200","body_bytes_sent":"631","req_time":"0.001","user_ua":"ApacheBench/2.3"}
{"user_ip":"-","lan_ip":"192.168.56.12","log_time":"2017-03-24T02:44:19+08:00","user_req":"GET / HTTP/1.0","http_code":"200","body_bytes_sent":"631","req_time":"0.001","user_ua":"ApacheBench/2.3"}
2.3 编辑收集nginx访问日志logstash配置文件
[root@linux-node2 conf.d]# cat nginx.conf
input{
    file {
    path => "/var/log/nginx/access_log_json.log"
    codec => "json"
        type => "nginx-access-log"
    }
}

filter{
}

output{
#    stdout{
#     codec => rubydebug
#   }
     elasticsearch {
        hosts => ["192.168.56.11:9200"]
    index => "nginx-access-log-%{+YYYY.MM.dd}"
    }
}
#启动logstash收集nginx访问日志
[root@linux-node2 conf.d]# /etc/init.d/logstash start
logstash is already running

#logstash会根据文件inode记录去找相应日志文件
[root@linux-node2 logstash]# cat /var/lib/logstash/.sincedb_79929b4271e205874b942fde4119e723
0 0 0 0
71850698 0 64768 197000
[root@linux-node2 logstash]# ls -li /var/log/nginx/access_log_json.log
71850698 -rw-r--r-- 1 root root 197000 Mar 24 02:44 /var/log/nginx/access_log_json.log
2.4 查看结果

2.5 Kibana简单查询使用示例
Examples:
Find requests that contain the number 200, in any field:

200

Or we can search in a specific field. Find 200 in the status field:

status:200

Find all status codes between 400-499:

status:[400 TO 499]

Find status codes 400-499 with the extension php:

status:[400 TO 499] AND extension:PHP

Or HTML

status:[400 TO 499] AND (extension:php OR extension:html)
安志合个人博客,版权所有 丨 如未注明,均为原创 丨 转载请注明转自:https://chegva.com/1807.html | ☆★★每天进步一点点,加油!★★☆ |
Recommend
About Joyk
Aggregate valuable and interesting links.
Joyk means Joy of geeK