

.NET程序的 GDI句柄泄露 的再反思
source link: https://www.cnblogs.com/huangxincheng/p/17579180.html
Go to the source link to view the article. You can view the picture content, updated content and better typesetting reading experience. If the link is broken, please click the button below to view the snapshot at that time.

1. 讲故事
上个月我写过一篇 如何洞察 C# 程序的 GDI 句柄泄露 文章,当时用的是 GDIView + WinDbg 把问题搞定,前者用来定位泄露资源,后者用来定位泄露代码,后面有朋友反馈两个问题:
- GDIView 统计不准怎么办?
- 我只有 Dump 可以统计吗?
其实那篇文章也聊过,在 x64 或者 wow64 的程序里,在用户态内存段中有一个 GDI Shared Handle Table 句柄表,这个表中就统计了各自句柄类型的数量,如果能统计出来也就回答了上面的问题,对吧。
32bit 程序的
GDI Shared Handle Table段是没有的,即_PEB.GdiSharedHandleTable = NULL。0:002> dt ntdll!_PEB GdiSharedHandleTable 01051000 +0x0f8 GdiSharedHandleTable : (null)
有了这些前置基础,接下来就可以开挖了。
二:挖 GdiSharedHandleTable
1. 测试代码
为了方便测试,我来造一个 DC句柄 的泄露。
    internal class Program
    {

        [DllImport("Example_20_1_5", CallingConvention = CallingConvention.Cdecl)]
        extern static void GDILeak();

        static void Main(string[] args)
        {
            try
            {
                GDILeak();
            }
            catch (Exception ex)
            {
                Console.WriteLine(ex.Message);
            }

            Console.ReadLine();
        }
    }
然后就是 GDILeak 的 C++ 实现代码。
extern "C"
{
	_declspec(dllexport) void GDILeak();
}

void GDILeak()
{
    while (true)
    {
        CreateDCW(L"DISPLAY", nullptr, nullptr, nullptr);

        auto const gdiObjectsCount = GetGuiResources(GetCurrentProcess(), GR_GDIOBJECTS);
        std::cout << "GDI objects: " << gdiObjectsCount << std::endl;

        Sleep(10);
    }
}
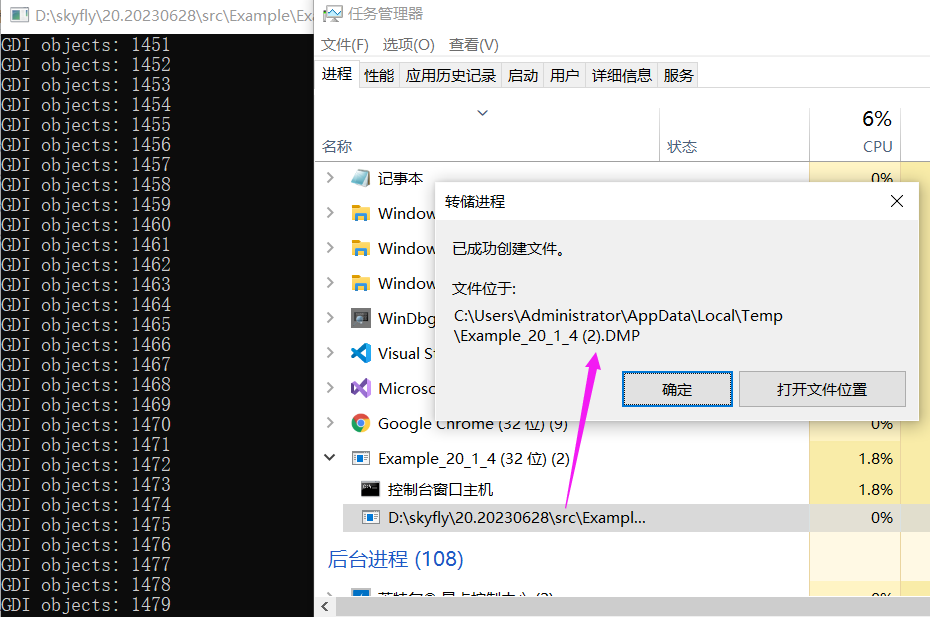
程序跑起来后,如果你是x64的程序那没有关系,但如果你是 32bit 的程序一定要生成一个 Wow64 格式的 Dump,千万不要抓它的 32bit dump,否则拿不到 GdiSharedHandleTable 字段也就无法后续分析了,那如何生成 Wow64 格式的呢?我推荐两种方式。
-
使用64bit任务管理器(系统默认)生成
-
使用 procdump -64 -ma QQ.exe 中的 -64 参数
这里我们采用第一种方式,截图如下:
2. 分析 GdiSharedHandleTable
使用伪寄存器变量提取出 GdiSharedHandleTable 字段,输出如下:
0:000> dt ntdll!_PEB GdiSharedHandleTable @$peb
   +0x0f8 GdiSharedHandleTable : 0x00000000`03560000 Void
接下来使用 !address 找到这个 GdiSharedHandleTable 的首末地址。
0:000> !address 0x00000000`03560000

Usage:                  Other
Base Address:           00000000`03560000
End Address:            00000000`036e1000
Region Size:            00000000`00181000 (   1.504 MB)
State:                  00001000          MEM_COMMIT
Protect:                00000002          PAGE_READONLY
Type:                   00040000          MEM_MAPPED
Allocation Base:        00000000`03560000
Allocation Protect:     00000002          PAGE_READONLY
Additional info:        GDI Shared Handle Table


Content source: 1 (target), length: 181000
上一篇我们聊过每新增一个GDI句柄都会在这个表中增加一条 GDICell,输出如下:
typedef struct {
	PVOID64 pKernelAddress;
	USHORT wProcessId;
	USHORT wCount;
	USHORT wUpper;
	USHORT wType;
	PVOID64 pUserAddress;
} GDICell;
这个 GDICell 有两个信息比较重要。
wProcessId表示进程 IDwType表示句柄类型。
理想情况下是对 句柄类型 进行分组统计就能知道是哪里的泄露,接下来的问题是如何找呢?可以仔细观察结构体, wProcessId 和 wType 的偏移是 3USHORT=6byte,我们在内存中找相对偏移不就可以了吗?接下来在内存中搜索这块
0:000> ~.
.  0  Id: 101c.4310 Suspend: 0 Teb: 00000000`009bf000 Unfrozen
      Start: Example_20_1_4_exe!wmainCRTStartup (00000000`00d4ffe0)
      Priority: 0  Priority class: 32  Affinity: fff

0:000> s-w 03560000 036e1000 101c
00000000`03562060  101c 0000 af01 0401 0b00 0830 0000 0000  ..........0.....
00000000`035782a0  101c ff1d ffff ffff 0000 0000 1d0f 010f  ................
00000000`0357c688  101c 0000 3401 0401 0160 0847 0000 0000  .....4..`.G.....
...
00000000`035a5f98  101c 0000 0801 0401 0dc0 08a1 0000 0000  ................
00000000`035a5fb0  101c 0000 0801 0401 0c60 08a1 0000 0000  ........`.......
00000000`035a5fc8  101c 0000 0801 0401 0840 08a1 0000 0000  ........@.......
00000000`035a5fe0  101c 0000 0801 0401 0b00 08a1 0000 0000  ................
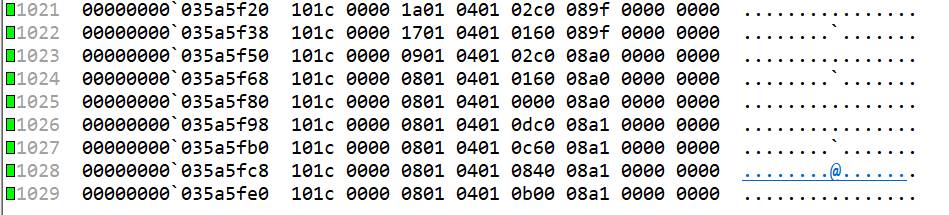
从卦中可以看到,当前有1029个 GDICell 结构体,接下来怎么鉴别每一条记录上都是什么类型呢?其实这里是有枚举的。
- DC = 0x01
- Region = 0x04
- Bitmap = 0x05
- Palette =0x08
- Font =0x0a
- Brush = 0x10
- Pen = 0x30
即 GDIView 中的 红色一列 。

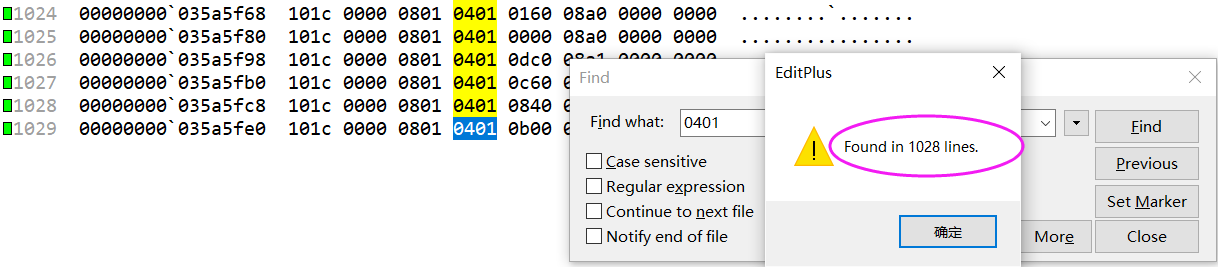
到这里我们可以通过肉眼观察 + F5 检索,可以清晰的看到1029 个句柄对象,其中 1028 个是 DC 对象,其实这就是我们泄露的,截图如下:
3. 脚本处理
如果大家通读会发现这些都是固定步骤,完全可以写成比如 C++ 和 Javascript 的格式脚本,在 StackOverflow 上还真有这样的脚本。
$$ Run as: $$>a<DumpGdi.txt
$$ Written by Alois Kraus 2016
$$ uses pseudo registers r0-5 and r8-r14

r @$t1=0
r @$t8=0
r @$t9=0
r @$t10=0
r @$t11=0
r @$t12=0
r @$t13=0
r @$t14=0
$$ Increment count is 1 byte until we find a matching field with the current pid
r @$t4=1

r @$t0=$peb
$$ Get address of GDI handle table into t5
.foreach /pS 3 /ps 1 ( @$GdiSharedHandleTable { dt ntdll!_PEB GdiSharedHandleTable @$t0 } ) { r @$t5 = @$GdiSharedHandleTable }

$$ On first call !address produces more output. Do a warmup
.foreach /pS 50 ( @$myStartAddress {!address  @$t5} ) {  }


$$ Get start address of file mapping into t2
.foreach /pS 4 /ps 40 ( @$myStartAddress {!address  @$t5} ) { r @$t2 = @$myStartAddress }
$$ Get end address of file mapping into t3
.foreach /pS 7 /ps 40 ( @$myEndAddress {!address  @$t5} ) { r @$t3 = @$myEndAddress }
.printf "GDI Handle Table %p %p", @$t2, @$t3

.for(; @$t2 < @$t3; r @$t2 = @$t2 + @$t4)
{
  $$ since we walk bytewise through potentially invalid memory we need first to check if it points to valid memory
  .if($vvalid(@$t2,4) == 1 )
  {
     $$ Check if pid matches
     .if (wo(@$t2) == @$tpid )
     {
        $$ increase handle count stored in $t1 and increase step size by 0x18 because we know the cell structure GDICell has a size of 0x18 bytes.
        r @$t1 = @$t1+1
        r @$t4 = 0x18
        $$ Access wType of GDICELL and increment per GDI handle type
        .if (by(@$t2+6) == 0x1 )  { r @$t8 =  @$t8+1  }
        .if (by(@$t2+6) == 0x4 )  { r @$t9 =  @$t9+1  }
        .if (by(@$t2+6) == 0x5 )  { r @$t10 = @$t10+1 }
        .if (by(@$t2+6) == 0x8 )  { r @$t11 = @$t11+1 }
        .if (by(@$t2+6) == 0xa )  { r @$t12 = @$t12+1 }
        .if (by(@$t2+6) == 0x10 ) { r @$t13 = @$t13+1 }
        .if (by(@$t2+6) == 0x30 ) { r @$t14 = @$t14+1 }
     }
  }
}

.printf "\nGDI Handle Count      %d", @$t1
.printf "\n\tDeviceContexts: %d", @$t8
.printf "\n\tRegions:        %d", @$t9
.printf "\n\tBitmaps:        %d", @$t10
.printf "\n\tPalettes:       %d", @$t11
.printf "\n\tFonts:          %d", @$t12
.printf "\n\tBrushes:        %d", @$t13
.printf "\n\tPens:           %d", @$t14
.printf "\n\tUncategorized:  %d\n", @$t1-(@$t14+@$t13+@$t12+@$t11+@$t10+@$t9+@$t8)
最后我们用脚本跑一下,哈哈,是不是非常清楚。
0:000> $$>a< "D:\testdump\DumpGdi.txt"
GDI Handle Table 0000000003560000 00000000036e1000
GDI Handle Count      1028
	DeviceContexts: 1028
	Regions:        0
	Bitmaps:        0
	Palettes:       0
	Fonts:          0
	Brushes:        0
	Pens:           0
	Uncategorized:  0
如果大家想从 DUMP 文件中提取 GDI 句柄泄露类型,这是一篇很好的参考资料,相信能从另一个角度给你提供一些灵感。

Recommend
About Joyk
Aggregate valuable and interesting links.
Joyk means Joy of geeK