

How to detect memory leaks in C++ programs on macOS
source link: https://yrom.net/blog/2023/07/03/detect-memory-leaks-of-cpp-program-on-macos/
Go to the source link to view the article. You can view the picture content, updated content and better typesetting reading experience. If the link is broken, please click the button below to view the snapshot at that time.
How to detect memory leaks in C++ programs on macOS
一段很典型的内存泄漏C++ 代码如下:
int main(int argc, const char **argv)
{
    auto *p = new int(10);
    // other codes ...
    p = nullptr; // leaked
    // ...
    return 0;
}
如何在庞大的 C++ 项目代码中找出类似的问题呢?
libgmalloc
苹果提供了内存调试功能:Guard Malloc,用于debug 内存问题。 man libgmalloc 可以查看更多使用信息。
开启libgmalloc的记录 malloc 调用日志的功能,在执行程序前设置环境变量MallocStackLogging=1,如:
MallocStackLogging=1 ./my_tool
日志会写到一个临时文件中:
my_tool(38364) MallocStackLogging: stack logs being written to /private/tmp/stack-logs.38364.103f3a000.my_tool.19n2JH.index
my_tool(38364) MallocStackLogging: recording malloc and VM allocation stacks to disk using standard recorder
需要注意的是,在程序退出时,这个调用日志文件会被自动删除:
my_tool(38364) MallocStackLogging: stack logs deleted from /private/tmp/stack-logs.38364.103f3a000.my_tool.19n2JH.index
所以需要将程序在结束时最好 block 住,以便分析日志文件:
#include <iostream>
static void wait_for_input()
{
    std::cout << "Press Enter to exit." << std::endl;
    char b[1];
    std::cin.read(b, 1);
}
int main(int argc, const char **argv)
{
    auto *p = new int(10);
    // other codes ...
    p = nullptr; // leaked
    // ...

// blocking program for analyzing malloc stack history
    wait_for_input();
    return 0;
}
The leaks Tools
另外,可以直接用 macOS 检测内存泄漏:/usr/bin/leaks (详见:the leaks Tool )
终端中执行 man leaks 查看使用手册。
leaks 使用方式很简单,指定 pid 即可 attach 到执行中的程序:
# pid=38364
leaks $pid --outputGraph=$pid.memgraph
# open memory graph file with Xcode
open $pid.memgraph
结合起来就是:
- 修改 C++ 程序 main 函数,使其在结束时 block,重编程序
- 设置环境变量
MallocStackLogging=1,执行程序。 - 在程序执行结束时,亦即 block 时,执行
leaks,保存 memory graph文件 ⌃+C结束程序- 使用
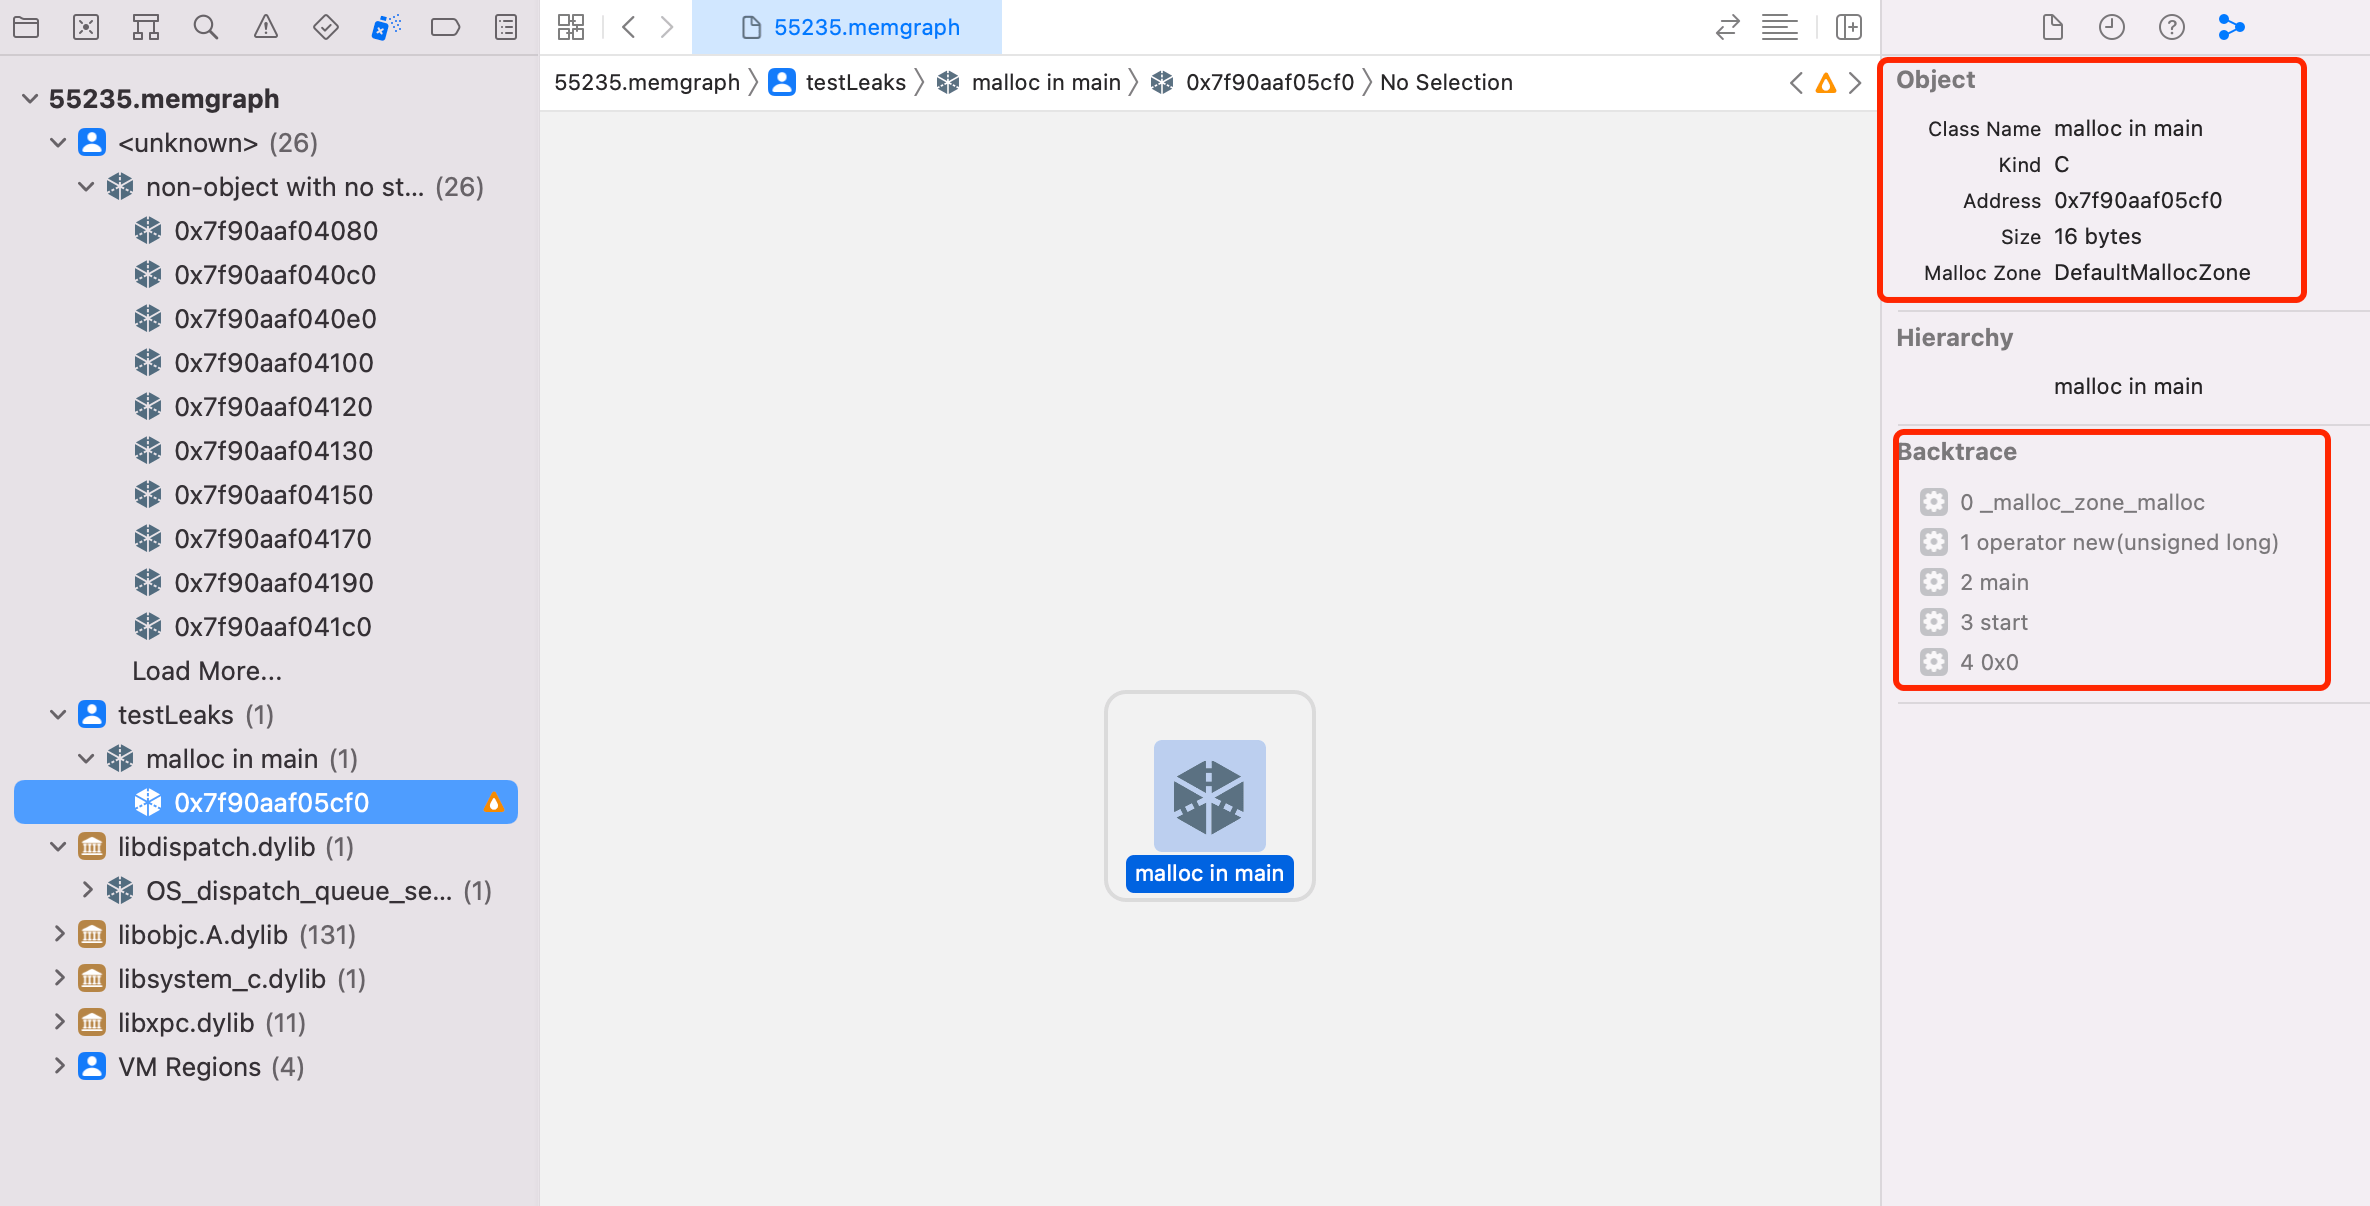
Xcode Memory Graph Debugger打开 memory graph文件,分析内存泄漏
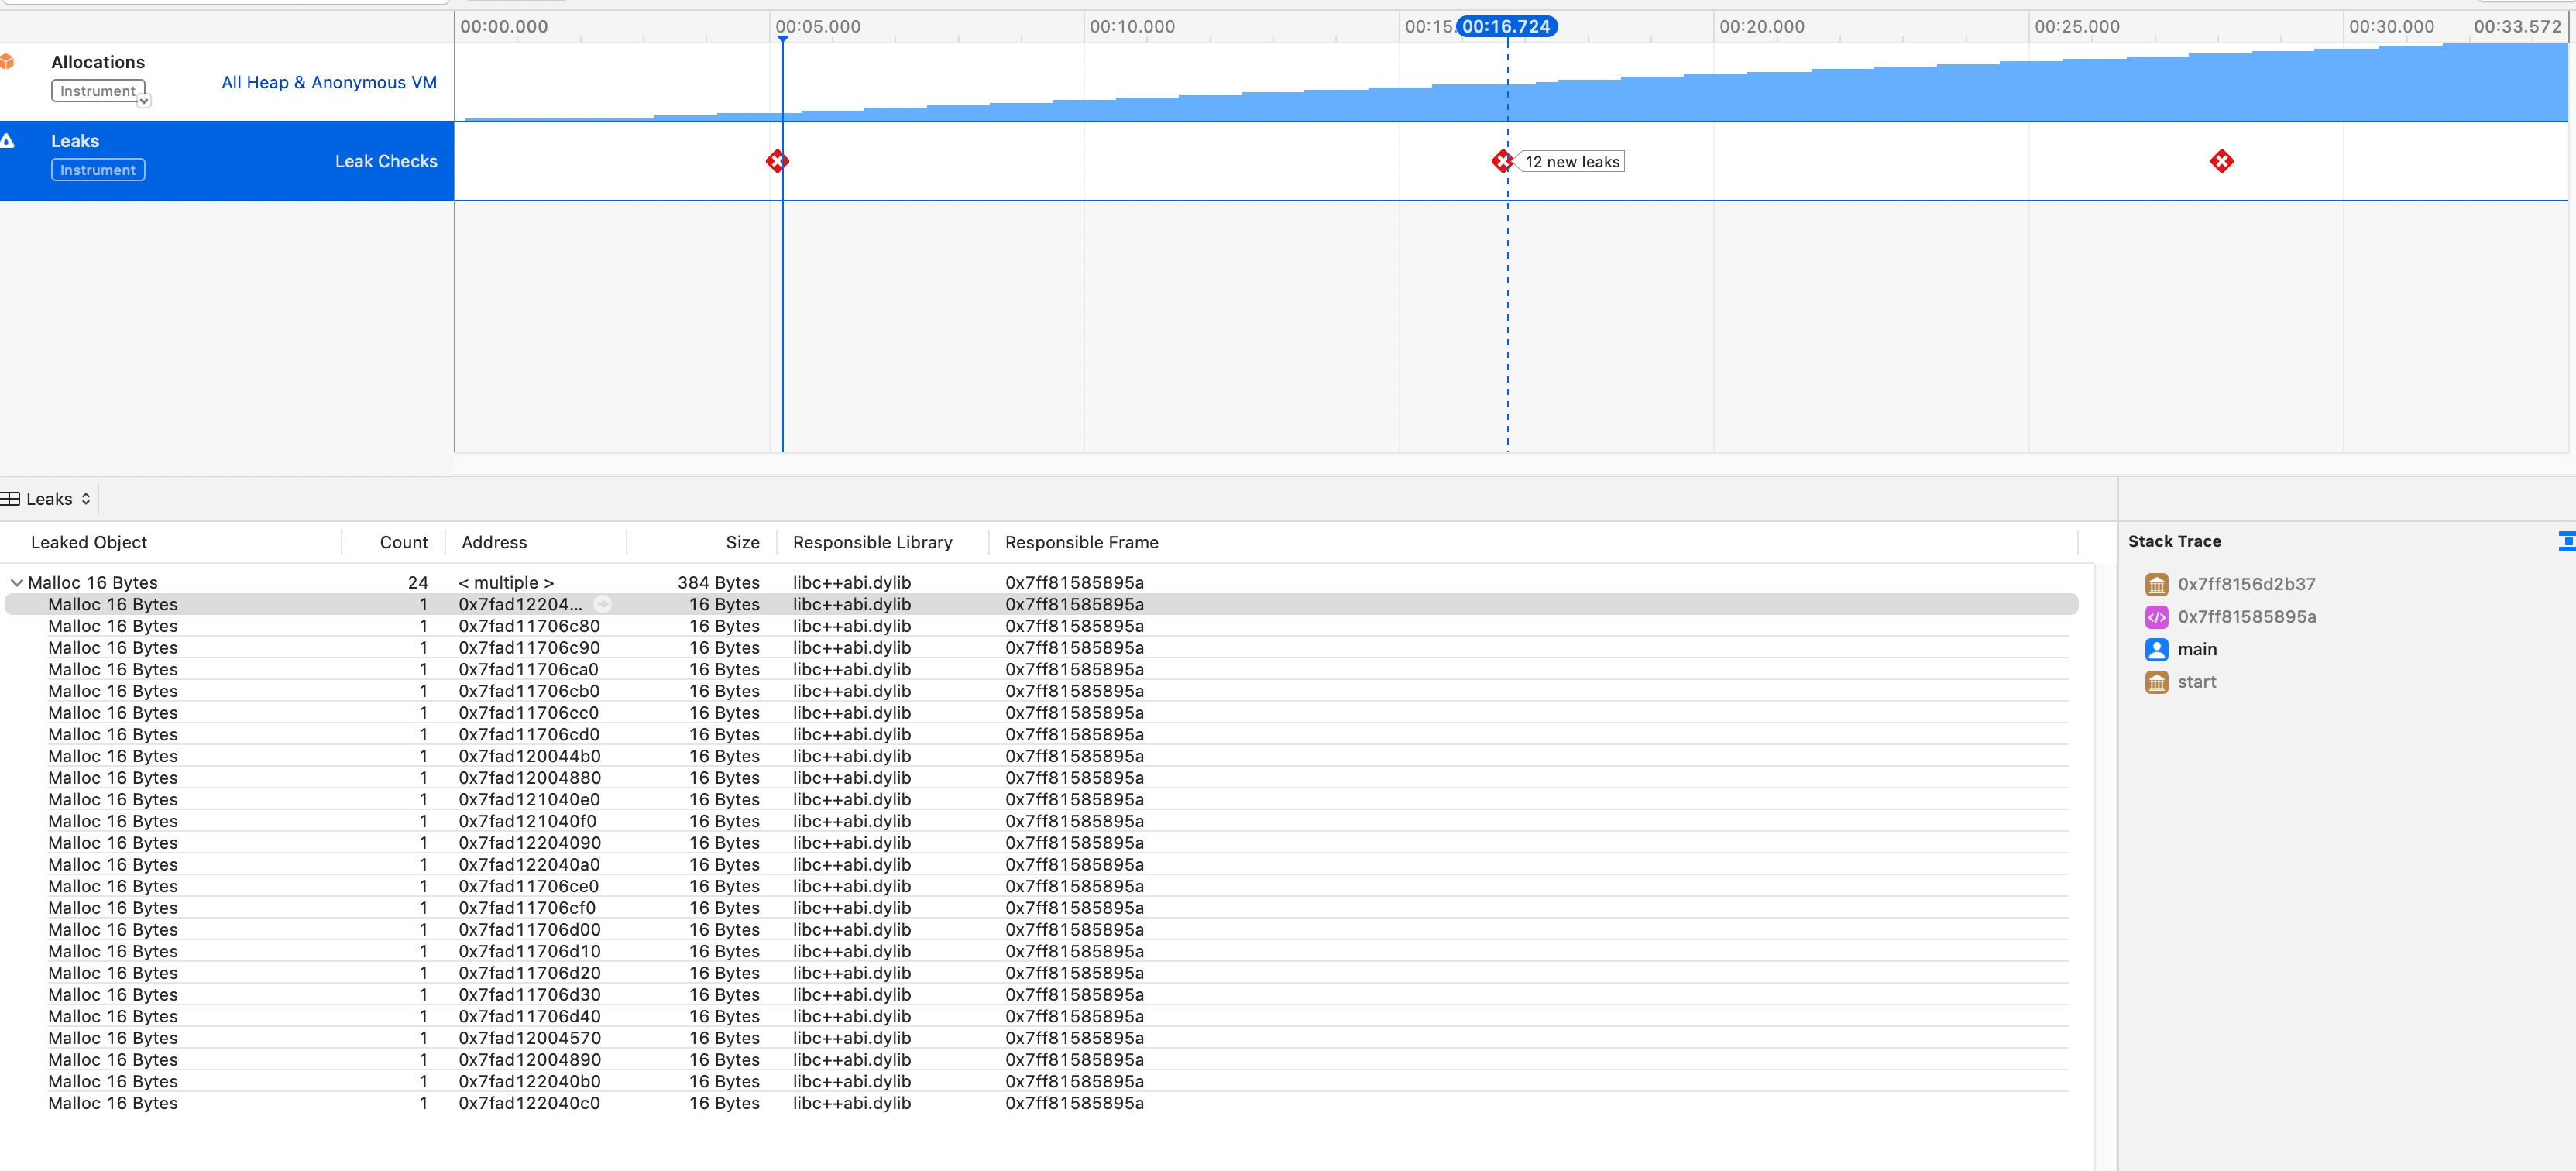
Xcode Instruments
另外一个内存检测工具是使用Xcode Instruments。
从命令行启动 Instruments, 并使用内置的 Leaks 模板:
xcrun xctrace record --template 'Leaks' --target-stdout - --launch -- ./my_tool
在程序退出时,自动保存trace文件:
Starting recording with the Leaks template. Launching process: my_tool.
Ctrl-C to stop the recording
Target app exited, ending recording…
Recording completed. Saving output file…
Output file saved as: Launch_my_tool_2023-07-03_15.21.06_AA4C3897.trace
需要注意的是,程序不能退出的太快,不然可能来不及注入分析工具就退出了╮(╯_╰)╭ :
Run issues were detected (trace is still ready to be viewed):
[Error] Failed to attach to target process
* [Error] Failed to execute loader thread for /Applications/Xcode.app/Contents/SharedFrameworks/DVTInstrumentsFoundation.framework/Resources/liboainject.dylib in target; target process 82675 likely exited
另外,Instruments 每 10 秒执行一次内存泄漏检测,所以程序执行时间最好大于 10 秒。
在 main 函数中添加一个 sleep 等待 attach,如:
#include <iostream>
#include <thread>
void wait_seconds(int seconds)
{
    std::this_thread::sleep_for(std::chrono::seconds(seconds));
}
int main(int argc, const char **argv)
{

std::cout << "Waiting a moment for Allocations instrument attached..." << std::endl;
    wait_seconds(3);
    for (size_t i = 0; i < 30; i++)
    {
        auto *p = new int(10);
        *p = (int)i;
        wait_seconds(1);
    }

return 0;
}
LSan (LeakSanitizer)
x86_64 的 macOS 可以使用LeakSanitizer (AddressSanitizer 内置的一个内存检测工具)。
clang++ -std=c++17 -fsanitize=address -g main.cc -o my_tool
ASAN_OPTIONS=detect_leaks=1 ./my_tool
但比较遗憾的是,Apple 的 Clang 阉割掉了 AddressSanitizer 的 LeakSanitizer,所以需要用 homebrew 安装 llvm 的 clang,详见: https://github.com/google/sanitizers/issues/1026#issuecomment-997350809
Recommend
About Joyk
Aggregate valuable and interesting links.
Joyk means Joy of geeK