

Getting started with Topology View in Cryostat 2.3
source link: https://developers.redhat.com/blog/2023/06/29/getting-started-topology-view-cryostat-23
Go to the source link to view the article. You can view the picture content, updated content and better typesetting reading experience. If the link is broken, please click the button below to view the snapshot at that time.
Getting started with Topology View in Cryostat 2.3 Skip to main content

Cryostat is a container-native JVM application that provides a secure API for profiling and monitoring containers with JDK Flight Recorder (JFR). With Cryostat 2.3, we introduce a brand new way to view and perform actions on target JVMs: Topology View.
Topology View provides a visual presentation of the all discovered JVMs and all their associated resources. It also allows users to perform actions on one or multiple targets.
Here are exciting things you can do with Topology View.
View all target JVMs
View all target JVMs
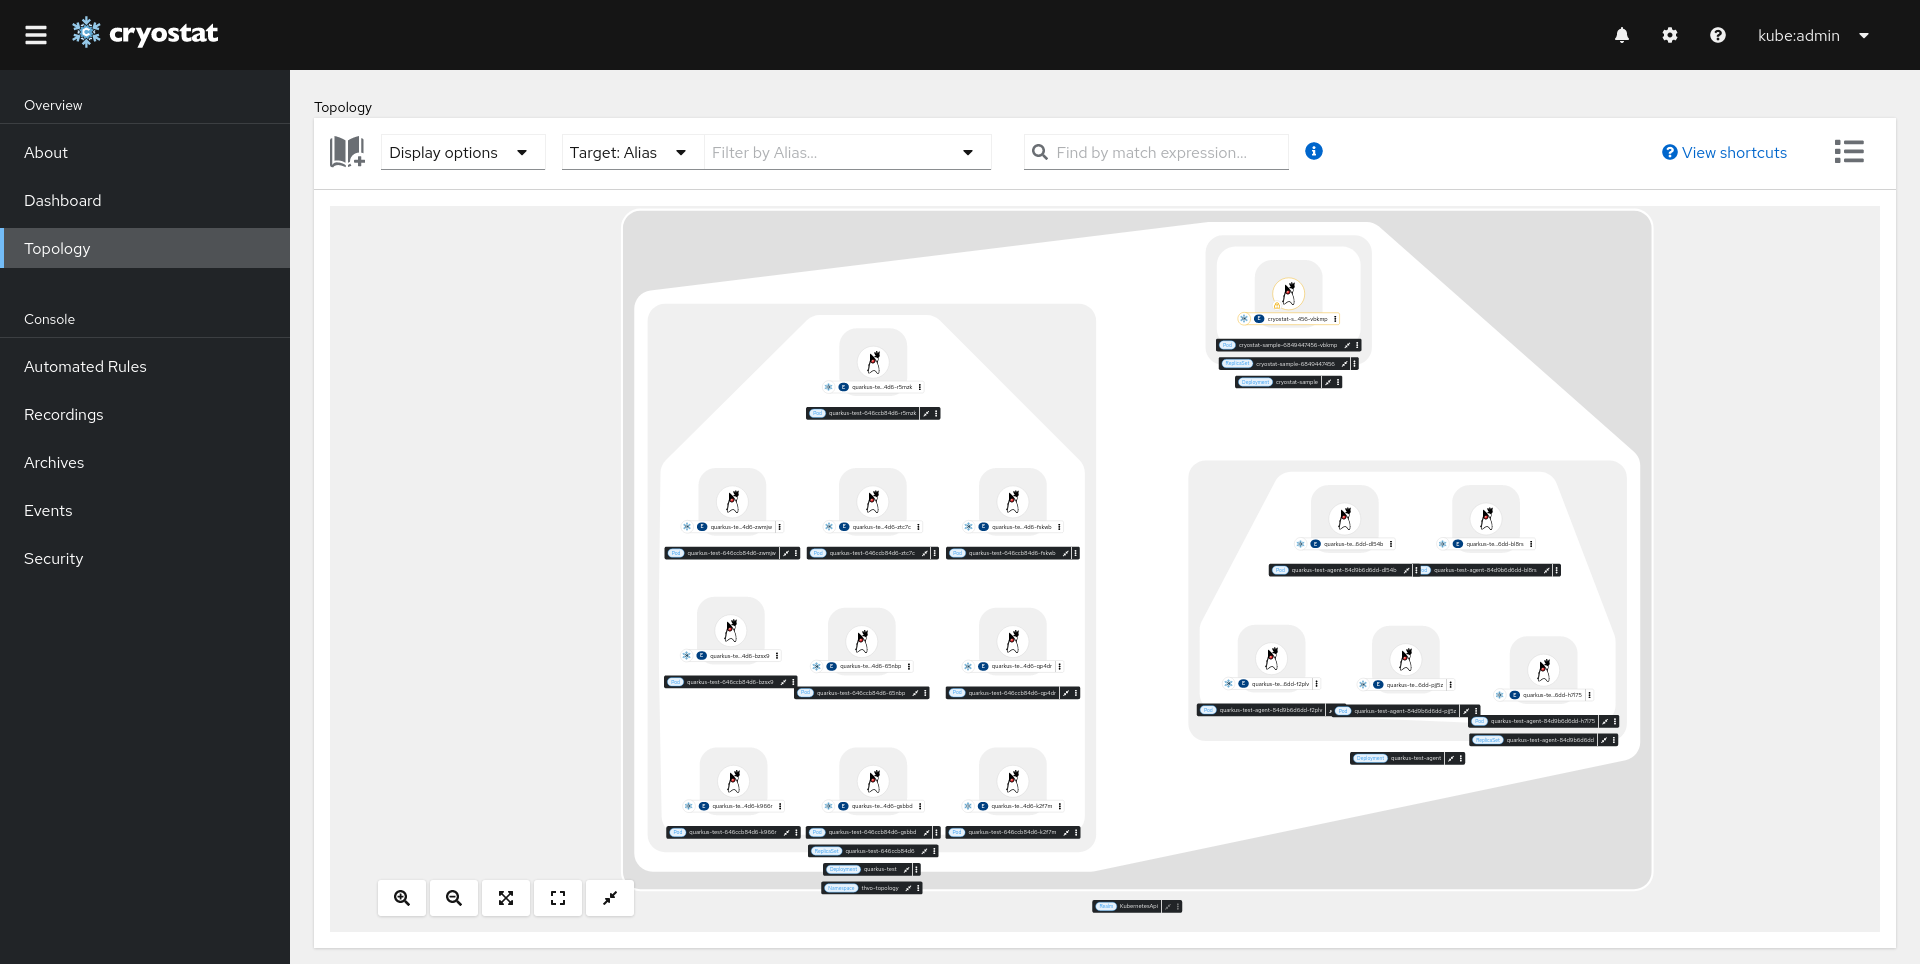
To see Topology View, navigate to the Topology tab. By default, an interactive Graph View of discovered target JVMs (nodes) are shown nested within their associated groups (surrounding lines), for example, Pod, or Deployment.
You can drag target nodes/groups or use the bottom control bar to adjust the graph view, for example, zoom out or fit all nodes into view. A toolbar is also available to allow further customization:
- Display Options: adjust how the nodes and groups are displayed, for example, whether to show connection URL.
- Filters: determine which targets or groups to show.
- Search bar: find a target using Match Expression. The matched targets will be highlighted.
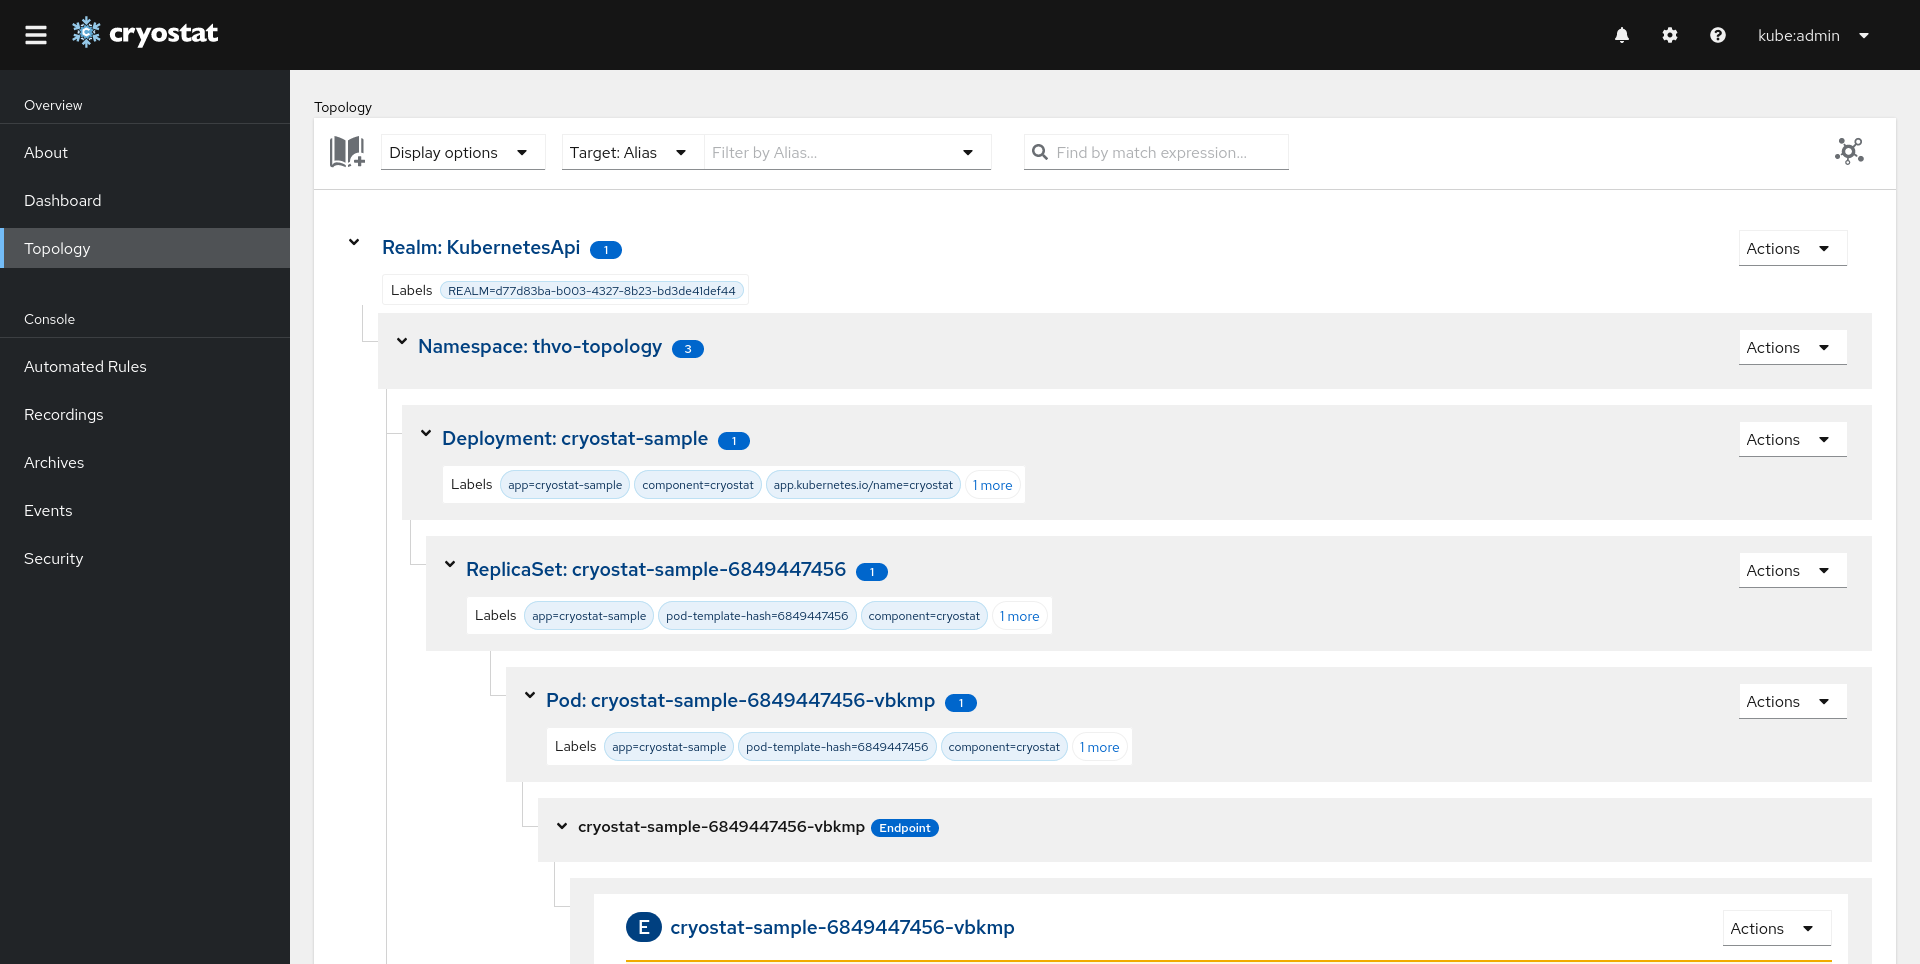
Topology View also supports List View mode, where your JVM targets and their groups are shown as expandable rows. Expand each row to see nested groups or targets. All the above features of the toolbar can also be used to customize your view.
View target details and their associated resources
View target details and their associated resources
Select a target JVM to open the drawer panel that shows its details, for example, connection URL, labels and annotations.

Navigate to the Resources tab to see the target’s associated resources. There are 2 tables:
- Owned Resources: Resources that the target owns (i.e. active/archived recordings, event templates and event types).
- Related Resources: Resources that are tied to the target by Match Expression (i.e. Automated Rules and Credentials).
In the Graph View, each target node also has an indicator that tells whether the target has any running Active Recordings. The same information can be seen within the Owned Resources table by expanding the Active Recordings row.

For List View, expand the Target row to see its details and associated resources.
Perform actions on an individual target JVM
Perform actions on an individual target JVM
The details panel for each target JVM supports performing simple actions on the JVM. Click the Actions menu to show available options.
For example, select View Recordings to be redirected to the Recordings view for the target JVM, where you can view and manage Active Recordings..

Perform actions on a group of target JVMs
Perform actions on a group of target JVMs
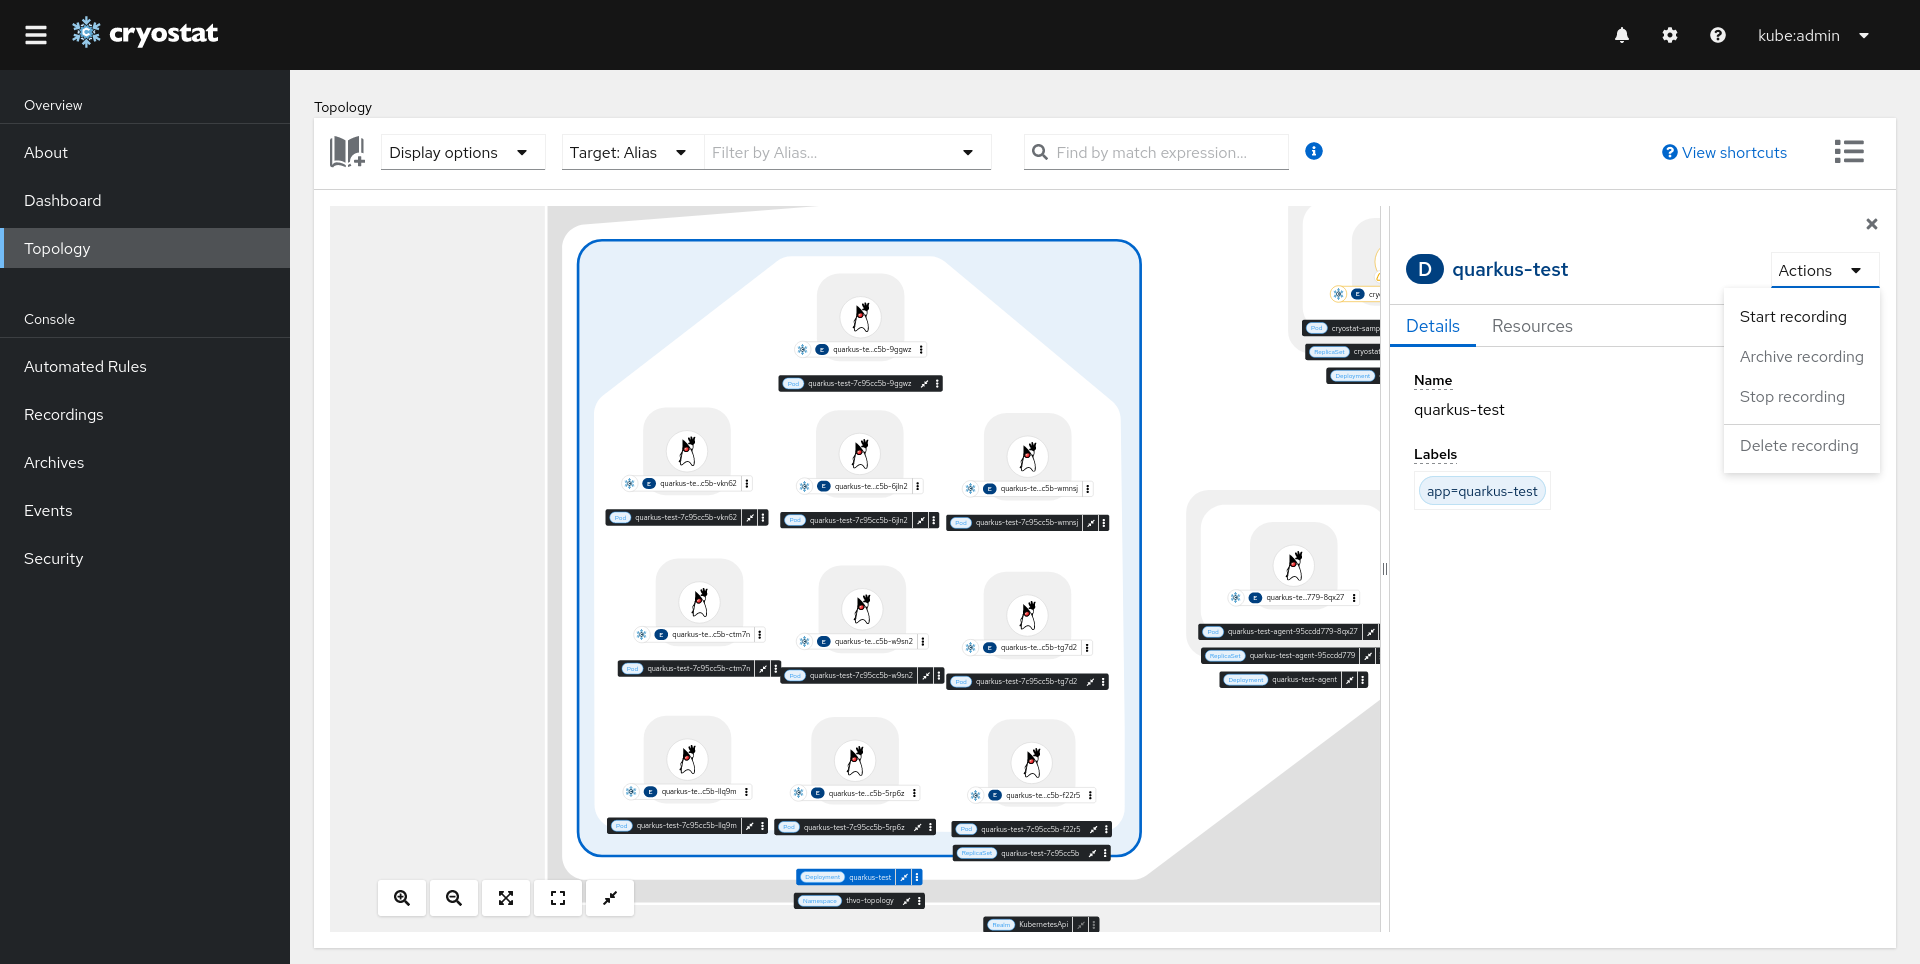
The details panel also supports performing actions on multiple target JVMs. Select a group of targets, for example, a Deployment. A drawer panel will appear to show the group details. Select Actions menu to show available options.
For example, select Start recording to start a recording on all target JVMs under this group.
Create Custom Target with Entity Catalog
Create Custom Target with Entity Catalog
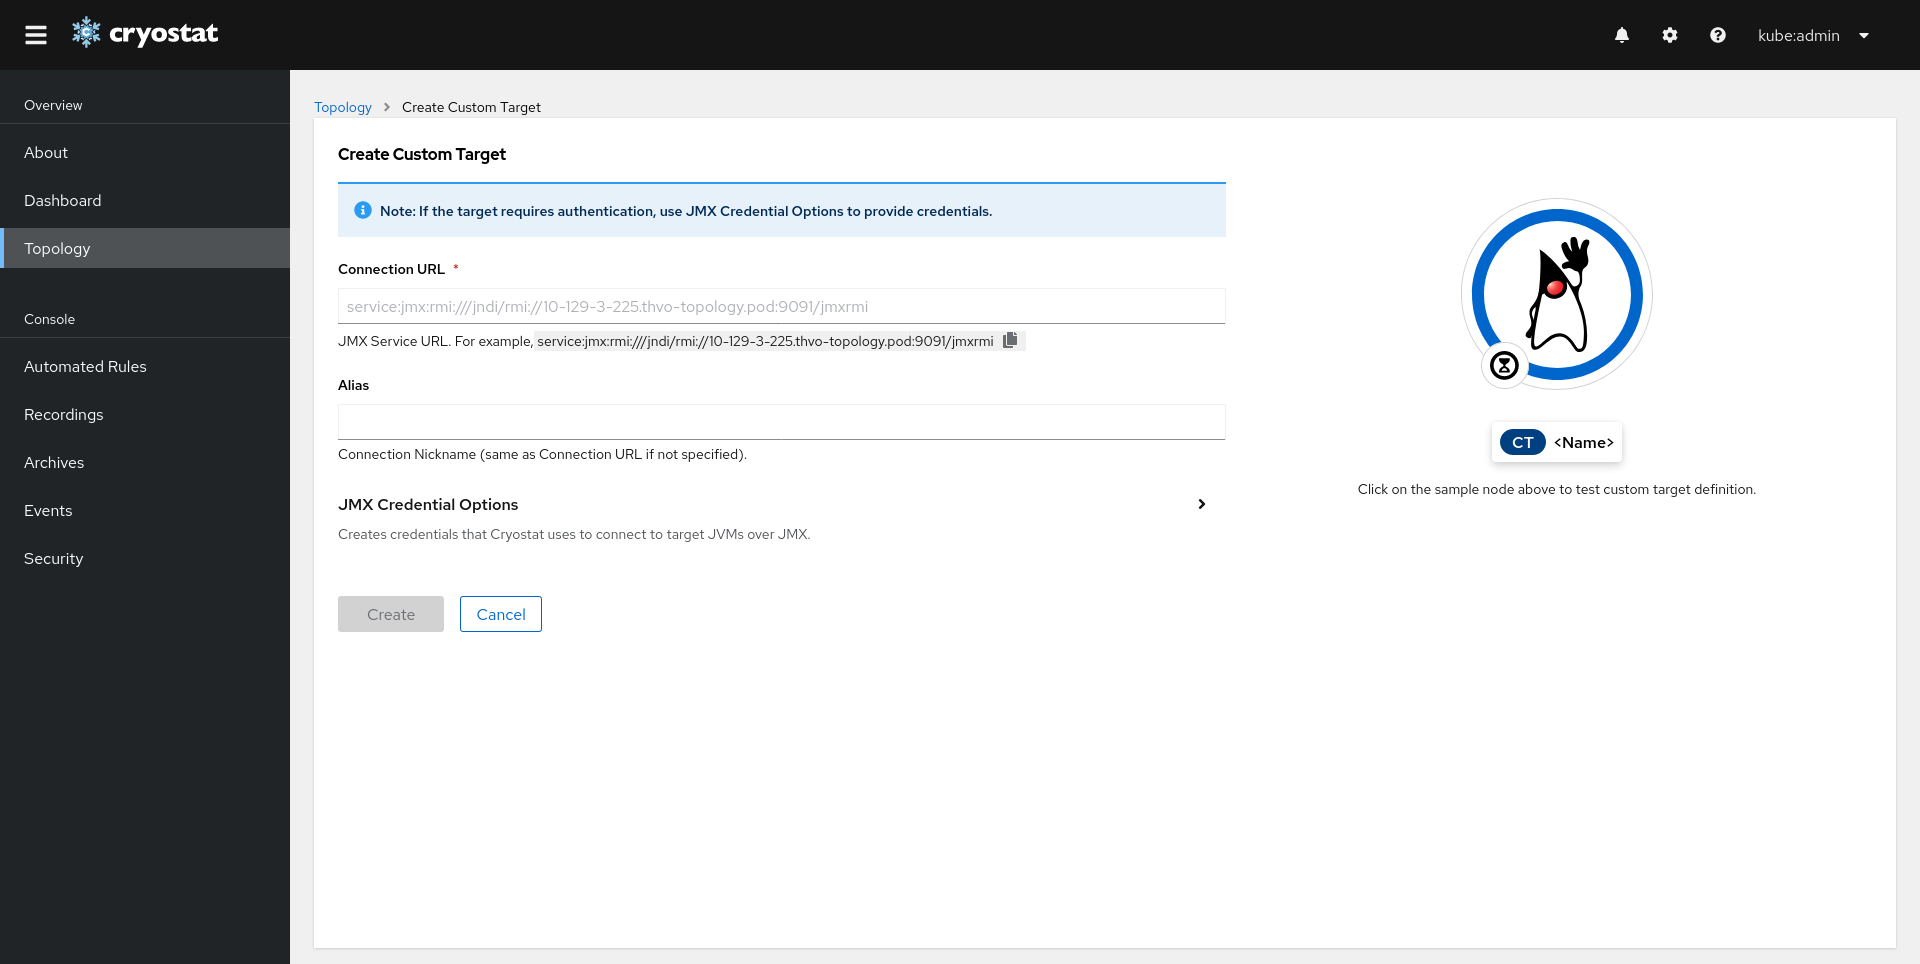
Since Cryostat 2.0, Cryostat allows defining Custom Targets for JVM applications that Cryostat cannot automatically discover. In Cryostat 2.3, Custom Target form is given a new look and can be navigated from the Topology Entity Catalog.
Click the Catalog icon on the toolbar to open a modal that contains the Entity Catalog.
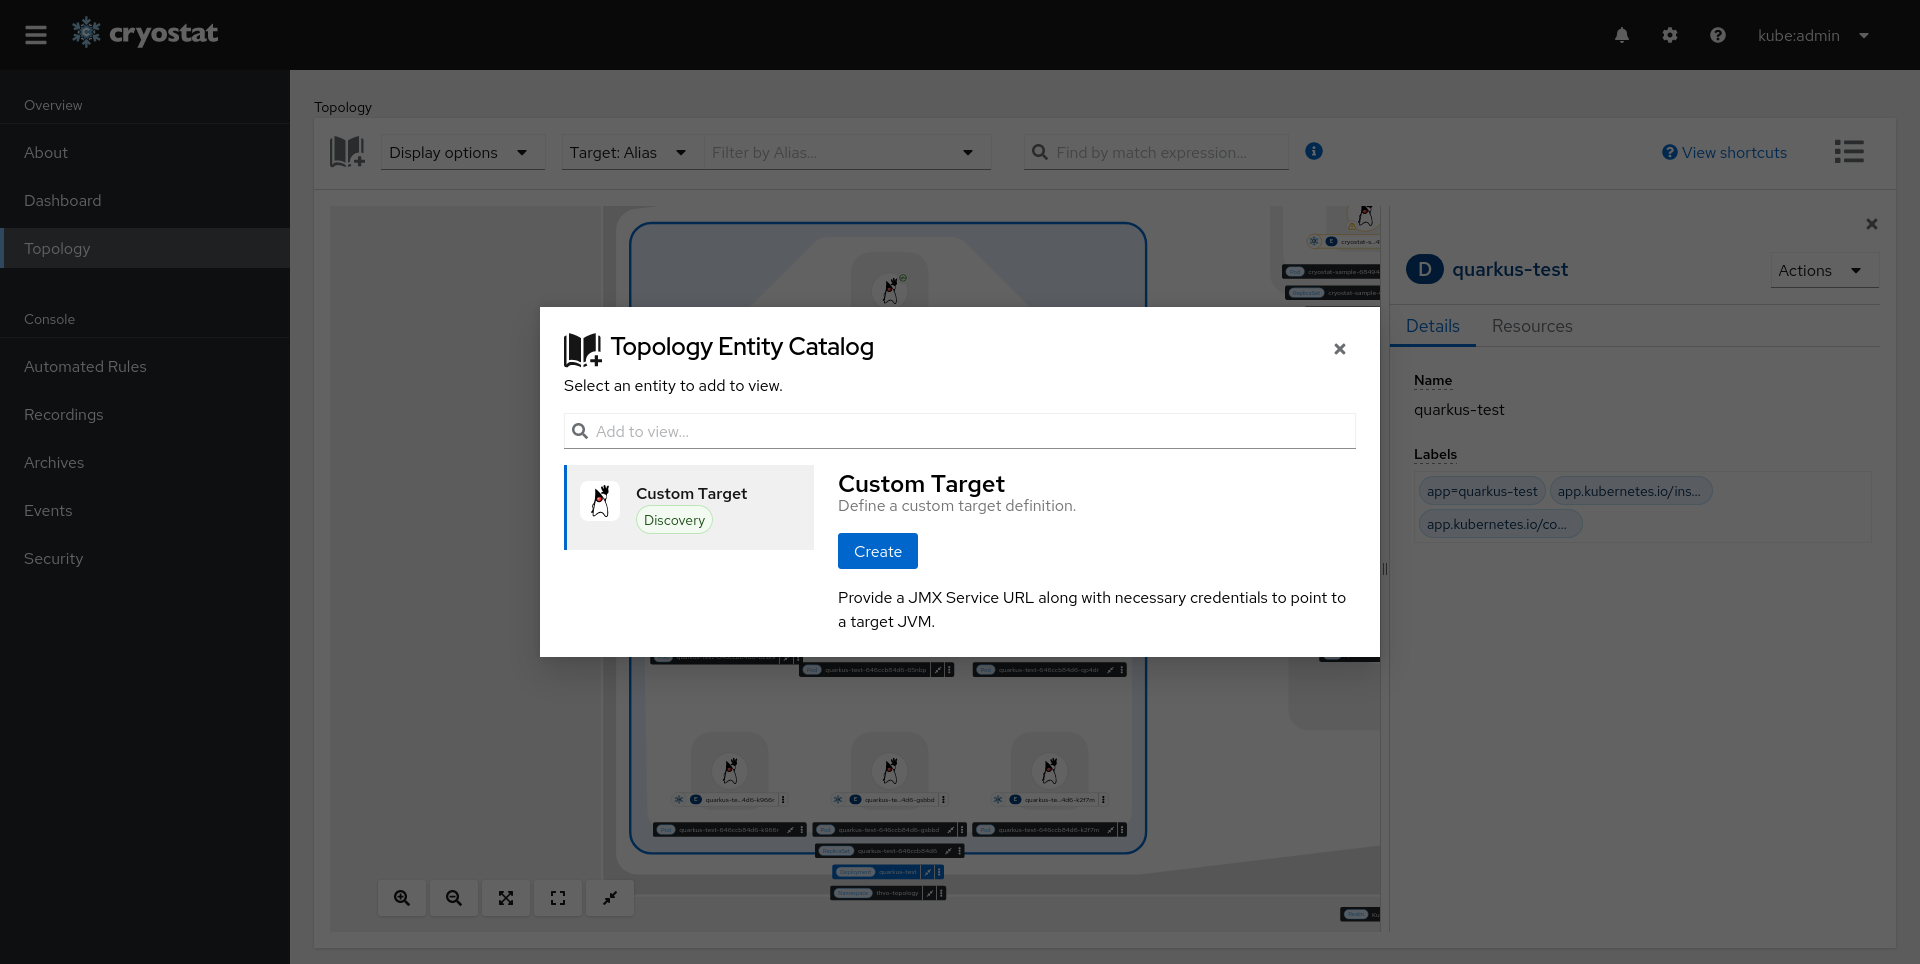
Select the Custom Target tab and click Create to open the Custom Target form. Here, you can define, test and create a Custom Target with ease.
Conclusion
Conclusion
With Cryostat 2.3, a brand new Topology View is introduced to provide a visual presentation of the all discovered JVMs and all resources that are associated with them. It also allows users to perform actions on one or multiple targets.
Recommend
About Joyk
Aggregate valuable and interesting links.
Joyk means Joy of geeK