

storytelling with data
source link: https://www.storytellingwithdata.com/
Go to the source link to view the article. You can view the picture content, updated content and better typesetting reading experience. If the link is broken, please click the button below to view the snapshot at that time.
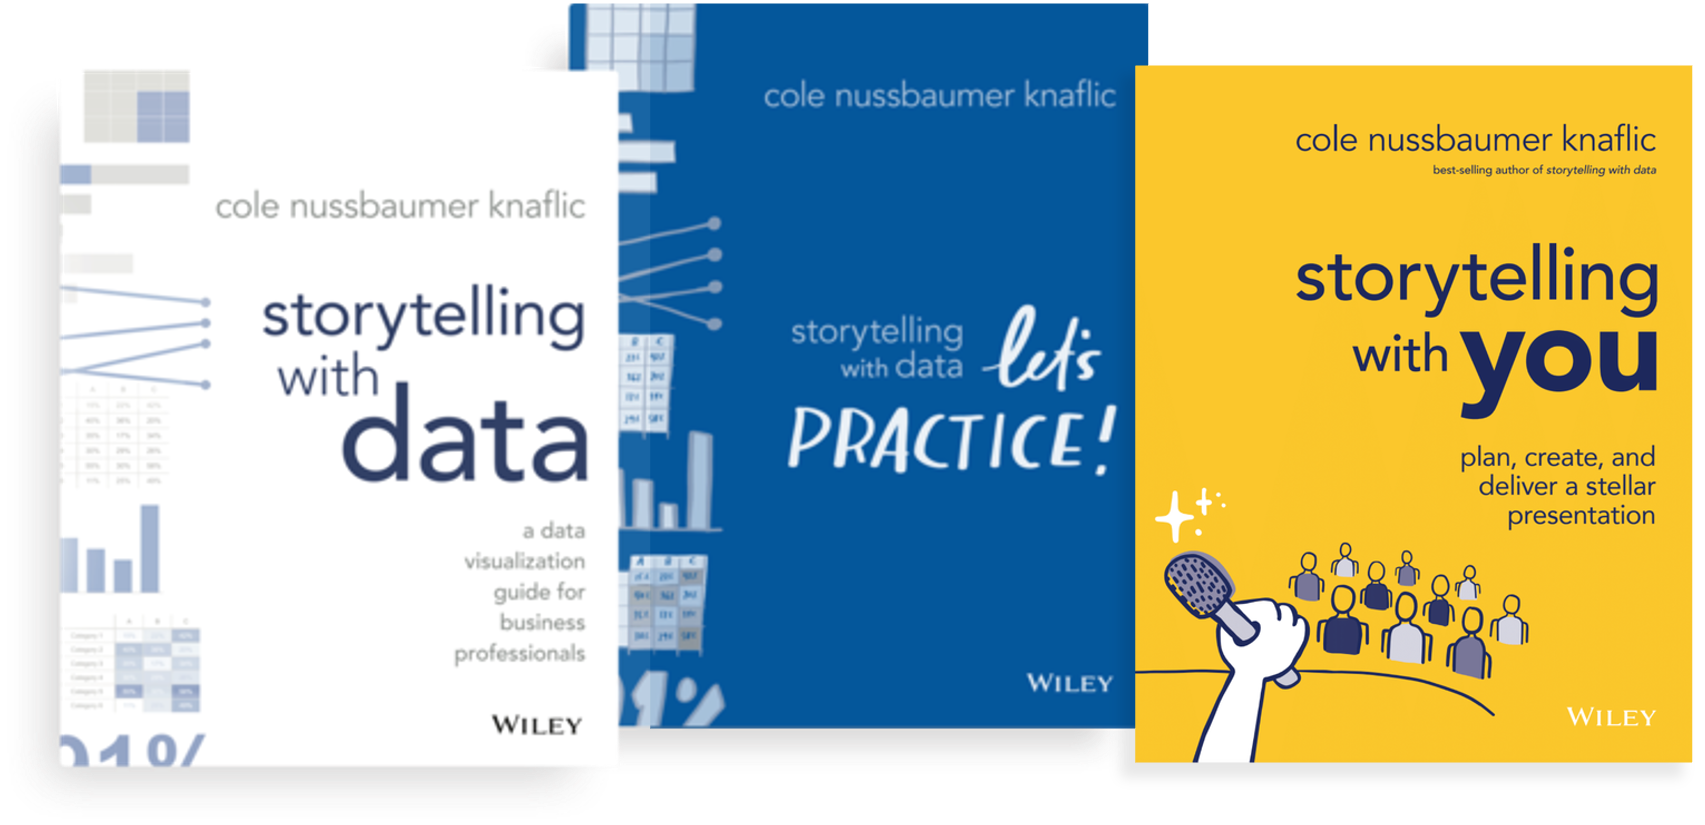
storytelling with data
With a focus on simple lessons and practical application, we equip and inspire individuals to take data storytelling to the next level

understand the context

choose an effective visual
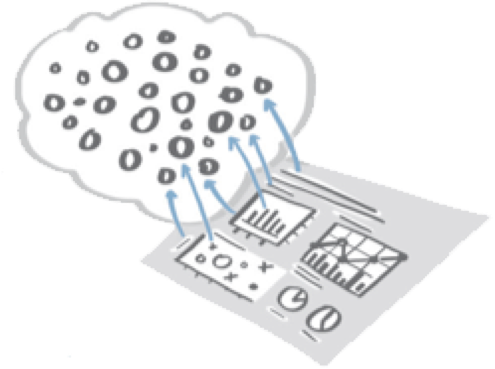
eliminate clutter

focus attention
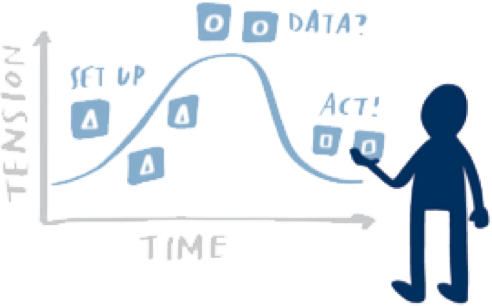
tell a story
Our workshops and presentations have benefited more than 25,000 people around the world
Experience SWD lessons firsthand in inspiring sessions geared to help people understand the value of effective data storytelling and impart skills to build individual and team confidence and credibility. Transition your work from acceptable to exceptional!

Our customers love us!
Here’s what some of our workshop participants have said…
The SWD workshop was one of the best sessions I have attended in a long time. Not a dull moment—it was interactive and kept my mind engaged. It has changed the way I share data.”
Engaging, informative, and superbly delivered with practical advice that’s easy to implement. Well done!”
You challenged my way of thinking for preparing and producing a quality presentation. Thank you SWD, you have changed my professional life!”
Check out the latest…
“it’s dreadful, right?”
Cole is periodically tagged in social media or sent emails about potentially problematic data visualizations people encounter in the wild. While she rarely gets involved in these discussions publicly, one recent message inspired her to reply.
PODCAST
ep 66: designing in light and dark
Mike and Alex discuss the advantages and drawbacks of designing visualizations with light and dark backgrounds, using examples from SWD community members to highlight where each approach can be preferable. Then, they dive into history and discuss the staying power of some famous graphs. What makes them memorable—and how we might be able to elevate them, using modern tools and perspectives?
VIDEOS
follow SWD on YouTube
Do you enjoy learning via video? We post new videos every Thursday. From data viz makeovers to how-to tutorials to tips and strategies that will improve your next graph or presentation—watch, learn, and become a better data storyteller!
Recommend
About Joyk
Aggregate valuable and interesting links.
Joyk means Joy of geeK