
Inside DataDog’s $5M Outage (Real-World Engineering Challenges #8)
source link: https://newsletter.pragmaticengineer.com/p/inside-the-datadog-outage
Go to the source link to view the article. You can view the picture content, updated content and better typesetting reading experience. If the link is broken, please click the button below to view the snapshot at that time.

Inside Datadog’s $5M Outage (Real-World Engineering Challenges #8)
The observability provider was down for more than a day in March. What went wrong, how did the engineering team respond, and what can businesses learn from the incident? Exclusive.
👋 Hi, this is Gergely with the monthly free issue of the Pragmatic Engineer Newsletter. In every issue, I cover challenges at Big Tech and startups through the lens of engineering managers and senior engineers.
If you’re not a subscriber, you missed the issue on Staying technical as an engineering manager and a few others. Subscribe to get two full issues every week. Many subscribers expense this newsletter to their learning and development budget. If you have such a budget, here’s an email you could send to your manager.👇
‘Real-world engineering challenges’ is a series in which I interpret interesting software engineering or engineering management case studies from tech companies. You might learn something new in these articles, as we dive into the concepts they contain.
Datadog is an observability service used to monitor services and applications, and to alert teams when anomalies occur. Observability services are essential in confirming that services operate reliably. When they stop working, the results can be bad for business. On Wednesday, 8 March, this happened to Datadog, which suffered serious reliability issues for more than 24 hours. This incident was costly, at $5M in lost revenue directly as a result of the outage, as revealed in a later earnings call. This was due to usage-based billing: Datadog most likely did not charge customers for data transfers while the system was down. The loss represents about a day’s worth of revenue for the company.
The incident in March was the first global outage at Datadog, in which all its regions were simultaneously impacted, and every customer experienced downtime. More than 2 months later, there has still not been an external postmortem published, which is unusual for such a major incident. When I reached out to Datadog about this delay a week ago, I was told more details will be published, but not when.
Confusingly, company CEO Olivier Pomel suggested during the earnings call on 4 May, that a postmortem had been published. He encouraged everyone to read it, saying (emphasis mine):
“We shared some information and postmortem about what happened. I encourage everyone to read it because it's a fascinating document.”
But no postmortem was publicly available when this statement was made! I asked Datadog if the CEO misspoke, and if not, where this postmortem was located which was presumably publicly available to “everyone.” I did not receive a response, despite several attempts.
I was, however, able to obtain two postmortems that were shared among a subset of Datadog customers. These documents form the basis of today’s case study.
In today’s issue, we cover:
The timeline of events. The concepts of TTD, TTM, TTR and how Datadog performed by these metrics.
A deep dive into the OS update which caused the outage. CVEs, buffer overflows, what the system process does, and what system dumps are. And why you should review operating system changelogs. Did Datadog miss something critical before applying the update?
What really caused the outage? Details on the systemd-networkd process, and what happens when you create tens of thousands of new virtual machines at the same time.
Why did running in 5 regions, on 3 different cloud providers not help? Datadog's outage should have never happened, and the right steps were taken to diversify its infrastructure against an outage like this. So how did all regions across AWS, GCP and Azure go down at the same time, despite no direct connection existing between them?
Follow-up actions. What immediate changes did the company make to avoid another update-wave?
Communication challenges during the outage. Datadog did poorly in one area: communicating with customers. Some had an amazing experience, while others were left in the dark. How come?
Learnings. What can other engineering teams take from this outage?
Update: a few hours following of the publication of my detailed analysis of the outage, Datadog finally published their postmortem. The postmortem published by Datadog is the same document they sent out 2 months ago — around 20-22 March 2023 — to several customers, and one of the two postmortems I used as basis for this article. Read the postmortem for details on the service recovery steps, which I do not cover in this writeup, in the interest of length. It is a mystery why the company sat on their internal postmortem that was ready to go, for two months, and does not project a culture of transparency.
1. Timeline, TTD, TTM, TTR
I’ll use Central European Summer Time (CEST) for time stamps, as the majority of Datadog’s engineering team is in this timezone. I’m also indicating US Eastern time (EST) for reference.
8 March, 07:00 CEST (01:00 EST): a new operating system update is applied to tens of thousands of virtual machines (VMs.) Machines to which this update is applied start to mysteriously go offline.
07:03, CEST (01:03 EST): the first internal alert is fired due to an anomaly in one of the metrics.
07:18 CEST (01:18 EST): the oncall team starts an investigation.
07:31 CEST (01:31 EST): the incident was declared, visible to customers, stating:
“We are investigating loading issues on our web application. As a result, some users might be getting errors or increased latency when loading the web application.”
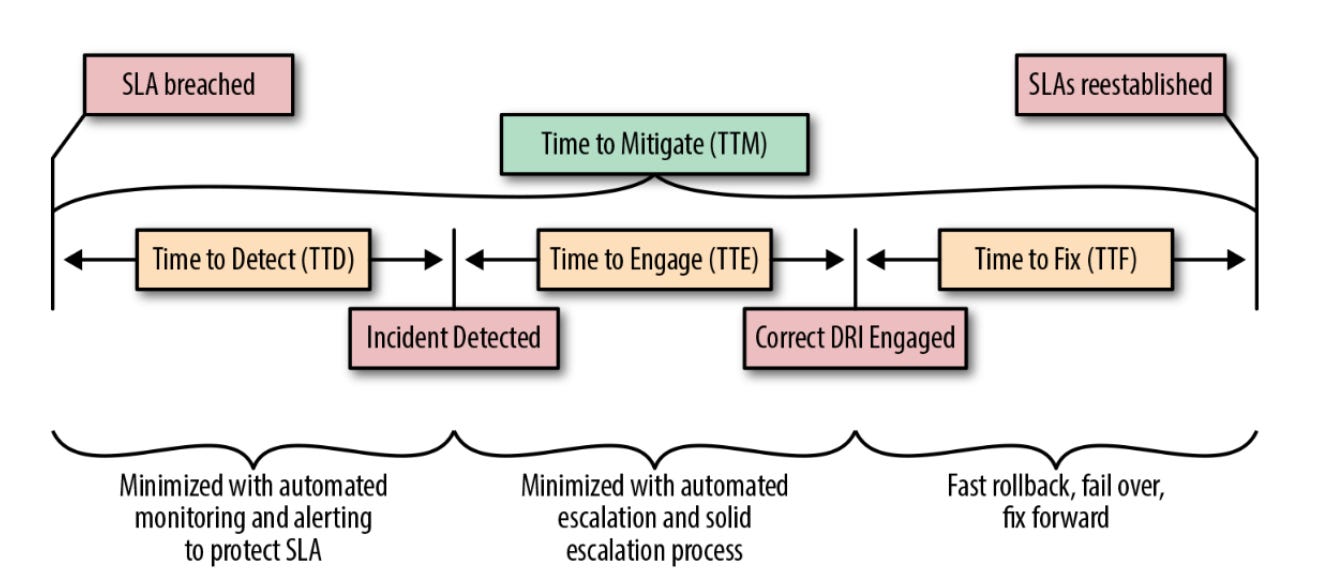
Time to Detection (TTD): 31 minutes. In an incident, TTD indicates the length of time from when it starts until it is acknowledged by the oncall team, and an outage is declared.
In the book Seeking SRE, Martin Check describes this metric as:
“Time to Detect is the time from the impact start, to the time that an incident is visible to an operator. We start the counter when impact first becomes visible to the customer, even if our monitoring didn’t detect it. This is often the same as the time that the Service-Level Agreement (SLA) is breached.
Believe it or not, TTD is the most important metric for incidents that require manual mitigation action. This measure determines the quality and accuracy of your monitoring. If you don’t know about your customer pain, you can’t begin the process of recovery, and you certainly can’t actuate automation to respond or mitigate. Maybe even more important, you can’t communicate to your customers that you know about the problem and are working on it. The challenge with TTD is balancing the monitoring sensitivity such that you find all of the customer issues quickly and accurately, without constantly interrupting your engineers for issues that don’t impact customers.”
08:23CEST (02:23 EST): when the potential impact on data ingestion and monitoring was discovered, the update said:
“We are investigating issues causing delayed data ingestion across all data types. As a result monitor notifications may be delayed, and you may observe delayed data throughout the web app.”
In all fairness, we could question if TTD should be 1 hour and 23 minutes, and not 31 minutes. This is because while Datadog did declare an incident 31 minutes after the event began, it did not tell customers that their core functionality of data ingestion and monitoring were impacted.
21:39 CEST (15:39 EST): 14 hours after the start of the incident, the first longer incident description is posted on the incident timeline:
“We expect live data recovery in a matter of hours (not minutes, and not days)”
9 March 9:58 CEST (03:58 EST): all services declared operational. However, data was still delayed, and backfilling needed to be completed.
10 March 06:25 CEST (00:25 EST): incident fully resolved, with historical data backfilled.
Time to Mitigate (TTM): This refers to the duration from the start of an incident until services are restored to a healthy status. In Datadog’s case, it was 1 day, and 2 hours, 58 minutes for live services to be restored, and 1 days, 23 hours 25 minutesfor the entire incident to be resolved.Here’s how the TTM metric is visualized in Seeking SRE:
Time to Remediate (TTR): unclear as yet. After the incident is mitigated, there’s often follow-up work for engineering teams to address one or more questions:
Reducing the time to detect, in future. This usually means improving monitoring and reducing the noise of alerts.
Reducing the time to mitigate, for next time. This can involve improving systems, oncall teams owning systems, improving runbooks, making changes to allow automated rollback of changes, and so on.
Make changes which address the systemic root causes of an incident. Is there automated testing, manual steps, or other process changes that could address the systemic issues behind an incident? Common approaches include automated canarying-and-rollback, static analysis, automated testing (like unit, integration or end-to-end tests) craft, or the use of staging environments.
The higher the impact of an outage, the longer the work to fix the underlying causes can take. This is because high-impact outages can be the triggers to make the complex and time-consuming changes which ensure a system operates more reliably in future.
2. A deep dive into the OS update that caused the outage
Datadog’s outage was caused by an operating system (OS) update. Ubuntu Linux runs on the virtual machines and regularly updates this distribution to the latest version. The problem occurred during an update to the 22.04 version of the OS, involving a security update to the systemd process.
systemd is a "system and service manager” on Linux. It is an initialization system and is the first process to be executed after the Linux kernel is loaded, and is assigned the process “ID 1.” systemd is responsible for initializing the user space, and brings up and initializes services while Linux is running. As such, it’s core to all Linux operating systems.
Here are the release notes for the 2 March 2023 update. It was this OS update – and one of the two changes to systemd – that caused Datadog’se problems, a few days later:
“SECURITY UPDATE: buffer overrun vulnerability in format_timespan()
- debian/patches/CVE-2022-3821.patch: time-util: fix buffer-over-run
- CVE-2022-3821
SECURITY UPDATE: information leak vulnerability in systemd-coredump
- debian/patches/CVE-2022-4415.patch: do not allow user to access coredumps with changed uid/gid/capabilities
- CVE-2022-4415”
Let’s analyze these notes, to see if we can spot what caused Datadog’s VMs to start shutting down when this patch was applied. The first thing which stands out is a CVE identifier under both fixes.
What is a CVE? Common Vulnerabilities and Exposures (CVE) is a list of publicly disclosed computer security flaws. The CVE program is run by the MITRE corporation with funding from the US Department of Homeland Security.
CVE IDs are a reliable way to recognize vulnerabilities, and to coordinate fixes across vendors. In the case of Linux, given the number of distributions; such as from Red Hat, Ubuntu, or Debian, CVEs are a helpful reference for which distribution has addressed certain, known vulnerabilities.
You can browse all CVEs here, and there’s even a Twitter feed of the latest submitted CVEs. The list is lengthy and several CVEs tend to be submitted hourly.
The buffer overflow fix
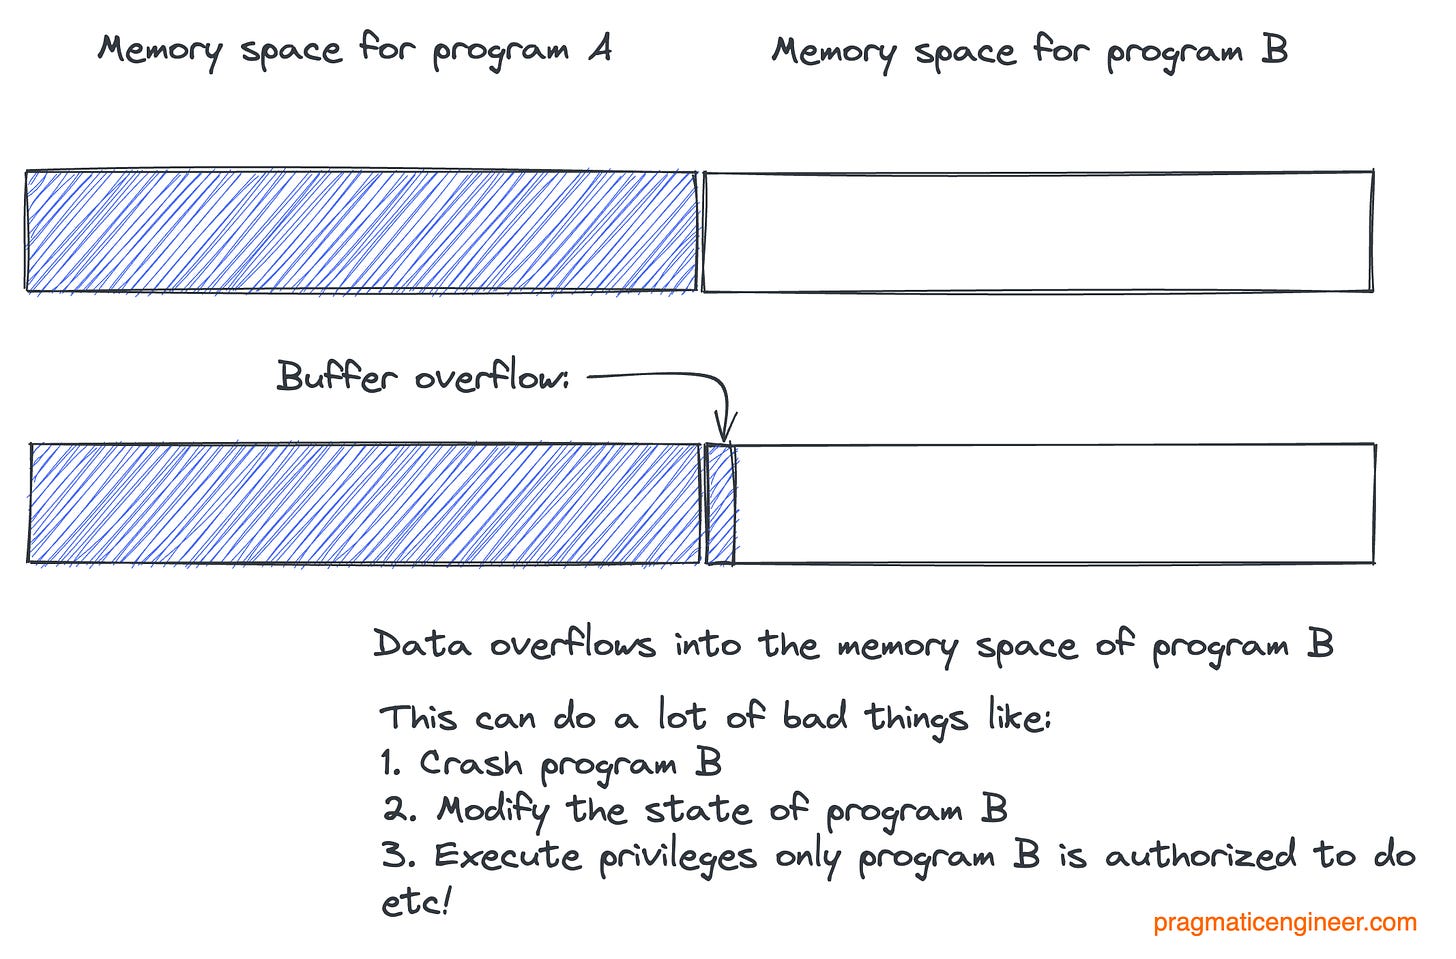
The first fix was for CVE-2022-3821: a buffer overflow. A buffer overflow happens when a program writes data to a buffer, but goes beyond the memory allocated for the program. In doing so, it overwrites the adjacent locations of other programs.
By taking advantage of a buffer overflow, it’s possible to alter the runtime of another program. In systems like Linux, the memory layout of the system is well defined, as a whole. The systemd process is the first to be loaded into the memory, and so causing a buffer overflow which allows malicious code to execute things which are normally not possible.
In the case of this vulnerability, an attacker could supply specific values for time and accuracy that cause a buffer overrun in format_timespan(), which causes systemd to crash. As systemd manages all processes, if it crashes then so does the whole operating system. This is also known as a kernel panic. Until it is patched, an attacker can insert specific dates into inputs parsed by systemd’s format_timespan() method, and trigger a Denial of Service by making the system crash.
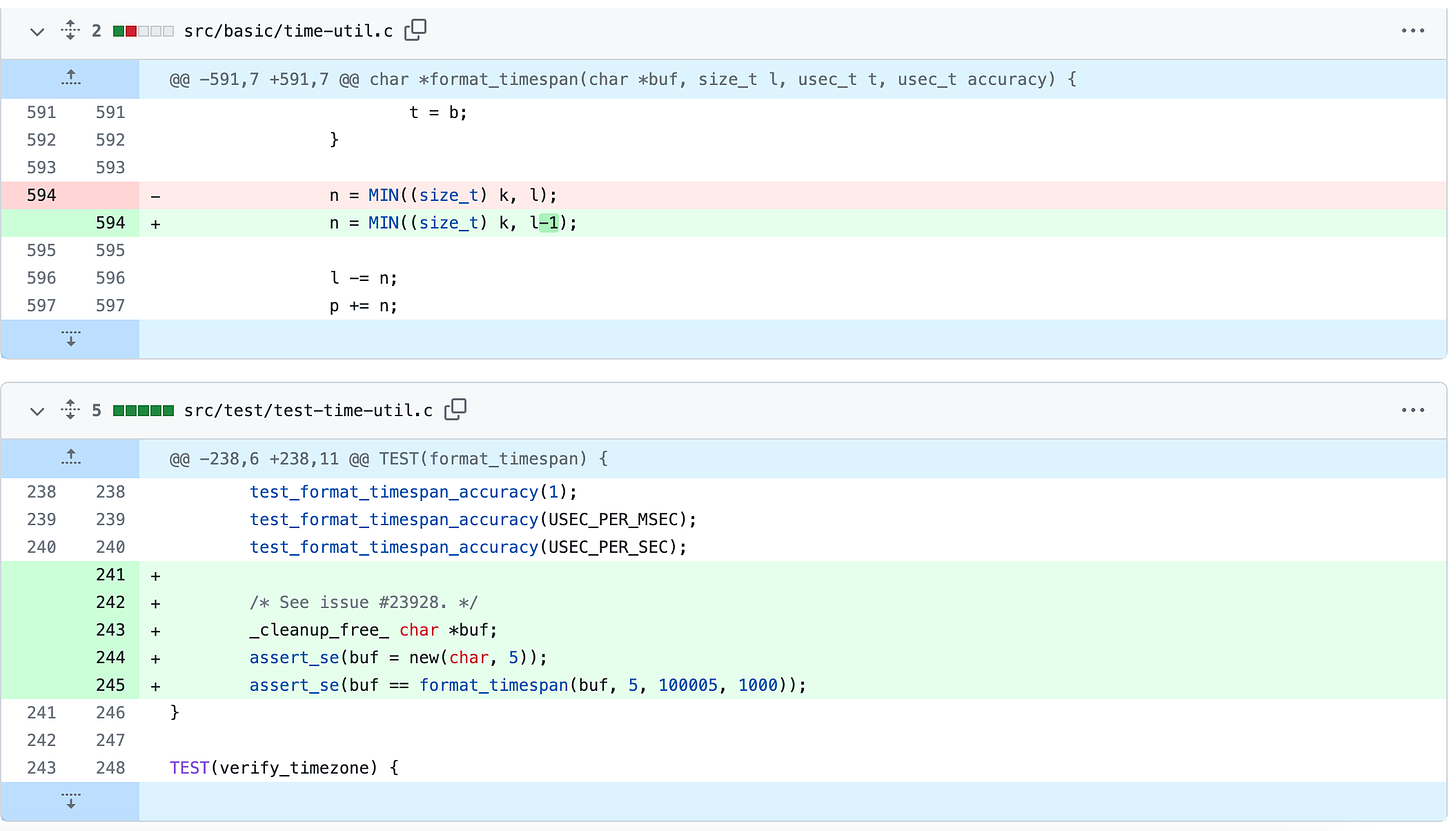
Here is the fix for this vulnerability:
While the fix is only 1 line (and 3 lines added in tests), it takes quite the effort to understand why it works. This is partly because the format_timespan method is a 100-line method, which uses variable names like i, j, k, l, m, n, and these variable names do not have comments assigned to them, meaning their function is harder to deduce. Fortunately, the issue raised for the buffer overflow explains the problem clearly:
“The problem of the above code is that n = MIN((size_t) k, l); can assign the buffer size l to n. Then p += n; will cause p to point to one byte after the buffer buf, leading to a buffer overwrite in *p=0 (an off-by-one error).”
It’s testament to how hard it is to write secure code, that an off-by-one bug is discovered years after it was introduced!
Could the buffer overflow fix have caused issues? It’s unlikely, as this fix closes an attack surface that could have been exploited to crash the system.
The information leak vulnerability fix
The second fix was CVE-2022-4415, which was a security flaw in which systemd-coredump did not respect the fs.suid_dumpable kernel setting.
systemd-coredump is a utility that’s part of systemd. It handles core dumps, which are files that contain a process’s memory and register state at the time a program is terminated. Core dumps can be useful when debugging, as they provide a precise snapshot of the system when the crash occurred.
There is the option to configure what is added to the core dump file, using the suid_dumpable variable. The options are:
1 (default): any process which has changed privilege levels, or is execute-only, will not be dumped.
2 (debug): all processes dump when possible. This is insecure as it allows regular users to examine the memory contents of privileged processes.
3 (suidsafe): appropriate when administrators are attempting to debug problems in a normal environment.
The problem was that the setting used was option “2” by default, meaning all processes were dumped, even ones that a user has no viewing privileges for.
Could the information leak vulnerability fix have caused issues for Datadog? Unlikely. The fix would have only caused issues if there were processes that analyzed core dumps of crashed processes. Those core dumps would no longer have access to the memory details of processes run by the root user.
3. What really caused the outage?
The updates to systemd were relatively harmless, in the context of operating thousands of virtual machines. If anything, those updates made the Linux distribution more secure. And as it turned out, neither systemd fix directly caused the outage.
The problem was forcing the roll out of the fixes. Systemd is process number 1, and if anything changes during an update, it re-executes itself, and can do the same with its child processes. Although this is not a full reboot, the implications can be similar enough.
This is where the problem manifested:
The security update made changes to the systemd process, which is central to Linux.
As systemd re-executed itself, so did all its sub-processes, including systemd-networkd.
systemd-networkd is a process that manages network configurations. With systemd re-executing itself, systemd-networkd was restarted. Thanks to the restart, this process inadvertently removed network routes.
The routes systemd-network removed were managed by an eBPF (extended Berkeley Packet Filter)-based container routing control plane based on Cilium. Cilium handles communication between containers. Datadog’s network control plane manages the Kubernetes clusters.
Thanks to the routes removed, the VMs (nodes) in these routes simply vanished from the network control plane, going offline.
The problem of routes removed upon the systemd update, had not been previously observed. This is because when starting a new node, there are no container-started routes already stored. Starting the systemd-networkd does not “erase'' anything.
The problem was these updates happened almost simultaneously, on tens of thousands of virtual machines. This was not even the worst part, losing the network control plane was.
In a circular dependency, the reset also took offline the network routing control plane. Nodes disappearing from the control plane is unfortunate, but they can be brought back quickly. However, the postmortem describes the real problem:
“Among the VMs that were brought online by this bug were the ones that power our regionalized control planes [based on Cilium]. This caused most of the Kubernetes clusters we use to run our platform to be unable to schedule new workloads, automatically repair, and automatically scale.
Thus we gradually started to lose processing capacity and by [08.31 CEST], enough of it was online that the outage was visible to [customers].“
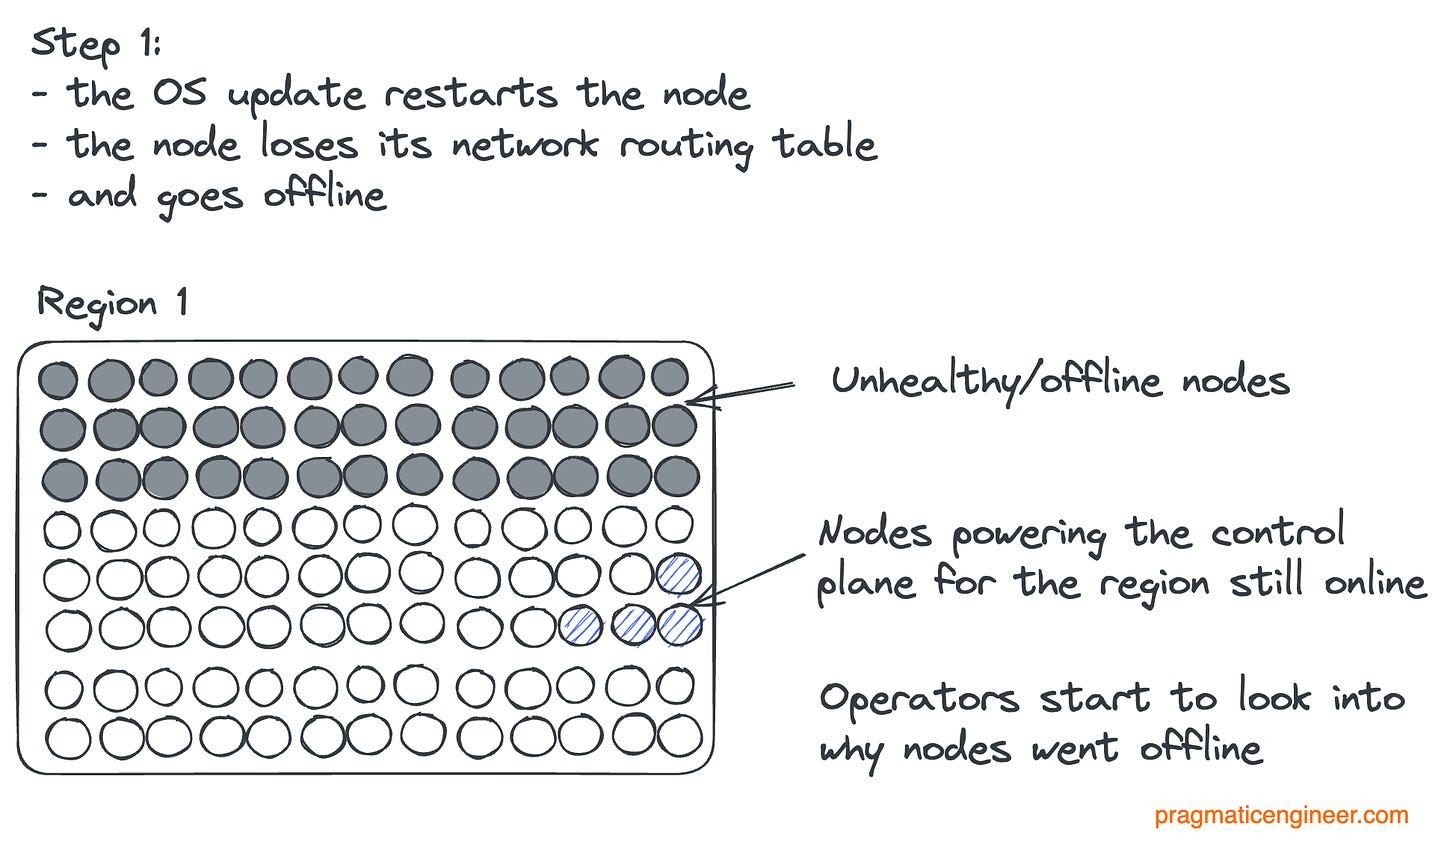
Let’s visualize what happened. The initial state of a region:
Then the first systemd updates happen, and nodes went offline:
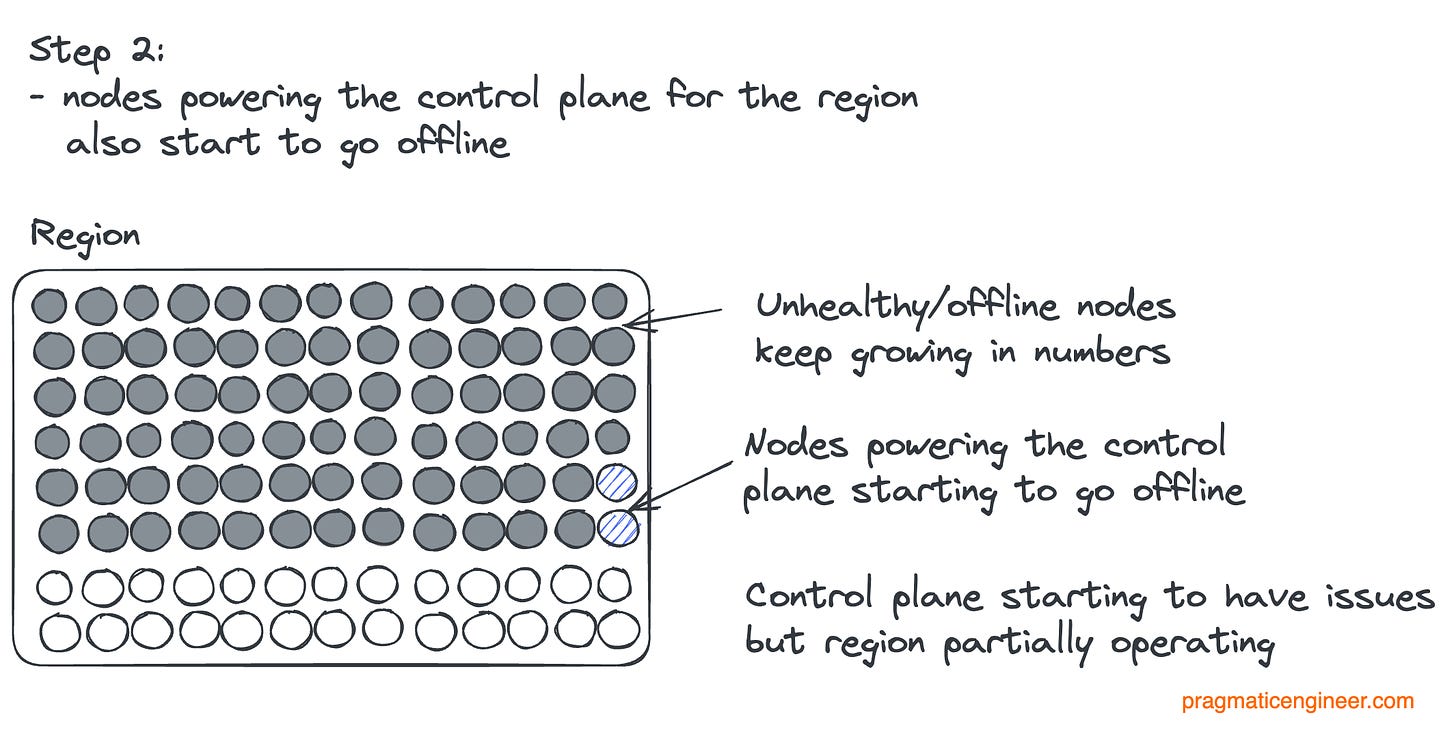
More updates happen, and start to take control plane nodes offline:
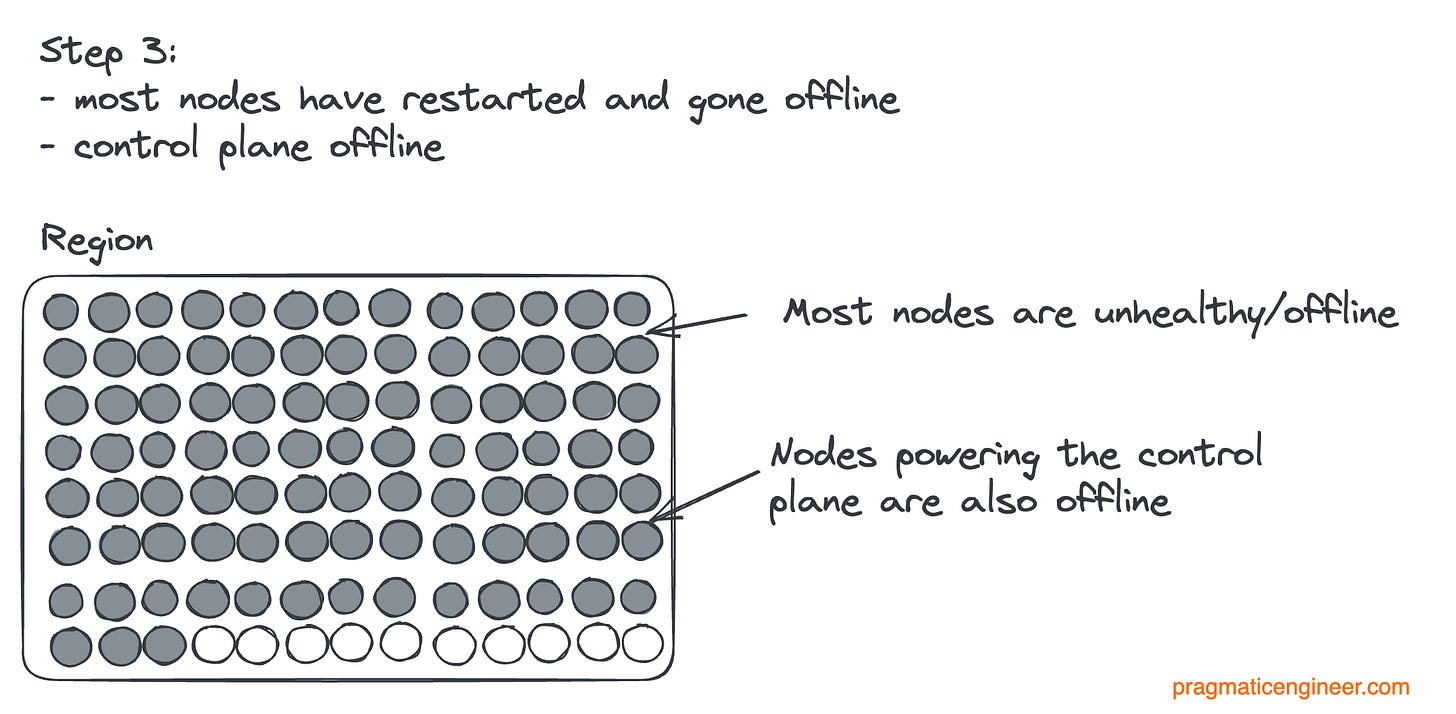
Finally, the region goes offline as the control plane is taken offline:
So the control plane going offline was the real problem. Had the control plane been unaffected, the outage would have likely been brief. In that case, Datadog could have just re-added the vanished nodes to the routes using the control plane. But with the control planes also gone, the first order of business had to be to get this control plane back and figure out how it disappeared in the first place.
This circular dependency, where the infrastructure control plane depends on the infrastructure it manages, recalls what happened when the video game Roblox went down for three days straight in October 2022. Then, the dependency was that Nomad (orchestrating containers) and Vault (secrets management service) both used Consul (service discovery.) So when Consul became unhealthy, Vault went offline. But Vault was needed to operate Consul: a circular dependency.
Could have any of this been predicted to happen? While it’s easy to look at the incident with the benefit of the hindsight: it’s still worth asking; could have systemd (and systemd-networkd) breaking Cilium routes been possible to predict?
After this article was published, software engineer Douglas Camata —who is currently at Red Hat—pointed out that Cilium and systemd are known to break on OS upgrades. An issue was open from March 2020 to June 2022 describing how updating systemd breaks Cilium network traffic.
However, the issue referenced here had been fixed in Cilium 9 months before the outage occured, and was merged into the 1.10.13 release of Cilium as a bugfix. An engineer who would have been aware of the problems systemd had with Cilium: they might have been a bit more suspicious, knowing that an OS update making changes to systemd is coming up. But no: it does not seem likely that any one engineer could have predicted the impact the systemd update would have on Cilium paths: not without testing this update scenario.
4. Why did running in 5 regions on 3 different cloud providers not help?
To its credit, Datadog does have several things in place which should have made this outage impossible:
1. No security patch updates all at once. From the postmortem:
“Whenever we push new code, security patches or configuration changes to our platform, we do so region-by-region, cluster-by-cluster, node-by-node. As a matter of process, we don’t apply changes in-situ; rather, we replace nodes and containers in a blue/green fashion. Changes that are unsuccessful trigger an automatic rollback. We have confidence in this change management tooling because it is exercised at a large scale, dozens of times a day.”
2. Operating in 5 regions across 3 cloud providers. Datadog does not tie its infrastructure to a single cloud provider, but uses 3 different ones. I did a reverse lookup of the IP address of its data centers, and the cloud providers they most likely use, based on this detail:
AWS for US1 (US East Coast, likely using AWS’s us-east-1 data center) and for AP1 (Japan, likely using AWS’s ap-northeast-1 data center near Tokyo)
Google Cloud for EU1 and US5
Azure for US3 (US West Coast, likely using Microsoft’s Quincy data center)
Within each cloud provider, it uses several regions and operates on dozens of availability zones.
Considering features #1 and #2: how did an OS update which took VMs offline, then snowball into a global outage? This incident should have been caught either at the virtual machine level, or at cluster level. And even if a cloud provider mandated a patch be installed across virtual machines, the other two cloud providers would have different policies.
Well, it seems Datadog is using cloud providers more as an infrastructure-as-a-service setup for its machines, and running its own virtual images on top of the same OS image across cloud providers. And this was the root of the problem. From the postmortem:
“The base OS image we use to run Kubernetes had a legacy security update channel enabled, which caused the update to apply automatically. By design we use fairly minimal base OS images so these updates are infrequent.
To compound the issue, the time at which the automatic update happens is set by default in the OS to a window between 06:00 and 07:00 UTC [7:00 and 8:00 CEST CEST / 1:00 and 2:00 EST]”
This was the problem.
All Datadog’s virtual machines updated within an hour and re-executed systemd. This happened across all 3 cloud providers and all 3 regions, despite there being no networking coupling in place between regions. The configuration was the same and the update timezone was not even tied to a region, but set to UTC.
To be fair, this is a learning that’s rare outside of a global incident, like this one was. As the postmortem noted, automatic updates are infrequent, and usually don’t result in the key process — systemd — re-executing itself.
The last time there was a security update to systemd was more than a year ago, in January 2022. That update could have caused the exact same issue with the restarting of systemd-networkd, and the clearing of the routing tables. I can only assume that back in January 2022, Datadog had a different infrastructure setup; perhaps a different OS for its Kubernetes cluster, for example.
Using different cloud providers complicated recovery, in an interesting way. Datadog made its infrastructure redundant by relying on multiple cloud providers. However, using 3 cloud providers made recovery from the outage trickier. Here’s how the company describes the challenge in the postmortem:
“Some cloud providers’ auto-scaling logic correctly identified the affected node as unhealthy but did not initiate the immediate retirement of the node. This meant that simply rebooting the affected instance was the correct recovery step and was much faster for stateful workloads that still had their data intact and led to an overall faster recovery.
Other cloud providers’ auto-scaling logic immediately replaces the unhealthy node with a fresh one. Data on the unhealthy node is lost and needs to be recovered, which adds to the complexity of the task at hand. At the scale of tens of thousands of nodes being replaced at once, it also created a thundering herd that tested the cloud provider’s regional rate limits in various ways, none of which was obvious ex ante [at the time.]”
Cloud providers that did not try to be “smart” about unhealthy nodes, turned out to be easier to deal with. These nodes already had the routing table available, which just needed to be loaded into systemd-networkd. Here, Datatog could restart the nodes. It was the cloud providers spanning a brand new node and disposing of “unhealthy” nodes that complicated things.
A “thundering herd” refers to when a large number of threads, processes or VMs become available all at once and put a strain on the resources of the system. In this case, the strain was on the cloud provider’s resources to spin up tens of thousands of virtual machines at the same time.
One common solution to a thundering herd problem is to put some kind of queuing or backoff mechanism in place. So instead of all VMs starting up at once, a certain number are added in phases. Of course, this is a problem that’s better understood if you already went through it.
5. Follow-up actions
After mitigating the outage, the Datadog team took several steps to ensure this outage won’t happen again:
1. Made OS images resilient to systemd updates. Another cause of the outage was that the routing tables were lost when systemd was updated. Datadog made a change at the configuration of systemd-networkd, so that upon the systemd update the routing tables needed for Cilium (the container routing control plane that manages the Kubernetes clusters) are no longer removed.
2. No more automatic updates. Datadog has disabled the legacy security update channel in the Ubuntu base image, and rolled this change out across all regions. From now on, the company will manually roll out all updates, including security updates, in a controlled fashion.
For someone interested in security, turning off automated security updates could set off an alarm bell. Won’t turning off these updates make things less secure? Given Datatog already fixed its service to be resilient to OS updates, should it not leave automatic updates on?
According to the team, turning off automated updates makes no difference to the security posture, because they already review and apply OS-level security updates, and don’t rely on automated updates to get the latest security patches.
My view is Datadog is doing itself a favor by not depending on automated updates that could reset the whole fleet at the same time. I would only recommend leaving automated updates on at companies which do not manually update their stack or tools; often because they don’t have the scale for dedicated security folks to keep on top of security patches.
6. Communication challenges during the outage
I talked with Datadog customers affected by the outage, and also reviewed the incident communications. Here’s my thoughts on how things went in terms of informing customers – and the public – about what went wrong.
Public communication was alright, but could have been better. When the incident started, Datadog promptly declared an incident. This would contain updates on what was happening.
For a global outage affecting all customers, it took 31 minutes to declare this an incident. This is not amazing speed, but given the service had only just started to degrade, the response time was ok. However, it also took about an hour and a half to let customers know that ingestion and monitoring was impacted. This was a slow response for an outage of such scale.
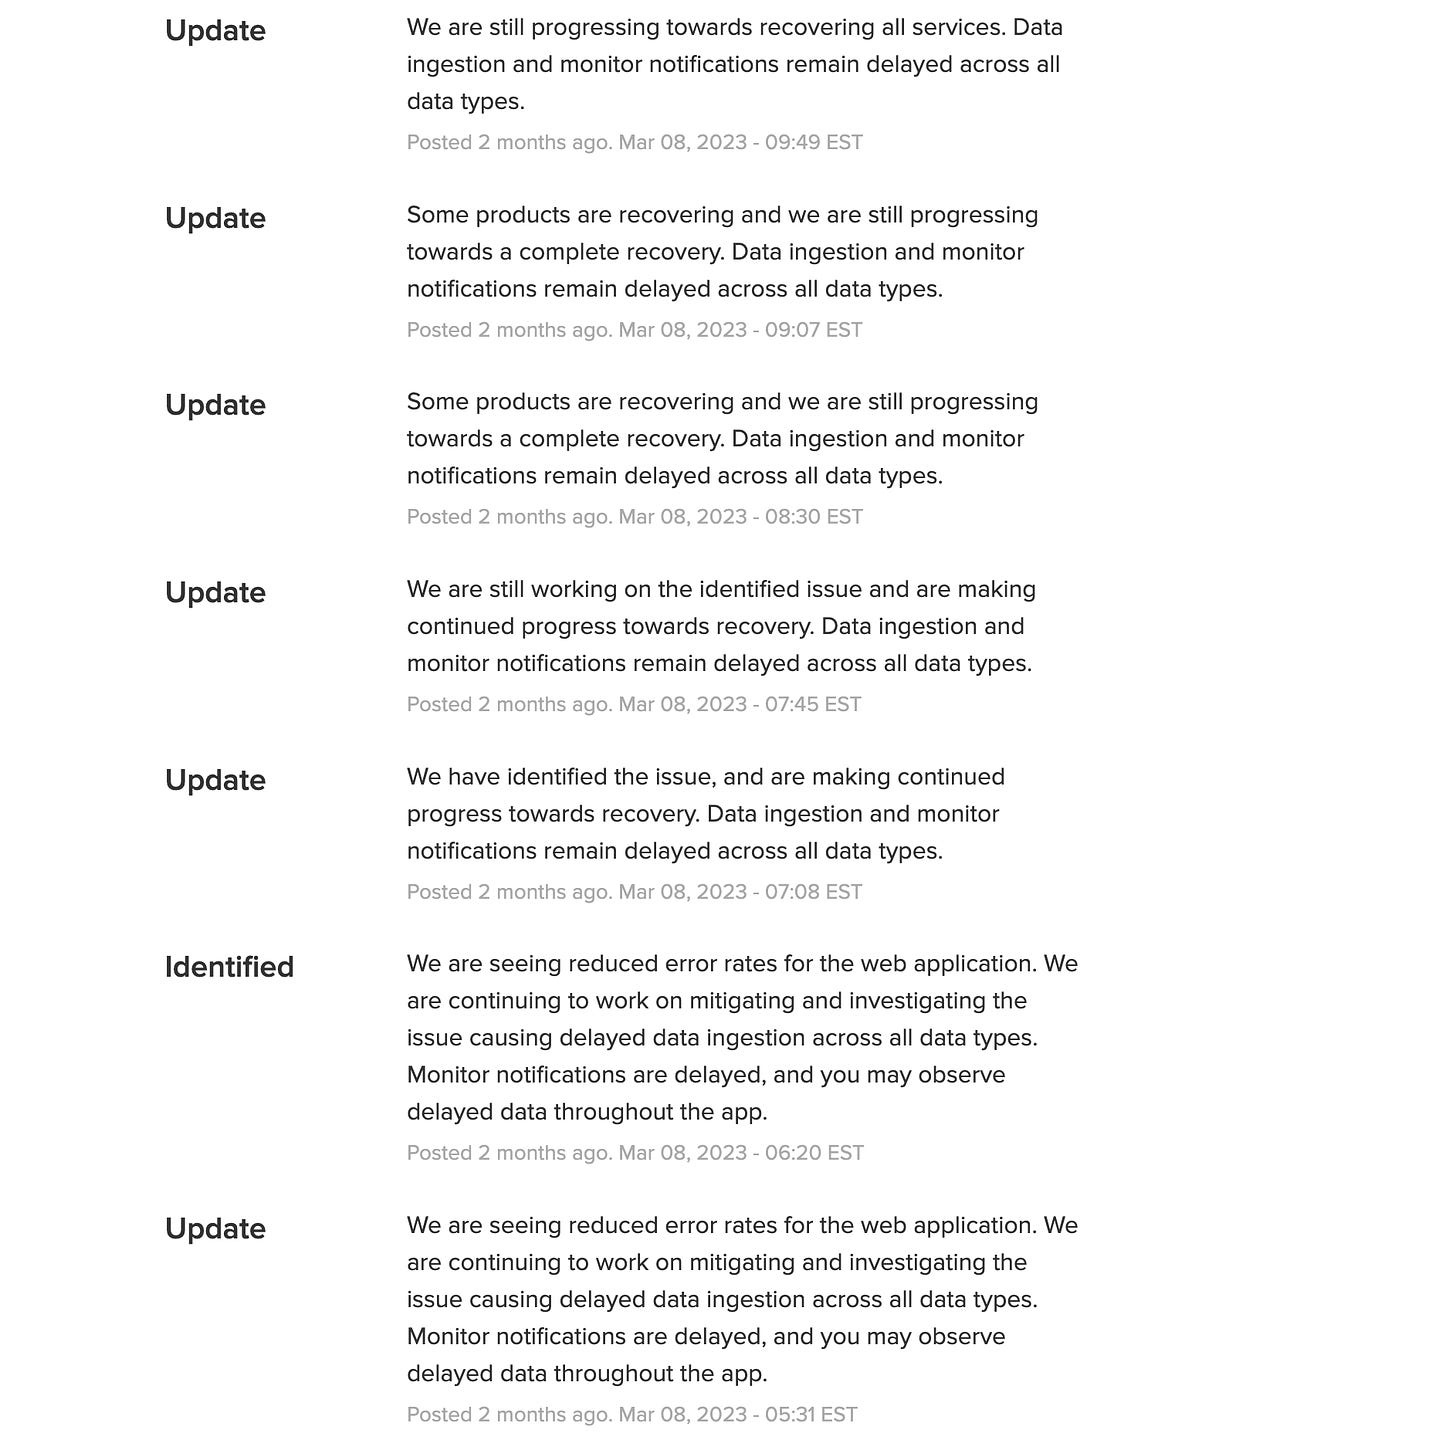
Updates from then onwards were relatively frequent, hourly at least. What wasn’t so great from a customer’s point of view, was that these updates were often meaningless copy-pastes of previous updates:
For example, 14 updates in a row were a variation of the phrase, “data ingestion and monitor notifications remain delayed across all data types.” These updates technically satisfied demand for frequent communication, but in reality contained no new information for customers.
The Datadog team’s first meaningful, public-facing update came 14 hours into the incident. This update:
Summarized the problem at a high-level: “A system update on a number of hosts controlling our compute clusters caused a subset of these hosts to lose network connectivity”
Explained the current status: “We identified and mitigated the initial issue, and rebuilt our clusters (...) The recovery work is currently constrained by the number and large scale of the systems involved.”
Made it clear what to expect next: “We expect live data recovery in a matter of hours (not minutes, and not days)”
I like that the team gave a meaningful – if vague – estimate (“live data recovery in a matter of hours – not minutes, and not days) and then delivered on this promise by prioritizing live capabilities.
For most customers, Datadog’s live functionality was restored within a day and a half, and all data was backfilled within two days, with no reported data loss.
After the incident concluded, Datadog did no further “centralized” communication with customers. Once a large outage is resolved, the next step is conducting a postmortem, as we cover in Incident review and postmortem best practices. It’s customary to share this postmortem with customers, to build up trust.
It’s at this point that the story of this outage took a strange turn...
Some customers got a 2-page preliminary postmortem a few days after the incident, which summarized details like the systemd-networkd issue causing the problem, and how Datadog has ensured this particular type of outage will not occur again. Two weeks after the incident, some customers received a 4-page PDF postmortem with more details and a neat overview of the outage.
However, several customers got none of these documents. Some customers did not get the postmortem even after explicitly asking for it: I talked a customer with spend above $100K/year who requested this document twice —on 11 May and 12 May, after learning on how other customers were sent this review—, but received no response from the company.
What was the difference between customers who got postmortem documents, and those who didn’t? I’ve talked with around 10 impacted customers and there’s no link between their spending and the level of service they received. Both some small and large customers by annual spend ($50K/year and $1M+/year) reported excellent service. Meanwhile, other small and large customers received no communication after the outage concluded —including customers spending $1M+/year, and getting no postmortem shared.
The only potential connection I can discern is the account manager. Some account managers were extremely proactive, forwarding all details to their account. Others did not do this.
Why did Datadog rely on account managers to forward postmortem documents as 1:1 communication? Datadog had never previously had a global outage which impacted all customers. And when it happened the company didn’t have a “unified” customer communication process. Not all customers were notified of the preliminary postmortem, and the same happened with the “internal postmortem,” which some customers received 2 weeks after the incident.
Customers who received no communication were obviously surprised that others did get access to the postmortem.
Datadog’s CEO further complicated things when he urged “everyone” to read the postmortem, a document that wasn’t even available to all customers!
No further public update in the two-and-a-half months since Datadog's biggest outage is also a lowlight. It is not uncommon for companies to take time to produce a public postmortem. For example, Roblox took nearly three months to publish the incident review of its 3-day outage.
However, Datadog is a developer tooling company whose customers include software engineers – unlike Roblox whose customers are mainly young gamers. Datadog has been a public advocate for outage management best practices, and claims it’s possible to write “faster postmortems with Datadog.”
But when it came to an outage of its own, the company was slower in producing this artifact than almost all other developer tooling providers had been. For example, it took Atlassian 3 weeks to publish its postmortem following its longest outage. Datadog competitor Honeycomb published a postmortem about a service degradation and ingestion problems within one day.
Meanwhile, when it comes to transparency and sharing incident reviews quickly, few companies come close to Cloudflare. The company tends to share postmortems by the next day – and sometimes on the same day. Here are the last three outage reports:
Cloudflare incident on 24 Jan 2023 – published on 25 Jan
Partial Cloudflare outage on 25 Oct 2022 – published on 26 Oct
Cloudflare outage on 21 June 2022 – published the same day, despite being a complex, highly impactful global outage.
I talked with engineers at Datadog who shared that the challenge of the postmortem is that it has involved dozens of teams, who all had input. Collecting and recording these observations takes time. But from the outside, none of this is visible. This sluggishness suggests the company has plenty of catching up to do in producing timely incident summaries.
While Datadog did many things well in handling its outage, my take is that it dropped the ball on communication, and by being slow to release the postmortem. I reached out to Datadog last week to ask when their postmortem was due. The company said it is working on it, but could not give an ETA.
7. Learnings
What learnings are there in Datadog’s outage and how it handled the situation?
Some services are more important to customers than others. Always restore these first. In the postmortem, Datadog shared one key learning:
“We heard time and time again that there is a clear hierarchy among the data we process on our customers’ behalf. Most importantly, usable live data and alerts are much more valuable than access to historical data. And even among all the live data, data that is actively monitored or visible on dashboards is more valuable than the rest of live data. We will take this clear hierarchy into account in how we handle processing and access in degraded mode.”
I’m happy Datadog had this realization, and focused on getting live data and alerts up and running, before starting to backfill.
Compare this with Atlassian, which fumbled its incident response during its 2-week outage. All Atlassian products went down: OpsGenie (monitoring and alerting,) JIRA (ticketing) and Confluence (documents.) For some reason, Atlassian did not prioritize restoring the real time monitoring and alerting system, despite this system being far more critical than its ticketing system or wiki. As a result, customers moved off OpsGenie and to a competitor. While responsible companies can get by for 2 weeks without JIRA and Confluence, they need an incident alerting tool to operate reliably.
It’s hard to test your whole system updating. Datadog has chaos tests in place which simulate failures, often by simply shutting down machines or services. But issues with systemd-networkd were not identified, nor what happens when tens of thousands of virtual machines update at the same time.
To its credit, Datadog is now considering testing what happens when most of its infrastructure goes down. The plan is to ensure Datadog can still operate in a heavily degraded state; for example, by only having urgent data accessible and processed. This is a promising direction, and I hope the company shares more in its public postmortem.
Communication is king. Almost my entire critique of Datadog’s outage focuses on inadequate communication during the outage and afterwards. My focus is not how engineering handled the problem. Indeed, this was effective: the incident was raised in a timely manner, live services were prioritized first, and mitigation happened reasonably fast, given the catastrophic outage.
I’ve spoken with engineers working on the postmortem who say they feel Datadog is extremely transparent. But this perception couldn’t be further removed from the view outside of the company: little communication, and the selective sharing of postmortems with customers. This suggests communication is siloed, which risks the impression of not being open about what really happened.
Again, this is all just perception. But communication matters greatly in shaping perceptions, which in turn help shape reality. Datadog had between 500 - 600 engineers working tirelessly to shorten the outage and achieve full recovery. And yet, the company does not seem to have invested in even one dedicated person to provide standout communication. Datadog is far below the standard set by Cloudflare for incident handling, of making public a preliminary postmortem within one or two business days of a global incident being resolved.
Takeaways
It’s interesting to consider how much Datadog did to avoid a global outage: operating a multi-cloud, multi-region, multi-zone setup with separate infrastructure control planes per region. But despite these efforts, the unforeseen event of a parallel operating system update —and the impact of this update—brought it down. This is a reminder that prevention is just as important as mitigation.
Overall, my read on Datadog’s incident response is that it was largely on-point. A few things were done well:
Declared the incident publicly, reasonably quickly
Prioritized restoring the most important parts of the system first: live monitoring and alerting
Once there was an ETA of “hours” until restoration, this was communicated publicly and delivered
The company dropped the ball in communicating the incident:
Frequent but very generic updates with almost no new information for the first ~14 hours of the outage
After mitigation, the company was selective in sharing a initial postmortem and a full postmortem with customers
Datadog has been unexpectedly slow in producing a public postmortem, even though it distributed a 4-page postmortem document to some customers nearly two months ago
The CEO implying a postmortem was publicly accessible when it was not, and not issuing a correction about this.
Datadog has treated its outage as a blameless incident, despite the financial hit it took. The thing I’d like to highlight is how mature the company has been in dealing with this incident, despite suffering the loss of around 1% of quarterly revenue.
I’ve talked with engineers and engineering managers inside the company, and got no sense of finger-pointing going on. The focus is on what the team can learn from the sobering incident, and how to make their system more resilient to system updates and potential outages that could take most infrastructure offline.
It’s much cheaper to learn from other businesses' mistakes than from your own. Could a similar outage happen at your company? How would you respond if most of your infrastructure updated or restarted simultaneously? What is the runbook to follow if virtual machines start to suddenly go offline? Do you have an incident communication plan on how to keep customers in the loop during a high-profile outage?
There’s lots of food for thought in Datadog's outage, and I hope this deep dive into it helps you optimize your own systems to be more resilient.
Updates to the article:
16 May: added details on Douglas Camata’s observation on systemd and Cilium having issues in the past. Added details after Datadog published their postmortem —presumably as a response to this article.
17 May: made updates to clarify that there were no OS reboots; it was systemd that re-executed itself.
Featured Pragmatic Engineer Jobs
Full-Stack Engineer at Farmlend. £85-95K + equity. London.
Senior Backend Engineer at Farmlend. £85-95K + equity. London.
Senior Full Stack Engineer at Perfect Venue. $150-180K + equity. San Francsico or Remote (US).
Full-Stack Engineer at Vital. $70-120K + equity. Remote (Global, within 5 hours of GMT).
Backend Engineer at Vital. $70-120K + equity. Remote (Global, within 5 hours of GMT).
Senior Frontend Engineer at Pento. £80-92K + equity. Remote (EU, EEA, UK).
Lead Backend Developer at Cineville. €53-79K + equity. Amsterdam.
Technical Lead - Platform at Vannevar Labs. Remote (US).
Senior Software Engineer, Fullstack at Vannevar Labs. Remote (US).
Expert DevOps Engineer at Zivver. Amsterdam.
Senior Mobile Developer (React Native) at Peppy. Remote (UK).
Head of Data at Peppy. Remote (UK).
Senior Software Engineer, Distributed Systems at Mixpanel. $200-270K + equity. New York, San Franciso, Seattle or Remote (US).
Senior Software Engineer, Fullstack at Mixpanel. $200-270K + equity. New York, San Franciso, Seattle or Remote (US).
Front-end Product Developer at Whimsical. $94-118K. Remote (EU, UK).
Senior Full Stack Developer at BENlabs. $140-190K. Brazil, UK, US or Remote.
Senior Engineer at Sixfold AI. New York.
Principal Engineer at Shoplift. $185-205K. New York.
See more senior engineer and leadership roles with great engineering cultures on The Pragmatic Engineer Job board - or post your own.
Hire Faster With The Pragmatic Engineer Talent Collective
If you’re hiring software engineers or engineering leaders, join The Pragmatic Engineer Talent Collective. It’s the #1 talent collective for software engineers and engineering managers. Get weekly drops of outstanding software engineers and engineering leaders open to new opportunities. I vet every software engineer and manager - and add a note on why they are a standout profile.
Companies like Linear use this collective to hire better, and faster. Read what companies hiring say. And if you’re hiring, apply here:
If you’re open for a new opportunity, join to get reachouts from vetted companies. You can join anonymously, and leave anytime:
Recommend
About Joyk
Aggregate valuable and interesting links.
Joyk means Joy of geeK
