

Prometheus高可用自动分区方案
source link: https://qingwave.github.io/prometheus-auto-federation/
Go to the source link to view the article. You can view the picture content, updated content and better typesetting reading experience. If the link is broken, please click the button below to view the snapshot at that time.

Mar 30, 2021 · cloud
Prometheus高可用自动分区方案
在Prometheus 分区实践中我们介绍了使用集群联邦与远程存储来扩展 Prometheus 以及监控数据持久化,但之前的分区方案存在一定不足,如分区配置较难维护,全局 Prometheus 存在性能瓶颈等,本文通过Thanos+Kvass实现更优雅的 Prometheus 扩展方案。
之前分区方案依赖 Prometheus 提供的hashmod方法,通过在配置中指定hash对象与modules进行散列(md5),每个分片只抓取相同 job 命中的对象,例如我们可以通过对node散列从而对cadvisor、node-exporter等 job 做分片。
通过这种方式可以简单的扩展 Prometheus,降低其抓取压力,但是显而易见hashmod需要指定散列对象,每个 job 可能需要配置不同的对象如node、pod、ip等,随着采集对象增多,配置难以维护。直到看见了Kvass,Kvass 是一个 Prometheus 横向扩展方案,可以不依赖hashmod动态调整 target,支持数千万 series 规模。
Kvass 核心架构如下:
Kvass-Coordinator: 加载配置文件并进行服务发现,获取所有 target,周期性分配 target 到kvass-sidecar,以及管理分片负载与扩缩容Kvass-Sidecar: 根据Coordinator分发的 target 生成配置,以及代理 Prometheus 请求
通过 Kvass 可实现 Prometheus 动态横向扩展,而不依赖hashmod,灵活性更高。
另一个问题是在集群联邦中我们需要一个全局的 Prometheus 来聚合分区 Prometheus 的数据,依赖原生的/federate接口,随着数据量增多,全局 Prometheus 必然会达到性能瓶颈。高可用 Prometheus 集群解决方案Thanos中提供了全局查询功能,通过Thanos-Query与Thanos-Sidecar可实现查询多个 Prometheus 的数据,并支持了去重。
Thanos 组件较多,核心架构如下:
Thanos Query: 实现了Prometheus API,将来自下游组件提供的数据进行聚合最终返回给查询数据的 client (如 grafana),类似数据库中间件Thanos Sidecar: 连接 Prometheus,将其数据提供给Thanos Query查询,并且可将其上传到对象存储,以供长期存储Thanos Store Gateway: 将对象存储的数据暴露给Thanos Query去查询Thanos Ruler: 对监控数据进行评估和告警,还可以计算出新的监控数据,将这些新数据提供给Thanos Query查询并且可上传到对象存储,以供长期存储Thanos Compact: 将对象存储中的数据进行压缩和降低采样率,加速大时间区间监控数据查询的速度
借助于 Thanos 提供的Query与Ruler我们可以实现全局查询与聚合。
Kvass+Thanos可实现 Prometheus 自动扩展、全局查询,再配合Remote Wirite实现数据支持化,通过 Grafana 展示监控数据
所有部署文件见prometheus-kvass
git clone https://github.com/qingwave/kube-monitor.git
kubectl apply -f kube-monitor/prometheus-kvass
结果如下:
$ kubectl get po
NAME                                 READY   STATUS    RESTARTS   AGE
kvass-coordinator-7f65c546d9-vxgxr   2/2     Running   2          29h
metrics-774949d94d-4btzh             1/1     Running   0          10s
metrics-774949d94d-558gn             1/1     Running   1          29h
metrics-774949d94d-gs8kc             1/1     Running   1          29h
metrics-774949d94d-r85rc             1/1     Running   1          29h
metrics-774949d94d-xhbk9             1/1     Running   0          10s
metrics-774949d94d-z5mwk             1/1     Running   1          29h
prometheus-rep-0-0                   3/3     Running   0          49s
prometheus-rep-0-1                   3/3     Running   0          48s
prometheus-rep-0-2                   3/3     Running   0          19s
thanos-query-b469b648f-ltxth         1/1     Running   0          60s
thanos-rule-0                        1/1     Running   2          25h
Deployment metrics有 6 个副本,每个生成 10045 series,kvass-coordinator配置每个分区最大 series 为 30000,以及 Prometheus 默认的指标,需要 3 个 Prometheus 分片。
每个分片包含 2 个 target
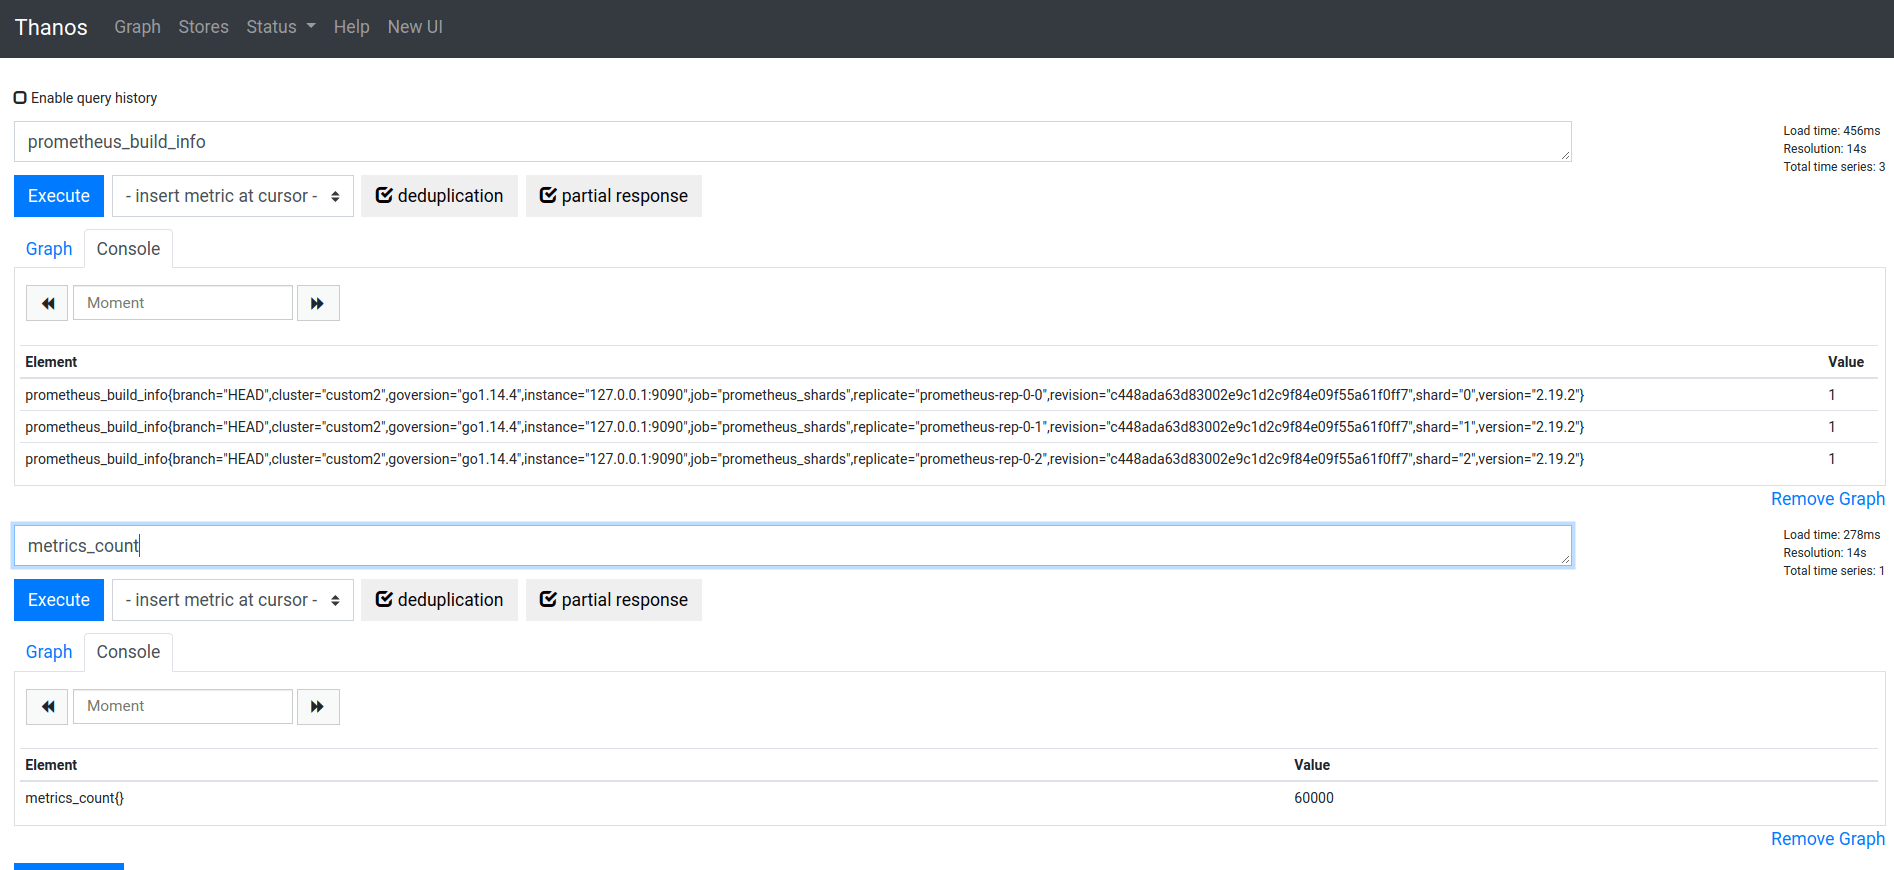
prometheus_tsdb_head_chunks{instance="127.0.0.1:9090",job="prometheus_shards",replicate="prometheus-rep-0-0",shard="0"} 20557通过Thanos Query可以查询到多个 Prometheus 分片的数据,以及聚合规则metrics_count
待优化问题
此方案可满足绝大部分场景,用户可通过自己的实际环境配合不同的组件,但也存在一些需要优化确认的问题
Thanos Ruler不支持远程写接口,只能存储于 Thanos 提供的对象存储中Thanos Query全局查询依赖多个下游组件,可能只返回部分结果挺好使Coordinator性能需要压测验证
Kvass+Thanos+Remote-write可以实现 Prometheus 集群的自动分区、全局查询、数据持久化等功能,满足绝大部分场景。虽然有一些问题需要验证优化,但瑕不掩瑜,能够解决原生 Prometheus 扩展性问题。
Recommend
About Joyk
Aggregate valuable and interesting links.
Joyk means Joy of geeK