

Proportional Euler Diagram
source link: https://blogs.sas.com/content/graphicallyspeaking/2014/06/29/proportional-euler-diagram/
Go to the source link to view the article. You can view the picture content, updated content and better typesetting reading experience. If the link is broken, please click the button below to view the snapshot at that time.

Proportional Euler Diagram
The topic of VENN diagrams had come up a while ago. At that time, I thought it may be interesting to build a proportional VENN diagram. But, reading up on VENN Diagrams, I learned that VENN diagrams represent all intersections of N sets, regardless of whether there are actually any observations in one of the regions. So, there did not seem any purpose to make a proportional VENN diagram, and maybe the term itself is an oxymoron.
I was interested in a graphical representation of the number of different types of subjects in a study, say subjects with Diabetes, or Hypertension or both. It turns out, Euler Diagrams do represent the real world data, and not all theoretical combination. So, it would make sense to draw a Proportional Euler Diagram.
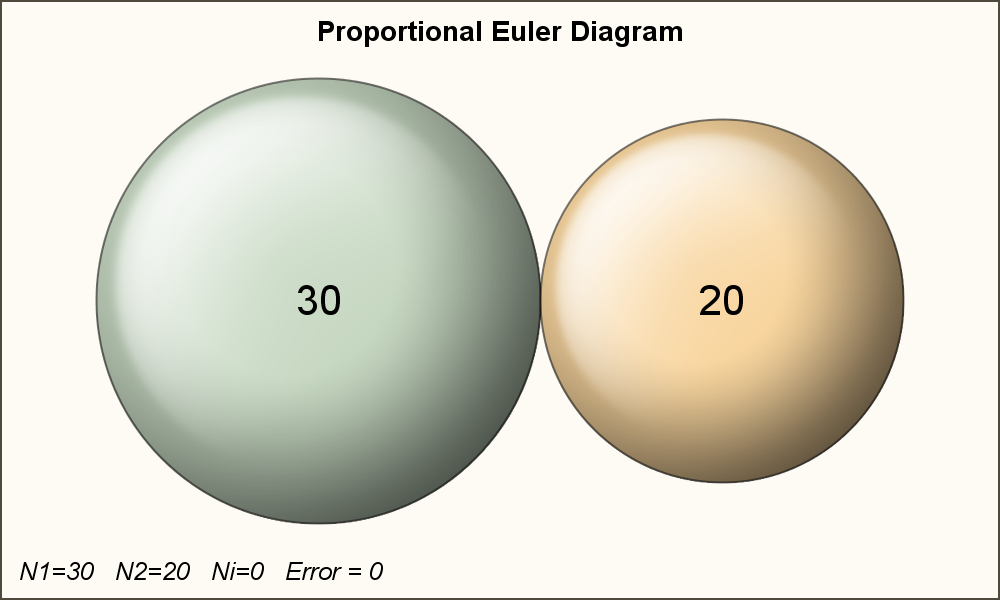
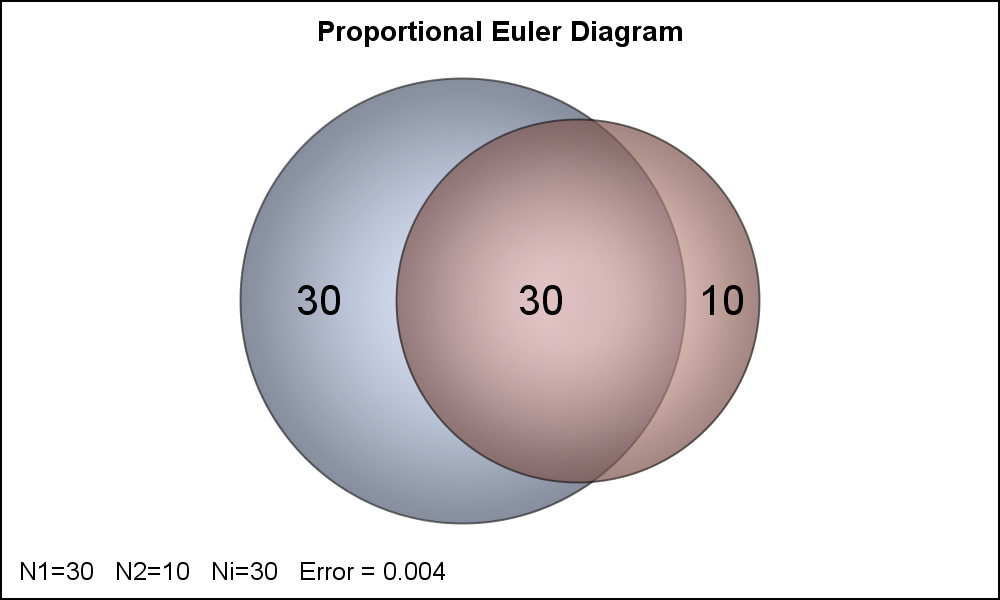
I started with the simple 2-Set case, as it seems achievable. The results are shown on the right. The values for N1, N2 and NI are also
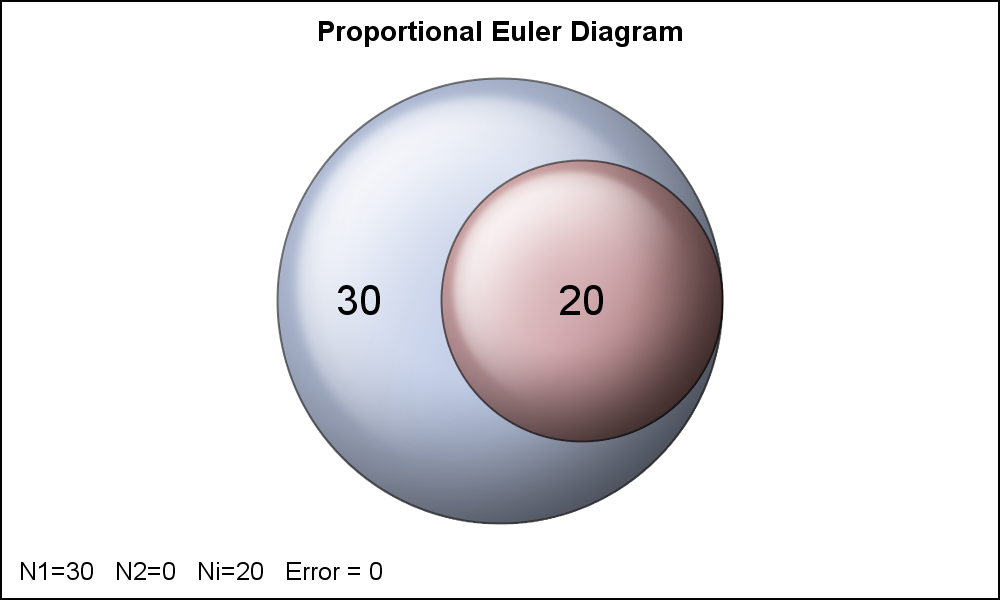
shown in the footnote, along with the value of the convergence error. The two special cases are shown on the right, and are straightforward. Click on the graphs for a higher resolution image.
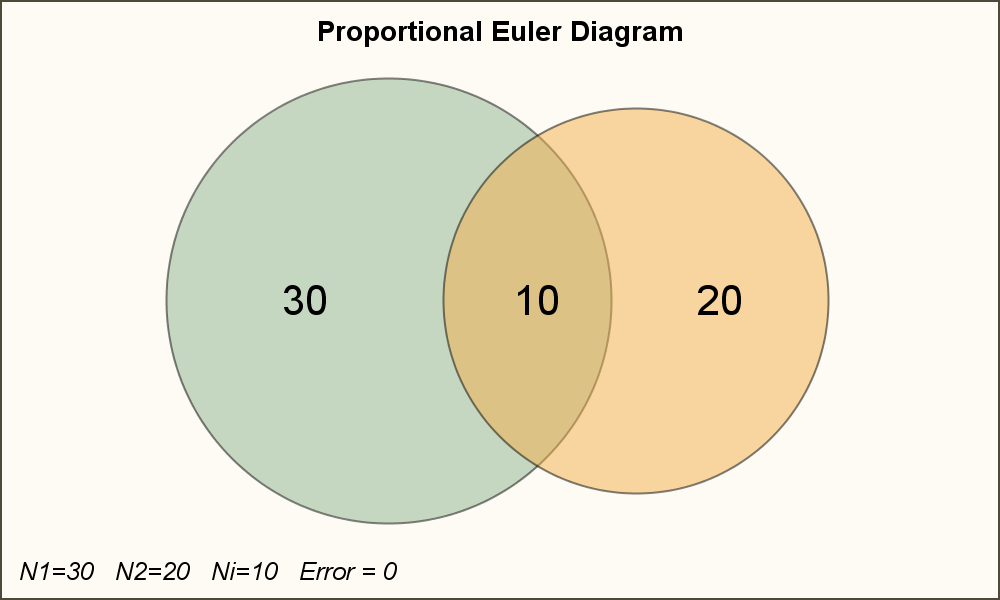
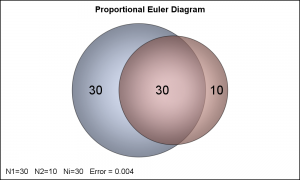
The two cases with intersecting circles are shown below. For the first one, the numbers are such that the intersection point of the two circles lies in-between the centers of the two circles. For the second case, the intersection lies to the right of the smaller circle.
In all cases, the radius of the larger circle is set to 10 (arbitrary), and I compute the area of the smaller circle proportional to the number of observations in the circles.
Here are the details of my program:
- N1, N2 and NI are the number of observations in Set 1, Set 2 and intersection ONLY.
- So, N1+NI is first circle, and N2+NI is the 2nd circle, and NI is the intersection.
- N1 >= N2.
- Special case #1 -> NI=0. This means the two circles are non-overlapping.
- Special case #2 -> N2=0. This means the circle 2 is fully inside circle 1.
- Case #3 -> the intersecting vertical line is between center 1 and center 2.
- Case #4 -> the intersection vertical line is to the right of centers #2.
Here is the algorithm:
- First, I assign v - height of the intersection above centerline = 1.
- Compute the three different areas.
- Compute the area per observation in each section.
- Then, based on the ratio of ANI / AN1, I adjust v by the error ratio. V is kept < r2.
- I repeat this while the error is > 0.001 and number of iterations < N.
- Now, if the error is still > 0.001, convergence is not reached and the intersection is to the right of the center 2.
- Now, set v=0.99999*r2 and repeat the same computations above, with reducing v.
I assume convergence is reached, and based on this value of v, I compute the horizontal distance from center of each circle to the intersection, d1 and d2 and other numbers needed to plot the details.
I can use the ELLIPSEPARM or BUBBLE (RelativeScale=False) statement to draw the plot. However, SGPLOT procedure does not support these statements (not in the 80-20 range for simple plots). So, I used GTL, with the BubblePlot because I wanted to use skins.
I made it into a macro, with three parameters N1, N2 and NI. Skin is optional. If you have a need for Proportional Euler Diagrams in your work, please chime in and let me know if this is useful to you. Maybe you have made one of your own and I would love to hear how you went about solving for the intersection areas.
VENN diagram shapes for 2, 3, 4 and more sets are available on the web, would be possible to make these using EllipseParm statement for both circles and ellipses.
I plan to tackle the case of the 3 set Proportional Euler Diagram. This same algorithm may not extend to this case. I would love to hear your ideas.
Full GTL Macro program: Euler_Bubble_Macro
Recommend
About Joyk
Aggregate valuable and interesting links.
Joyk means Joy of geeK