

Performance 模式帶來更佳效能體驗,3 風扇 ASUS TUF Gaming GeForce RTX 4070 實測
source link: https://benchlife.info/tuf-gaming-geforce-rtx-4070-with-performance-mode-review/
Go to the source link to view the article. You can view the picture content, updated content and better typesetting reading experience. If the link is broken, please click the button below to view the snapshot at that time.

Performance 模式帶來更佳效能體驗,3 風扇 ASUS TUF Gaming GeForce RTX 4070 實測

應該是整個 GeForce RTX 4070 系列顯示卡測試的最後一張(應該…
從 Founders Edition、Dual、WindForce OC、Gaming X Trio 到這次的 TUF Gaming GeForce RTX 4070,共計有 5 款 GeForce RTX 4070 顯示卡測試出現在我們網站上。
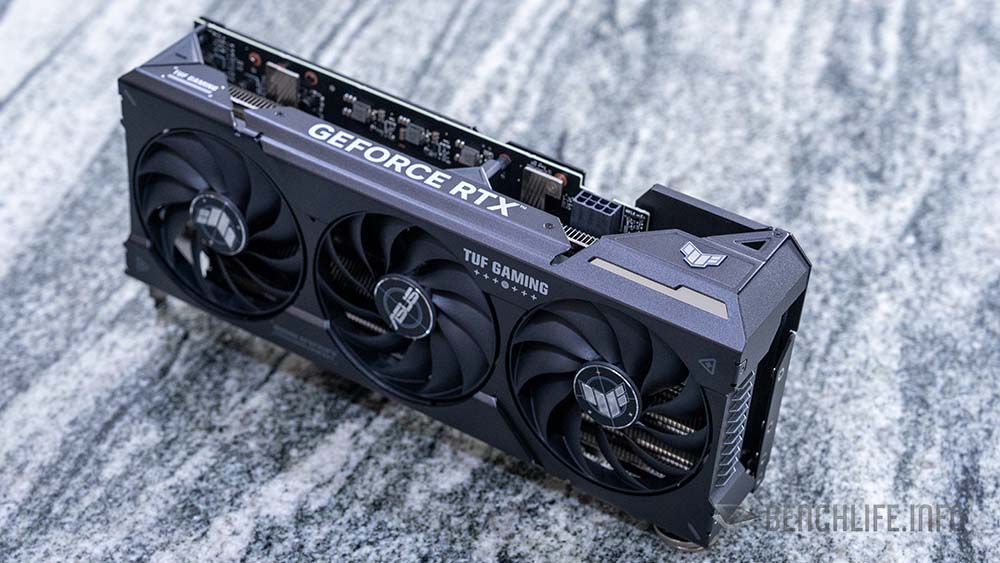
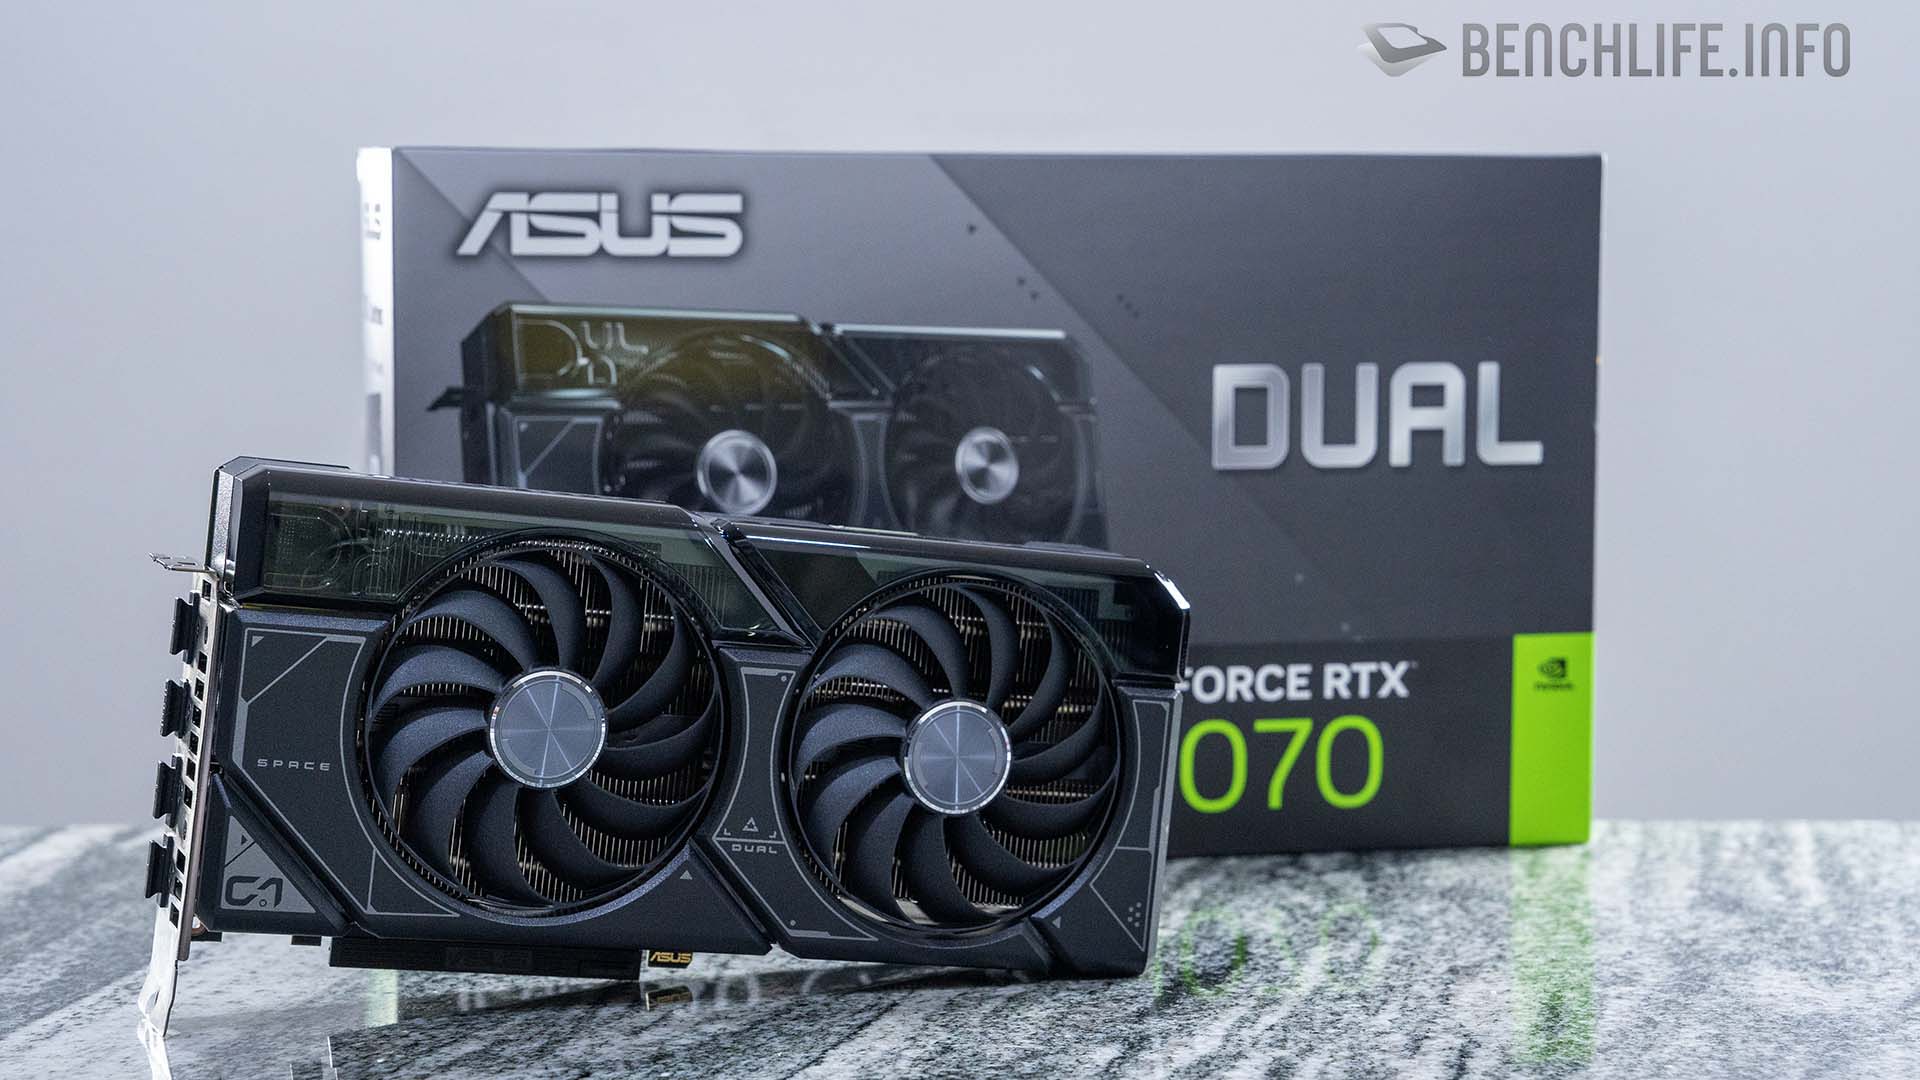
TUF Gaming GeForce RTX 4070 也是一款採用 3 風扇散熱設計(301 x 139 x 63mm),3.15 槽的顯示卡。
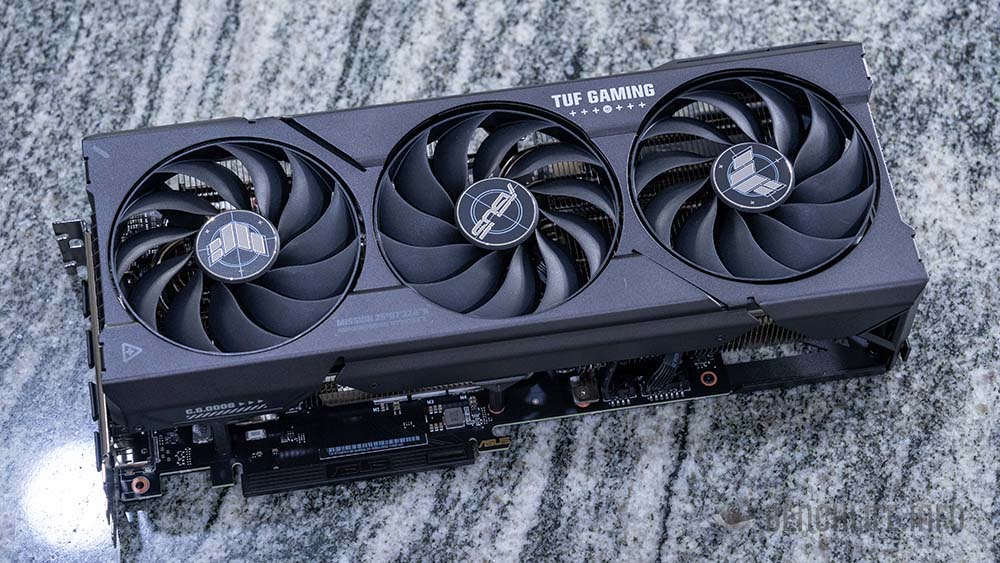
相較於 GIGABYTE GeForce RTX 4070 WindForce OC 的小,與 MSI GeForce RTX 4070 Gaming X Trio 的大,ASUS TUF Gaming GeForce RTX 4070 的 3 風扇散熱器設計讓我們覺得「剛剛」好。
與 Dual GeForce RTX 4070 相同,3.25 槽的 TUF Gaming GeForce RTX 4070 散熱器也採用 Axial—Tech 風扇,同時也導入 Dual Ball Bearing 軸承;相較於 Sleeve 來說,Dual Ball Bearing 可以提供更長的壽命。
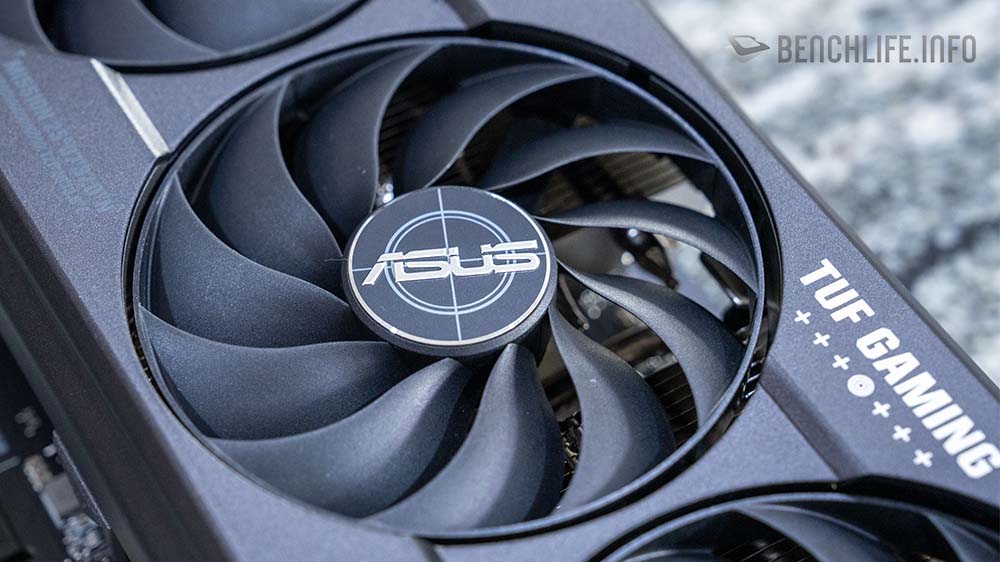
另一方面,這款顯示卡擁有 0dB 功能,也就是說顯示卡風扇在 50°C 以下將不會轉動,風扇轉動溫度設定在 55°C。
同時,TUF Gaming GeForce RTX 4070 風扇也是正逆轉設定。
搭配上 Axial-Tech 風扇與正逆轉與 0dBA 功能,TUF Gaming GeForce RTX 4070 顯示卡散熱器採用 6 根 8mm 熱導管設計,至於散熱表現如何,繼續往下看就能夠了解。
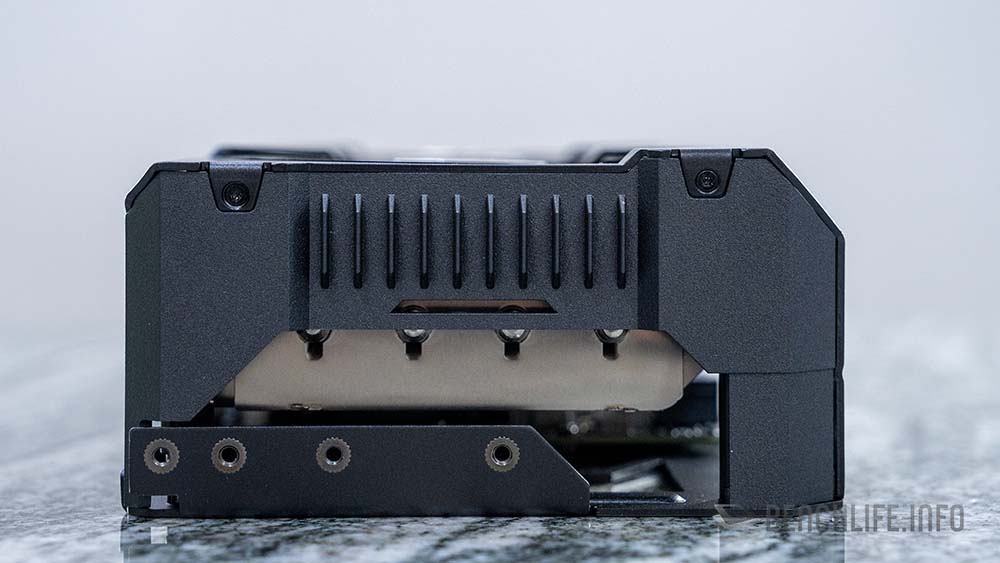
雖然是非 MSRP 的 GeForce RTX 4070,但是 TUF Gaming GeForce RTX 4070 顯示卡採用單 PCIe 8 PIN 供電設計,使用者可以不用擔心轉接線或者是沒有 12VHPWR 電源供應器而煩惱。
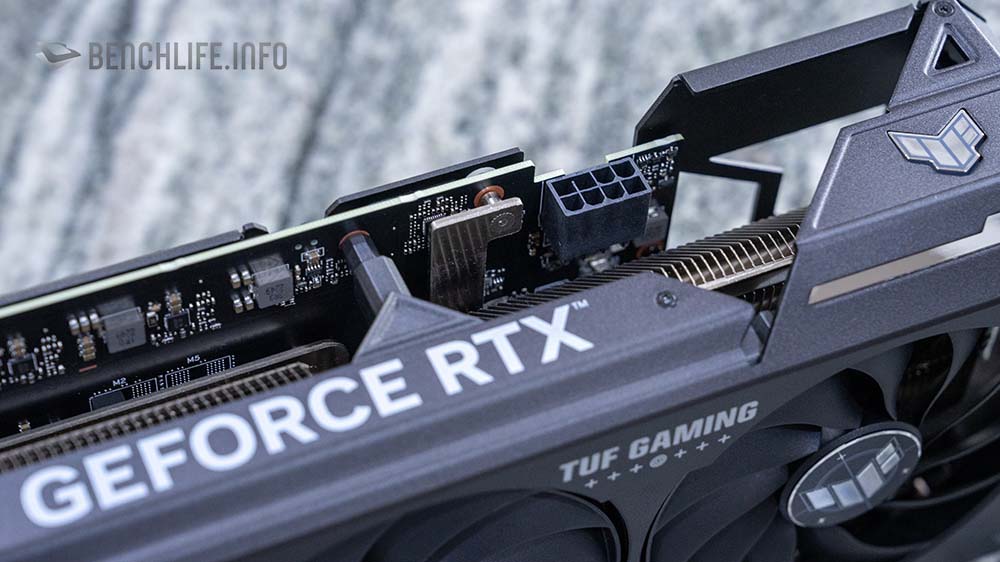
當然,TUF Gaming GeForce RTX 4070 顯示卡也有 AURS Sync 的 ARGB 燈光效果。
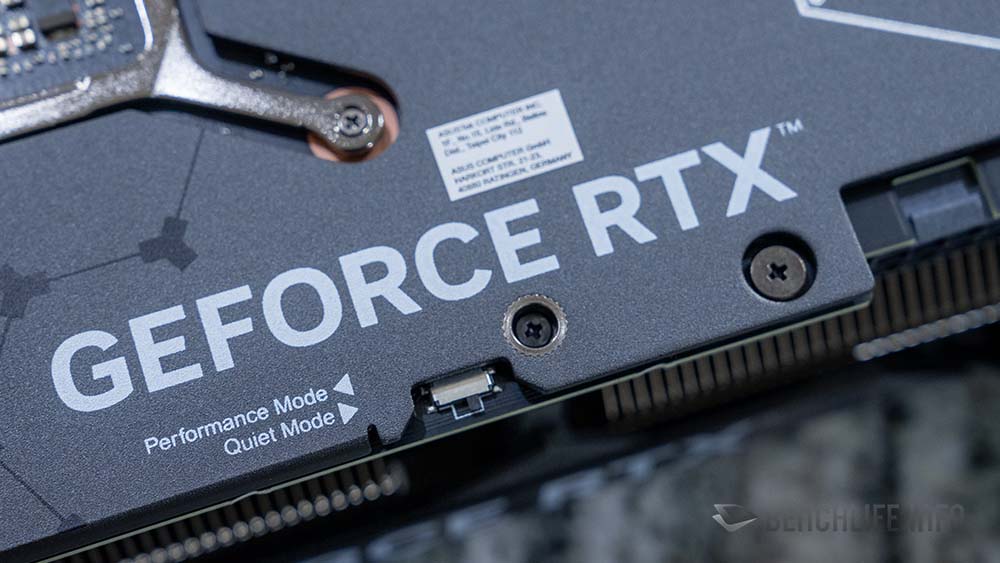
Dual GeForce RTX 4070 擁有 Performance Mode 與 Quiet Mode 2 個 vBIOS 外,TUF Gaming GeForce RTX 4070 當然也不能少。
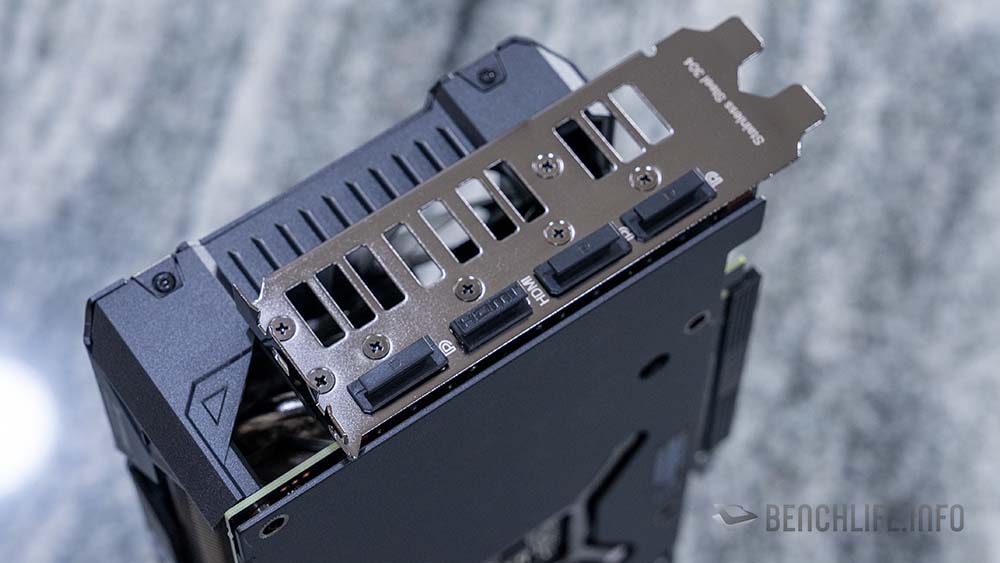
304 Stainless Steel 的 Bracket 當然也能在 TUF Gaming GeForce RTX 4070 上見到,而這款顯示卡的輸出配置為 DP|HDMI|DP|DP 配置,與 Dual GeForce RTX 4070 相同,但與 Founders Edition 的 DP|DP|DP|HDMI 有所不同。
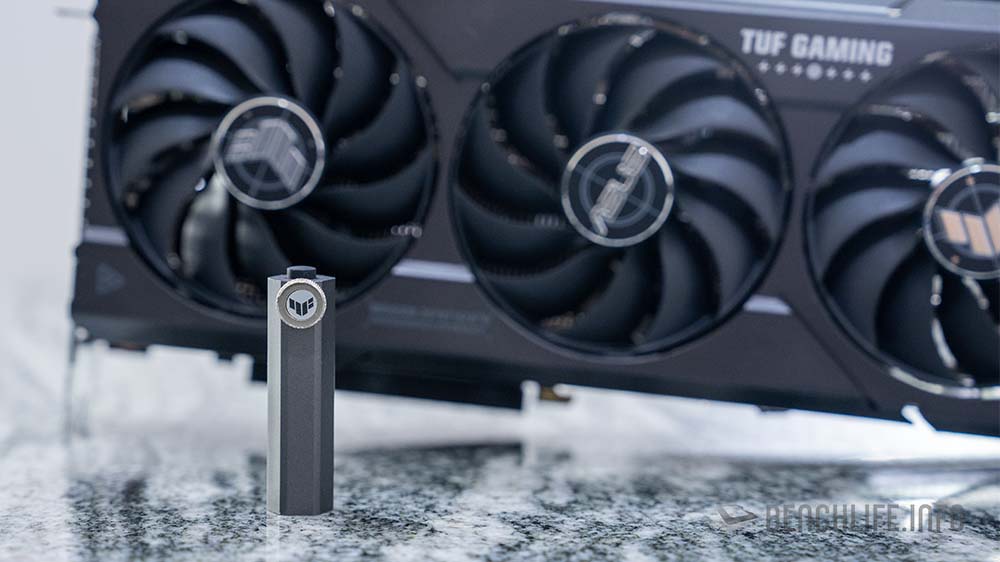
ASUS TUF Gaming GeForce RTX 4070 也有附贈一組擁有螺絲起子功能的顯示卡支撐架。
接下來就是看看 ASUS TUF Gamign GeForce RTX 4070 的效能表現,但不同的是,這次我們使用 GeForce RTX 3080 Founders Edition 與之進行比較。
測試平台
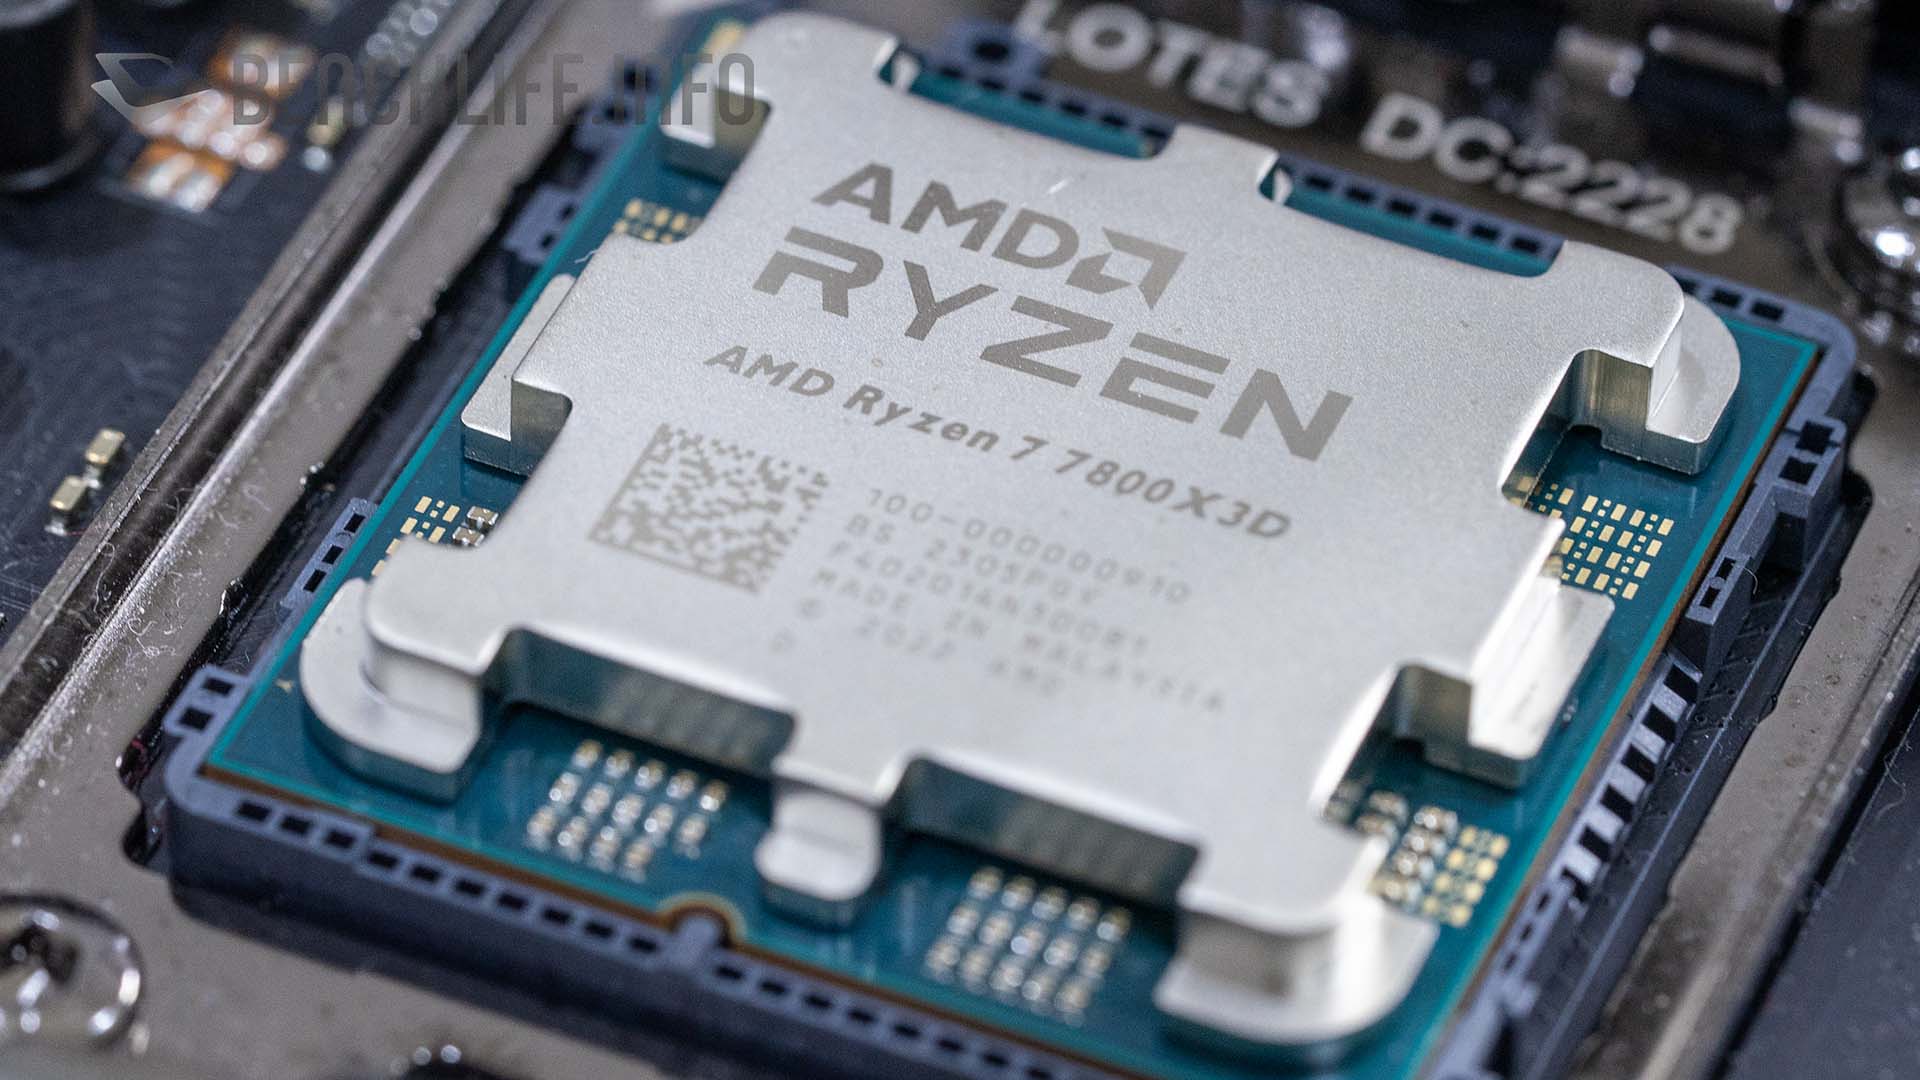
CPU – Intel Core i9-13900K
Motherboard – MSI MEG Z790 GodLike
RAM – G.SKILL Trident Z5 DDR5 6000MT/s 16GB x2
3DMark – NVIDIA GeForce RTX 3080 Founders Edition
| 3DMark | GeForce RTX 3080 Founders Edition | ASUS TUF Gaming GeForce RTX 4070 | |
|---|---|---|---|
| TIme Spy | 18419 | 18986 | 2.986% |
| Graphic score | 17754 | 18365 | 3.327% |
| CPU score | 23388 | 23488 | 0.426% |
| Time Spy Extreme | 9311 | 9285 | -0.280% |
| Graphic score | 8808 | 8781 | -0.307% |
| CPU score | 13779 | 13775 | -0.029% |
| Fire Strike | 38038 | 38815 | 2.002% |
| Graphic score | 43636 | 44839 | 2.683% |
| Physics score | 56138 | 55790 | -0.624% |
| Combo score | 15553 | 15754 | 1.276% |
| Fire Strike Extreme | 21748 | 21703 | -0.207% |
| Graphic score | 21670 | 21846 | 0.806% |
| Physics score | 56020 | 56064 | 0.078% |
| Combo score | 11503 | 11028 | -4.307% |
| Fire Strike Ultra | 11436 | 10720 | -6.679% |
| Graphic score | 11028 | 10305 | -7.016% |
| Physics score | 56044 | 56070 | 0.046% |
| Combo score | 5968 | 5611 | -6.363% |
| Port Royal | 11629 | 11445 | -1.608% |
| Ray Tracing | 48.05 | 52.93 | 9.220% |
| Speed Way | 4647 | 4533 | -2.515% |
| DLSS Feature test | |||
| native | 25.25 | 23.51 | -7.401% |
| DLSS2 | 65.59 | - | - |
| DLSS 3 | - | 87.09 | - |
1440p Gaming – NVIDIA GeForce RTX 3080 Founders Edition
| 1440p | GeForce RTX 3080 Founders Edition | ASUS TUF Gaming GeForce RTX 4070 | |
|---|---|---|---|
| Cyberpunk2077 | 88.08 | 83.83 | -5.070% |
| Cyberpunk2077(RT) | 40.47 | 40.19 | -0.697% |
| Cyberpunk2077(DLSS 3 / DLSS / RSR Quality) | 67.77 | 107.9 | 37.192% |
| F1 22(Ultra) | 79 | 76 | -3.947% |
| F1 22(DLSS 3 / DLSS / FSR) | 110 | 154 | 28.571% |
| Hitman 3 | 196.2 | 191.27 | -2.578% |
| Hitman 3(RT) | 50.69 | 55.5 | 8.667% |
| Hitman 3(DLSS 3 / DLSS / FSR) | 85.64 | 122.19 | 29.912% |
| Portal RTX | 23 | 27.4 | 16.058% |
| Portal RTX(DLSS 3 / DLSS ) | 48.6 | 85.4 | 43.091% |
| Horizon Zero Dawn | 147 | 143 | -2.797% |
| Shadow of the Tomb Raider | 158 | 166 | 4.819% |
| Tom Clancy's Rainbow Six Siege | 503 | 519 | 3.083% |
| Borderlands 3 | 108.4 | 109.85 | 1.320% |
| Total Wars Three Kingdom | 96.7 | 93.1 | -3.867% |
| Metro Exodus | 106.86 | 104.76 | -2.005% |
1080p Gaming – NVIDIA GeForce RTX 3080 Founders Edition
| 1080p | GeForce RTX 3080 Founders Edition | ASUS TUF Gaming GeForce RTX 4070 | |
|---|---|---|---|
| Cyberpunk2077 | 131.56 | 132.13 | 0.431% |
| Cyberpunk2077(RT) | 61.77 | 64.6 | 4.381% |
| Cyberpunk2077(DLSS 3 / DLSS / RSR Quality) | 96.07 | 171.1 | 43.852% |
| F1 22(Ultra) | 113 | 111 | -1.802% |
| F1 22(DLSS 3 / DLSS / FSR) | 149 | 211 | 29.384% |
| Hitman 3 | 285.49 | 284.99 | -0.175% |
| Hitman 3(RT) | 83.87 | 83.91 | 0.048% |
| Hitman 3(DLSS 3 / DLSS / FSR) | 117.11 | 174.89 | 33.038% |
| Portal RTX | 41.5 | 47.9 | 13.361% |
| Portal RTX(DLSS 3 / DLSS ) | 79.3 | 136.6 | 41.947% |
| Horizon Zero Dawn | 178 | 184 | 3.261% |
| Shadow of the Tomb Raider | 220 | 243 | 9.465% |
| Tom Clancy's Rainbow Six Siege | 654 | 699 | 6.438% |
| Borderlands 3 | 150.34 | 157.3 | 4.425% |
| Total Wars Three Kingdom | 149.38 | 147.4 | -1.343% |
| Metro Exodus | 131.3 | 130.79 | -0.390% |
Creator – NVIDIA GeForce RTX 3080 Founders Edition
| Creator | GeForce RTX 3080 Founders Edition | ASUS TUF Gaming GeForce RTX 4070 | |
|---|---|---|---|
| Blender | |||
| Monster | 2549 | 3134 | 18.666% |
| Junk Store | 1579 | 1532 | -3.068% |
| classroom | 1342 | 1536 | 12.630% |
| Vray | |||
| GPU | 2440 | 2695 | 9.462% |
| Pugetbench DaviniCi | |||
| Extended Overall | 2085 | 2185 | 4.577% |
| Standard Overall | 2260 | 2370 | 4.641% |
| 4K Media Score | 178 | 175 | -1.714% |
| 8K Media | 156 | 163 | 4.294% |
| GPU Effects Score | 143 | 129 | -10.853% |
| Fusion Score | 357 | 407 | 12.285% |
| Pugetbench Premiere Pro | |||
| Extended overall score | 1113 | 1081 | -2.960% |
| Standard overall score | 1193 | 1193 | 0.000% |
| Extended export score | 129.6 | 122.7 | -5.623% |
| Extended live playback | 84.8 | 88 | 3.636% |
| Standar Export Score | 136.4 | 137.1 | 0.511% |
| Standar Live Playback Score | 101.9 | 107.3 | 5.033% |
| Effects Score | 119.5 | 113.6 | -5.194% |
| GPU score | 109.9 | 103.5 | -6.184% |
| Stable Diffusion | |||
| 768x768 batch cout 10(it/s) | 4.19 | 4.21 | 0.475% |
| Omniverse Create Viewport(DLSS 3 / DLSS) | |||
| 2K / DLSS Quality | |||
| Campfire(FPS) | 21.16 | 43.23 | 51.053% |
| Flowers4(FPS) | 20.04 | 38.88 | 48.457% |
| incense (FPS) | 7.02 | 43.48 | 83.855% |
| Jade Tiger (FPS) | 15.8 | 32.14 | 50.840% |
| Warehouse(FPS) | 6.82 | 24.48 | 72.141% |
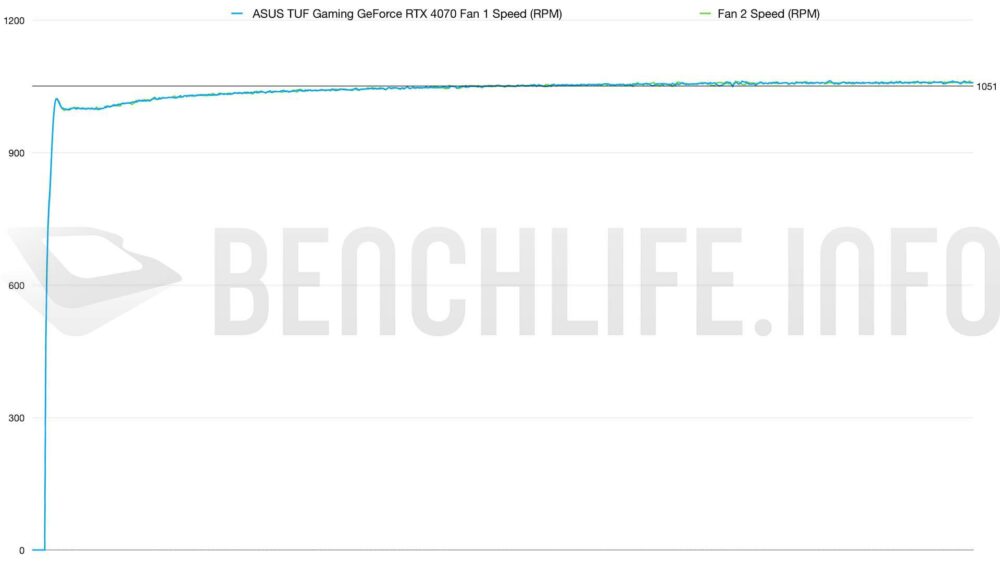
溫度表現方面,我們先來看看 Quiet Mode 的 ASUS TUF Gaming GeForce RTX 4070,在風扇轉速維持在 1051 R.P.M 條件下,GPU 與 Hot Spot 溫度分別是 61.4°C 與 73.9°C,而此時候的 TGP 為 199.6W。
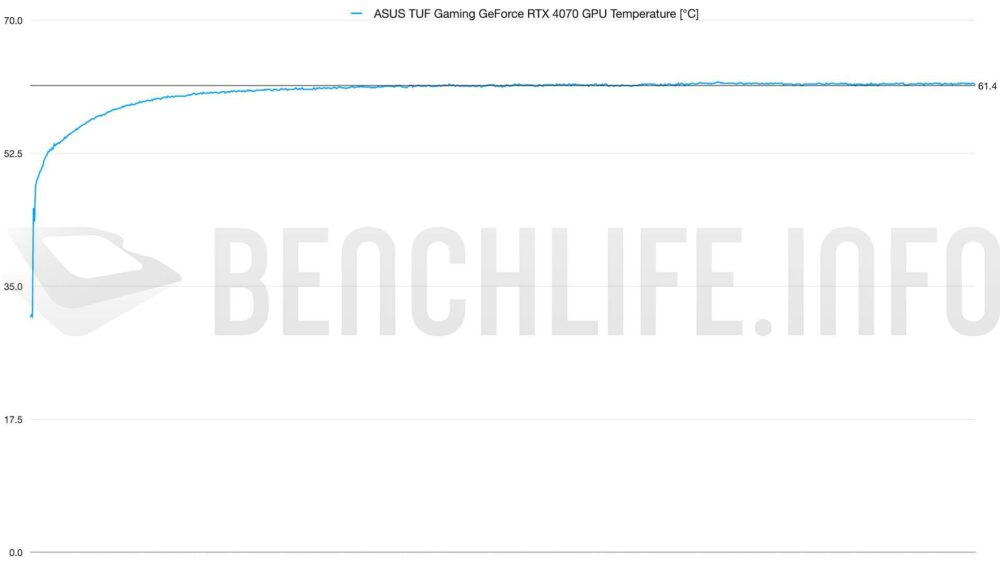
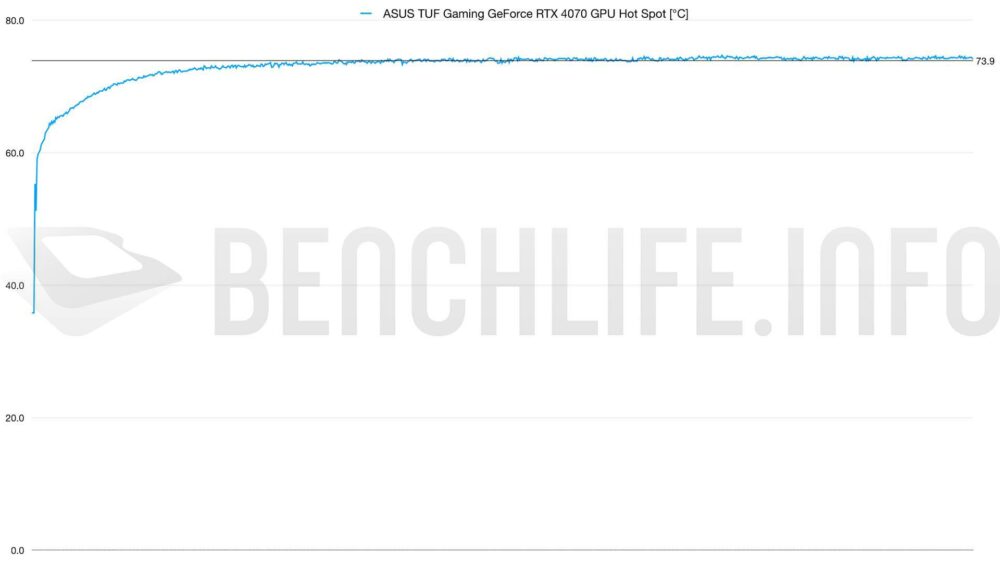
與 2 槽設計的 NVIDIA GeForce RTX 4070 Founders Edition 相比較的話:
GPU TEMP – 64.4 vs 61.4,Δ 3.0°C;
GPU Hot Spot – 76.8 vs 73.9,Δ 2.9°C;
FANS – 1614 vs 1051,Δ 563 R.P.M;
TGP – 191.2 vs 199.6,Δ 8.4W;
前面提到 TUF Gaming 是一款擁有 Quiet Mode 與 Performance Mode 雙 vBIOS 的 GeForce RTX 4070,接下來我們來看看 Performance Mode 的表現。
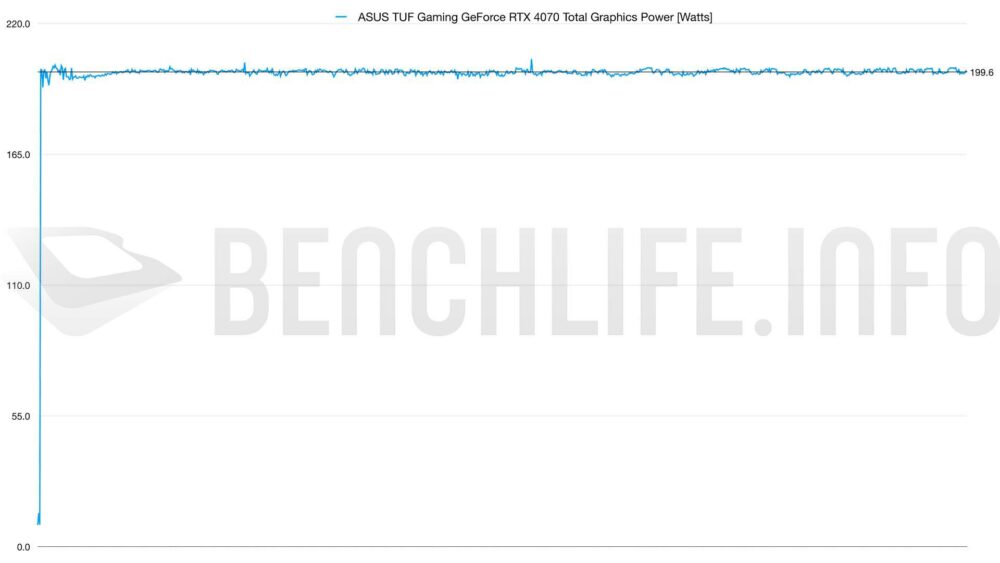
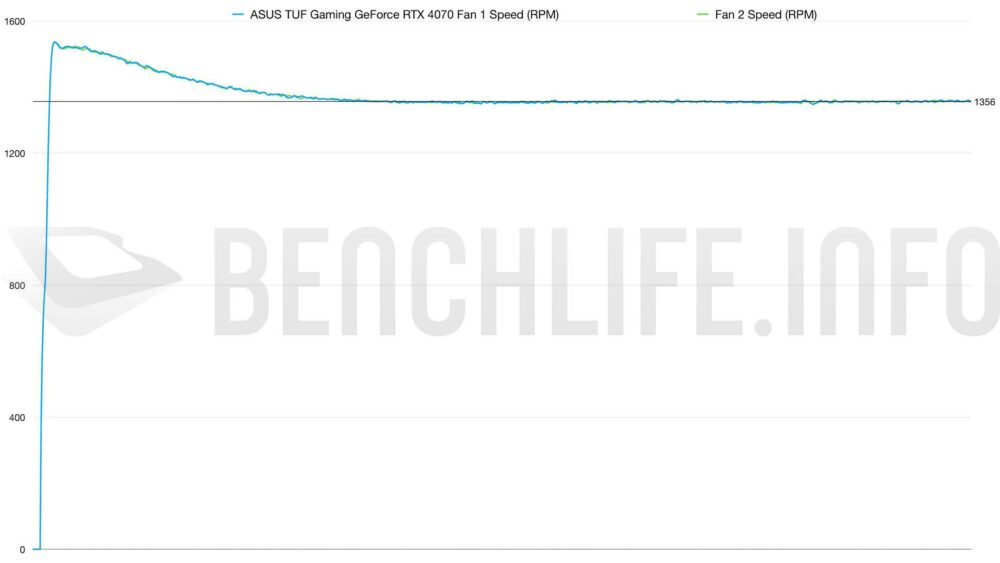
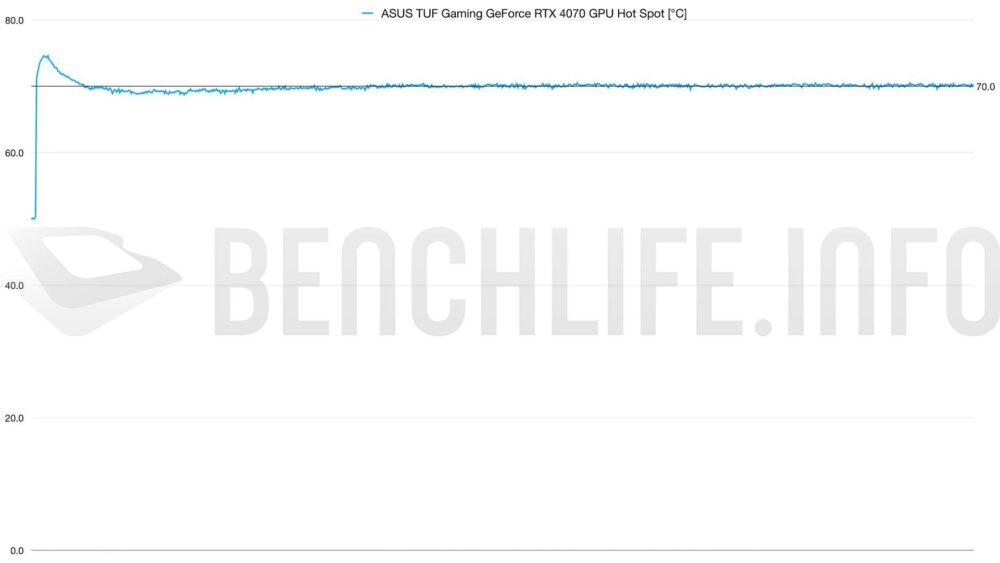
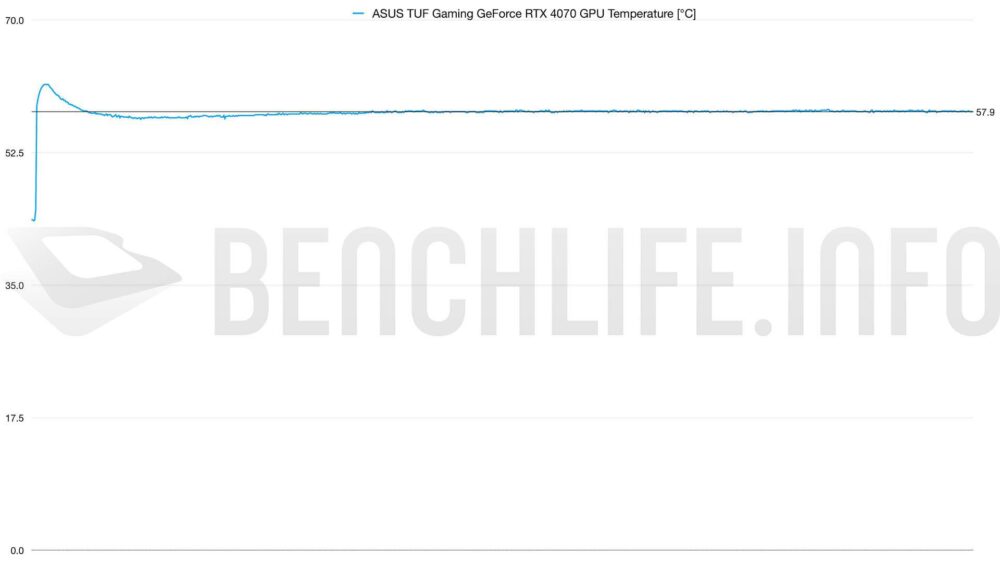
Performance Mode 條件下,風扇轉速來到 1356 R.P.M,GPU 與 Hot Spot 溫度下降到 57.9°C 和 70.0°C。
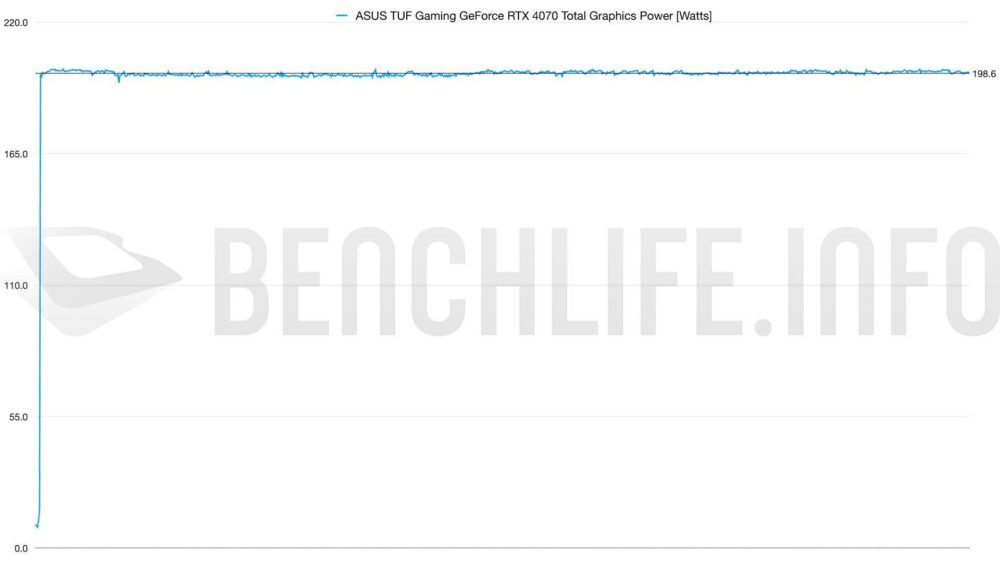
與 Quiet Mode 的 TUF Gaming GeForce RTX 4070 相比較的話:
GPU TEMP – 61.4 vs 57.9,Δ 3.5°C;
GPU Hot Spot – 73.9 vs 70.0,Δ 3.9°C;
FANS – 1051 vs 1356,Δ 305 R.P.M;
TGP – 199.6 vs 198.6,Δ 1W;
Performance vBIOS 明顯讓溫度下降到 57.9°C,雖然風扇轉速來到 1356 R.P.M,但我們裸測條件下,風扇聲音基本上非常小,要貼近才能感受到。
與 GeForce RTX 3080 Founders Edition 相比較的話,TUF Gaming GeForce RTX 4070 的贏面較高,如果是 Ray Tracing 與 DLSS 部分,可以說是 Ada Lovelace 架構的天下。當然,我們也見到 GeForce RTX 3080 在數款遊戲測試中還是領先 GeForce RTX 4070。
NVIDIA GeForce RTX 4070 的 TGP 為 200W,而 GeForce RTX 3080 為 320W,某個程度上可以說 GeForce RTX 4070 表現相當優異。
如果以預設 vBIOS 來看,TUF Gaming GeForce RTX 4070 並不算優異,然而在切換至 Performance vBIOS 後,這張顯示卡的溫度表現發揮了它的水平,如果不在意風扇轉速偏高的話,我們會建議選擇 Performance vBIOS 的設定執行這張顯示卡。
外觀設計部分與 TUF Gaming GeForce RTX 4070 Ti 相同,就不用多介紹。
如果只想挑選 ASUS 的 GeForce RTX 4070,Dual 跟 TUF Gaming 都是不錯的選擇,就看你的機殼想要 2.5 槽、雙風扇設計的 Dual,還是 3.25 槽、3 風扇設計的 TUF Gaming 了。
NVIDIA GeForce RTX 4070 實測
Recommend
About Joyk
Aggregate valuable and interesting links.
Joyk means Joy of geeK