

Means and medians of subgroups
source link: https://blogs.sas.com/content/iml/2023/04/10/means-medians-subgroups.html
Go to the source link to view the article. You can view the picture content, updated content and better typesetting reading experience. If the link is broken, please click the button below to view the snapshot at that time.

Means and medians of subgroups
1A journal article listed the mean, median, and size for subgroups of the data, but did not report the overall mean or median. A SAS programmer wondered what, if any, inferences could be made about the overall mean and median for the data. The answer is that you can calculate the overall mean exactly, but the most you can say about the overall median is that is between the minimum and maximum median of the subgroups. In fact, the result for the median, which is the 50th percentile, extends to any percentile, such as the 25th and 75th percentile. This article illustrates and outlines a proof for these statements.
Means and medians of subgroups
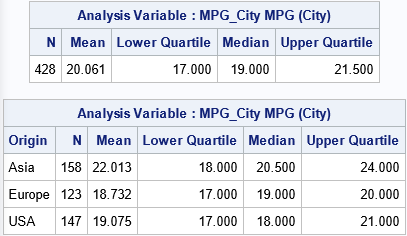
Let's illustrate the situation by using some data. The following call to PROC MEANS in SAS displays two tables of statistics for the MPG_City variable in the Sashelp.Cars data set. The first table shows the overall (unconditional) sample mean, median, 25th percentile, and 75th percentile. The second table shows the (conditional) statistics for three subgroups: vehicles that were manufactured in Asia, Europe, or the USA:
proc means data=sashelp.cars N Mean Q1 median Q3
           printalltypes ndec=3 NoNObs;
   class Origin;
   var MPG_City;
   output out=MeansOut(where=(_TYPE_=1))     /* save stats for subgroups */
          N=N Mean=Mean Q1=Q1 median=Median Q3=Q3;
run; |
By using only the second table, you can compute the N and Mean values in the first table.
Recall that a mean is calculated by dividing a sum by the sample size: Mean = Sum / N.
Therefore, Sum = N*Mean. Accordingly, you can obtain the partial sum of a variable for each subgroup by multiplying the
conditional mean by the size of the subgroup. You can add up all the partial sums and add up the subgroup sizes to obtain the total
sum and total size of the data, thus enabling you to compute the total (unconditional) mean.
In symbols:
Meantotal = (Σ Ni Meani) / (Σ Ni)
The SAS code to compute the total mean from the mean and sizes of the subgroups is as follows:
/* find the overall mean from the means and size of the subgroups */ data TotalMean; keep TotalN TotalSum TotalMean; set MeansOut end=EOF; /* read in stats for subgroups (output from PROC MEANS) */ TotalN + N; /* accumulate subgroup sizes */ TotalSum + N*Mean; /* accumulate partial sums */ if EOF then do; TotalMean = TotalSum / TotalN; output; end; run; proc print data=TotalMean noobs; run; |
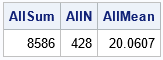
Success! The computation has constructed the mean of the total data from the mean and sample size of the subgroups.
A bound for the total median
Unfortunately, you cannot reconstruct the total median by knowing the median of the subgroups. However, you can construct upper and lower bounds for the total median: The total median is never less than the smallest median of the subgroups, and it is never greater than the largest median of the subgroups. In symbols, if Medmin and Medmax are the smallest and largest medians of subgroups, respectively, then the total median is in the interval [Medmin, Medmax], and the bounds are tight. For more details, see the Appendix to this article.
To illustrate this fact, look back at the output from PROC MEANS. The medians for the three subgroups are 20.5, 19, and 18. Therefore, the total median must be in the interval [18, 20.5]. Sure enough, the total median is 19, which is in the interval.
The same logic applies to other quantiles. For example, the 25th percentiles (lower quartiles) for the three subgroups are 18, 17, and 17. Therefore, the overall 25th percentile must be in the interval [17, 18]. Sure enough, the overall 25th percentile is 17. Similarly, the overall 75th percentile (upper quartile) is 21.5, which is in the interval [20, 24] that is defined by the quartiles for the subgroups (24, 20, and 21).
Summary
If you are given statistics and sizes for subgroups, you cannot always reconstruct the overall statistics for the full data. This article shows that you can reconstruct the overall mean, but not the overall quantiles. However, you can use the quantiles of the subgroups to construct an interval that contains the overall quantiles.
Appendix: Bounds for a quantile when you know the quantiles for subgroups
This section explains why the total median is bounded by the minimum and maximum medians of subgroups. Let M be the median value for a set that has N observations. By definition, 50% of the data are less than or equal to M and 50% are greater than or equal to M. The median might not be a unique value for samples that have an even number of data points. A popular definition is that the sample median is the midpoint of the (N/2)th and (N/2+1)th ordered values when N is even, but there are multiple ways to define the median.
First, consider the case of two subgroups. Let N1 be the size of the first subset and let M1 be its median. Let the second subset be of size N2 with median M2, where N1 + N2 = N. Without loss of generality, define the subsets so that M1 ≤ M2.
Let's show that M1 ≤ M ≤ M2, where M is the overall median. Regardless of the subset sizes N1 and N2, at most 50% of the data values are less than M1 because M1 ≤ M2. Therefore, M1 ≤ M. Similarly, at most 50% of the data values are greater than M2. Therefore, M ≤ M2. Consequently, M must be in the interval, [M1, M2], and it is easy to find examples where the bound is tight.
The same argument applies to k subgroups whose medians are M1 ≤ M2 ≤ ... ≤ Mk. At most 50% of the data values are less than M1, and at most 50% of the data values are greater than Mk. Therefore, M must be in the interval, [M1, Mk].
This argument works for any quantile. For the qth quantile, 0 < q < 1, if Q1 ≤ Q2 ≤ ... ≤ Qk are the sample quantiles for the kth subgroup, then the overall quantile is in the interval [Q1, Qk] because at most 100 q% of the values are less than Q1 and at most 100(1-q)% of the values are greater than Qk.
Recommend
About Joyk
Aggregate valuable and interesting links.
Joyk means Joy of geeK