

How to debug Kubernetes OOMKilled when the process is not using memory directly
source link: https://songrgg.github.io/operation/another-kubernetes-oom-kill-troubleshooting/
Go to the source link to view the article. You can view the picture content, updated content and better typesetting reading experience. If the link is broken, please click the button below to view the snapshot at that time.

How to debug Kubernetes OOMKilled when the process is not using memory directly
We investigated the memory increase problem some time ago and learned a lot about JVM metrics. This happened again, we noticed several Java applications deployed in Kubernetes got the memory usage increasing gradually until it reached the memory limit, even after several times of increasing the memory limit, the usage can always hit above 90%, sometimes the container will be OOMKilled.
A normal process of investigating Java memory
We followed the way we did last time to analyze the memory usage,
Some figures first: container’s memory limit (12 Gi); container’s memory usage (11 Gi)
- check the JVM memory usage
We checked the Java process memory usage (3 Gi) and it was way lower than the app container memory usage (11 Gi)
The Java process was the main process running in the container, no other processes were consuming memory. - native memory tracking
We thought NMT can help us find some native memory leak, so we enabled the native memory tracking and checked different regions, all looked normal.
emmm, what do we miss?
Start from the beginning
Which memory are we talking about
Kubernetes will kill the container when it runs out of its memory limit, the metrics it uses are container_memory_working_set_bytes & container_memory_rss , the container will be killed if either of them exceeds the memory limit.
What’s in it
According to the metric collector cadvisor,
cadvisor fetches this data from the cgroup memory stats in each container’s /sys/fs/cgroup/memory folder, the lwn.net explains this data well.
memory.usage_in_bytes		 # show current memory(RSS+Cache) usage.
memory.memsw.usage_in_bytes	 # show current memory+Swap usage
memory.limit_in_bytes		 # set/show limit of memory usage
memory.memsw.limit_in_bytes	 # set/show limit of memory+Swap usage
memory.failcnt			 # show the number of memory usage hits limits
memory.memsw.failcnt		 # show the number of memory+Swap hits limits
memory.max_usage_in_bytes	 # show max memory usage recorded
memory.memsw.usage_in_bytes	 # show max memory+Swap usage recorded
memory.soft_limit_in_bytes	 # set/show soft limit of memory usage
memory.stat			 # show various statistics
memory.use_hierarchy		 # set/show hierarchical account enabled
memory.force_empty		 # trigger forced move charge to parent
memory.swappiness		 # set/show swappiness parameter of vmscan
...
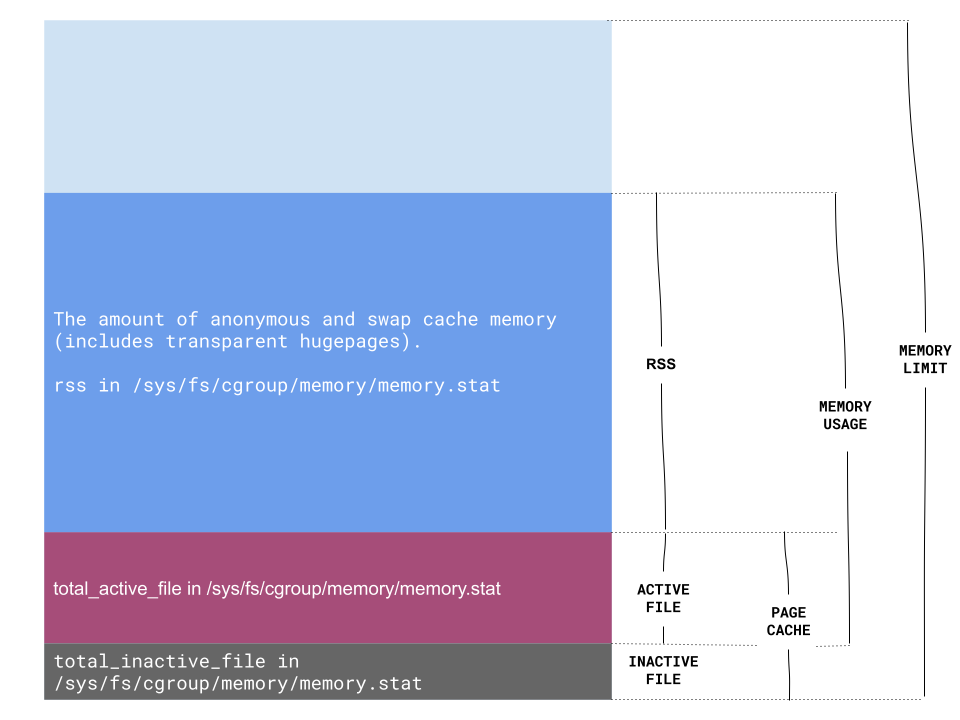
Based on this, the working_set_bytes contains the page cache and memory_rss, we went to the container and printed the memory stats.
bash-4.2$ cat /sys/fs/cgroup/memory/memory.stat
cache 8815085056 # of bytes of page cache memory.
rss 2360238080   # of bytes of anonymous and swap cache memory.
rss_huge 0
shmem 0
mapped_file 540672
dirty 0
writeback 2162688
swap 0
pgpgin 6545913
pgpgout 5526026
pgfault 1145124816
pgmajfault 0
inactive_anon 0
total_inactive_file 484167680
...
The page cache (cache) consumed almost 9 Gi memory, after excluding the total_inactive_file (~480Mi), it’s above 8 Gi.
Page cache is allocated by the operating system to improve the performance of disk I/O, after some investigation, we found we had a big file written by the app without file rotation, at that moment, it reached 100Gi.
We truncated that file and the page cache dropped down to tens of megabytes.
A thorough check routine
This is the complete memory layout we have now, based on this, a thorough check routine will be
- Find a pod with the issue, get the metrics
- memory_usage_bytes
- working_set_bytes
- memory_rss_bytes
- Check if the file cache (working_set_bytes - memory_rss_bytes) is high
working_set_bytes - memory_rss_bytesis the active page cache size, if it’s above hundreds of MBs or several GBs, it means I/O is quite heavy and OS improves it by caching file. Sometimes, it’s reasonable but usually you need to check if it’s what you expect. - Check if the rss is equal to memory usage
If so, check the application metrics instead, JVM metrics, Golang metrics etc.
Otherwise, things are interesting again …
Conclusion
Now we know page cache can be an important contributor to the memory increase, therefore we need to monitor the page cache size.
In Cadvisor, it’s container_memory_working_set_bytes - container_memory_rss, when the application is I/O intensive, the page cache can be high because the OS tries to improve the I/O efficiency, but for CPU intensive applications, take care of those unnecessary page cache.
 Share
Share
 Tweet
Tweet
 Pin
Pin
 Email
Email
 Share
Share
Recommend
About Joyk
Aggregate valuable and interesting links.
Joyk means Joy of geeK