

Simulating and Troubleshooting BLOCKED Threads in Kotlin [Video]
source link: https://dzone.com/articles/simulating-amp-troubleshooting-blocked-threads-in
Go to the source link to view the article. You can view the picture content, updated content and better typesetting reading experience. If the link is broken, please click the button below to view the snapshot at that time.

In this latest article of the series about simulating and troubleshooting performance problems in Kotlin, let’s discuss how to make threads go into a BLOCKED state. A thread will enter into a BLOCKED state if it can’t acquire a lock on an object because another thread already holds the lock on the same object and doesn’t release it.
Kotlin BLOCKED Thread Program
Here is a sample program that would make threads go into a BLOCKED state.
package com.buggyappclass BlockedApp {fun start() {println("BlockedApp:started")for (counter in 0..9) { // Launch 10 threads.AppThread().start()}}}class AppThread : Thread() {override fun run() {AppObject.something}}object AppObject {@get:Synchronizedval something: Unitget() {while (true) {try {Thread.sleep(6000000.toLong())} catch (e: Exception) {}}}}fun main() {println(BlockedApp().start())}
The sample program contains the BlockedApp class. This class has a start() method. In this method, 10 new threads are created. In the AppThread class there is a run() method that invokes the getSomething() method on the AppObject. In this getSomething() method, the thread is put to continuous sleep; i.e., the thread is repeatedly sleeping for 10 minutes again and again. But if you notice, the getSomething() method is a synchronized method. Synchronized methods can be executed by only one thread at a time. If any other thread tries to execute the getSomething() method while the previous thread is still working on it, then the new thread will be put in the BLOCKED state.
In this case, 10 threads are launched to execute the getSomething() method. However, only one thread will acquire a lock and execute this method. The remaining 9 threads will be put in a BLOCKED state.
NOTE: If threads are in BLOCKED state for a prolonged period, then the application may become unresponsive.
How To Diagnose BLOCKED Threads
You can diagnose BLOCKED threads either through a manual or automated approach.
Manual Approach
In the manual approach, you need to capture thread dumps as the first step. A thread dump shows all the threads that are in memory and their code execution path. You can capture a thread dump using one of the 8 options mentioned here. But an important criterion is: You need to capture the thread dump right when the problem is happening (which might be tricky to do). Once the thread dump is captured, you need to manually import the thread dump from your production servers to your local machine and analyze it using thread dump analysis tools like fastThread or samurai.
Automated Approach
On the other hand, you can also use the yCrash open source script, which would capture 360-degree data (GC log, 3 snapshots of thread dump, heap dump, netstat, iostat, vmstat, top, top -H, etc.) right when the problem surfaces in the application stack and analyze them instantly to generate root cause analysis report.
We used the automated approach. Below is the root cause analysis report generated by the yCrash tool highlighting the source of the problem.
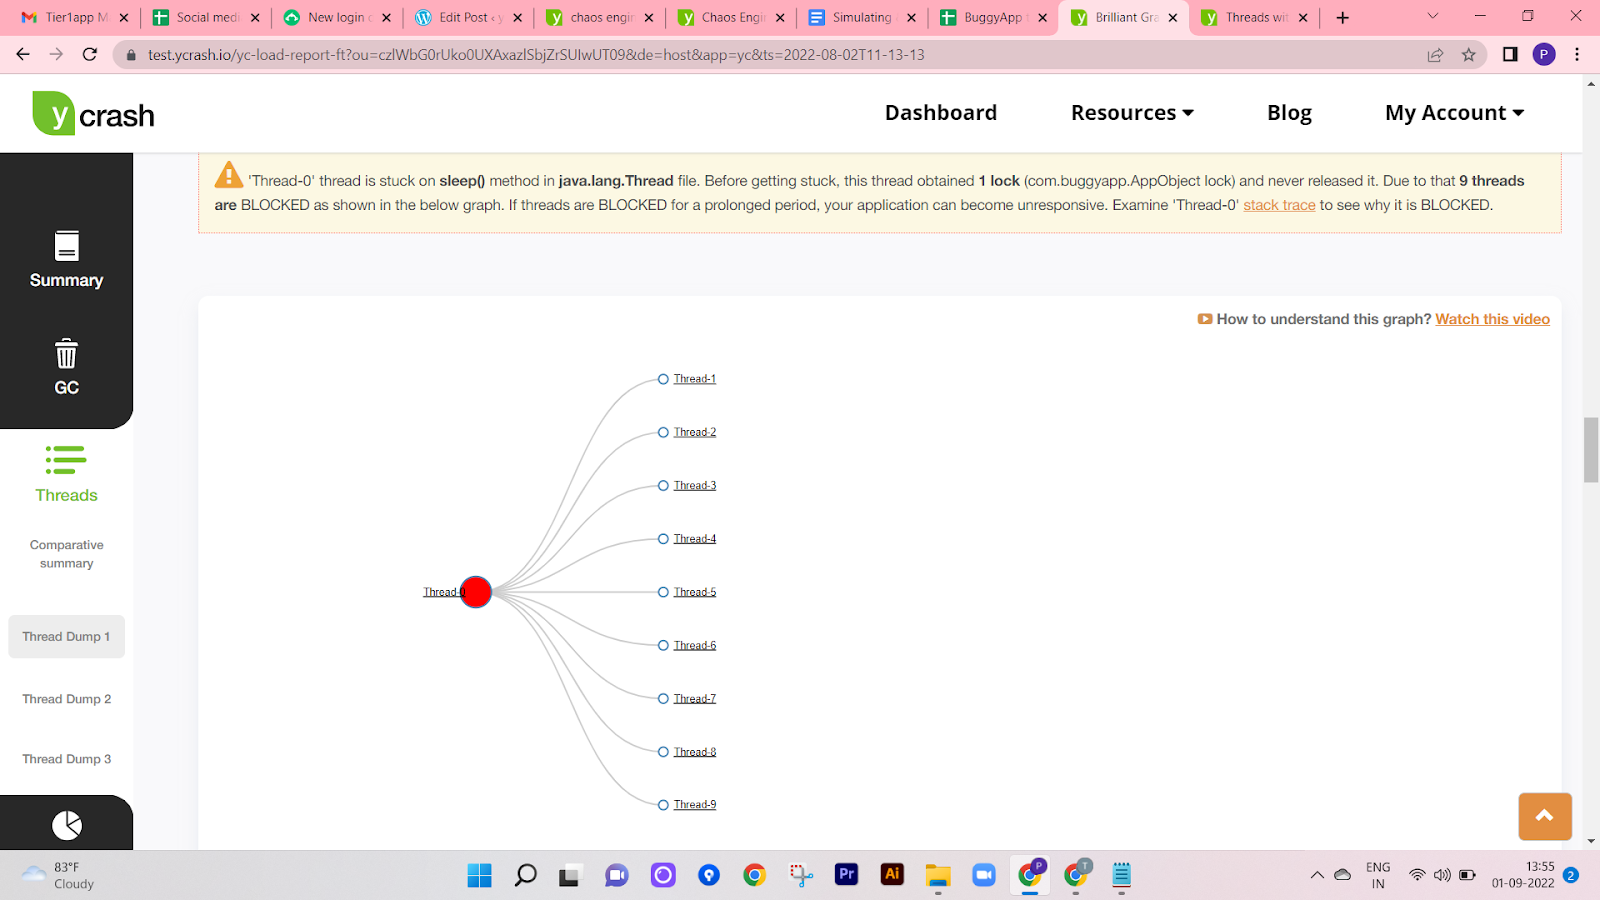
yCrash reporting transitive dependency graph of 9 BLOCKED threads
yCrash prints a transitive dependency graph that shows which threads are getting BLOCKED and who is blocking them. In this transitive graph, you can see "Thread-0" blocking 9 other threads. If you click on the thread names in the graph, you can see the stack trace of that particular thread.
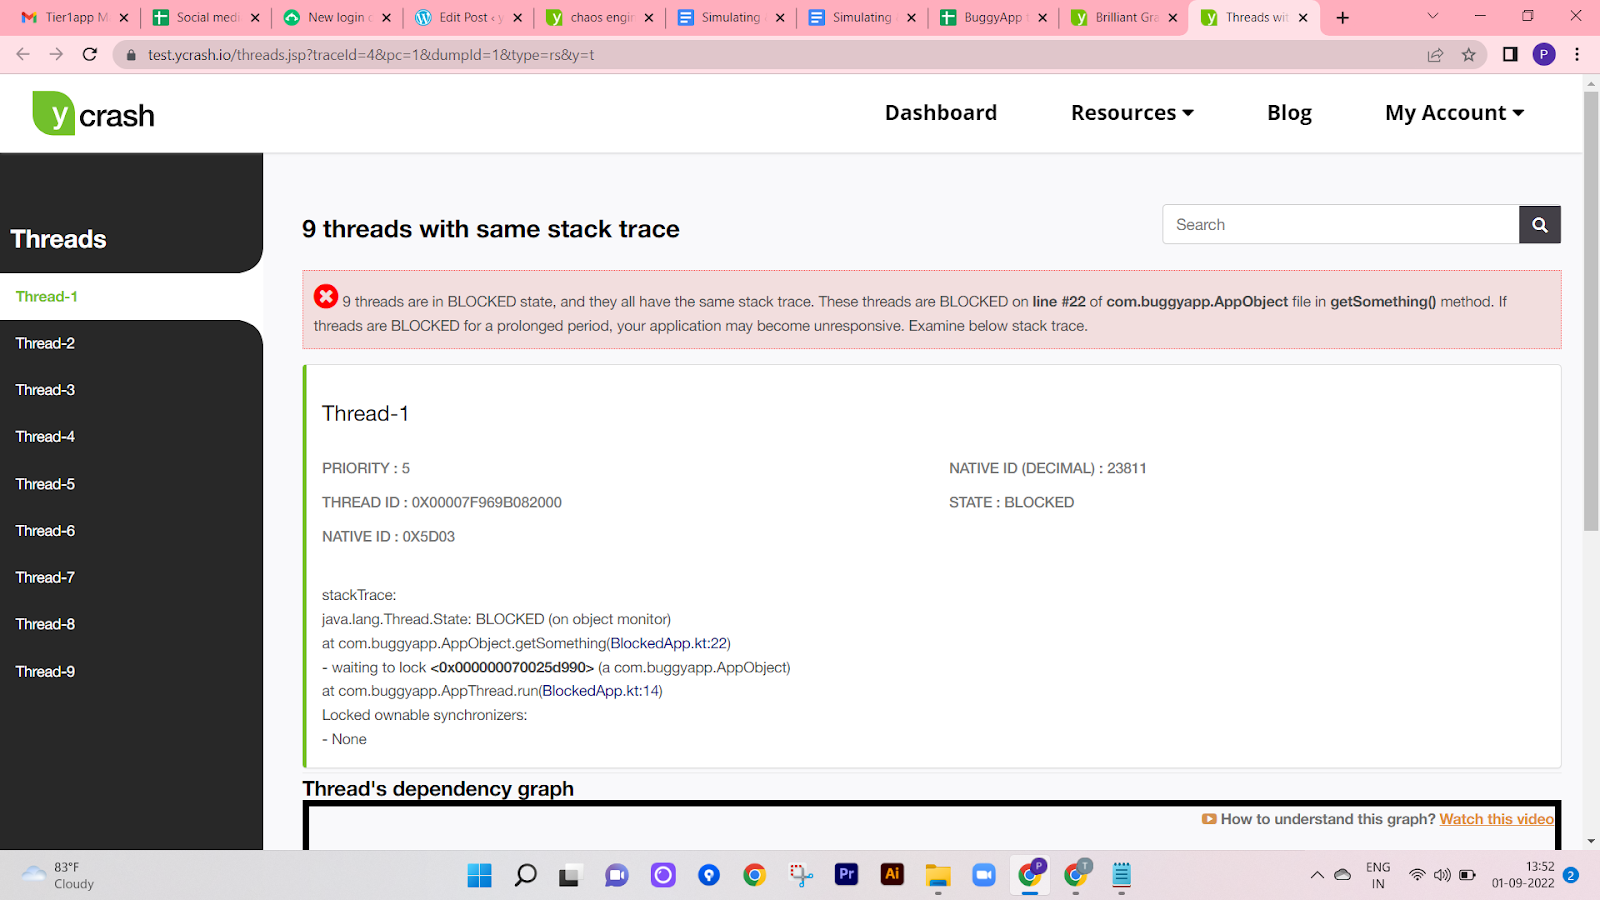
yCrash reporting the stack trace of 9 threads that are in BLOCKED state
Here is the screenshot that shows the stack trace of the 9 threads which are in the BLOCKED state and it’s also pointing out the stack trace in which they are stuck. From the stack trace, you can observe that thread is stuck on the com.buggyapp.blockedapp.AppObject#getSomething() method.
Equipped with this information, one can easily identify the root cause of the BLOCKED state threads.
Video
To see the visual walk-through of this post, click below:
Recommend
About Joyk
Aggregate valuable and interesting links.
Joyk means Joy of geeK